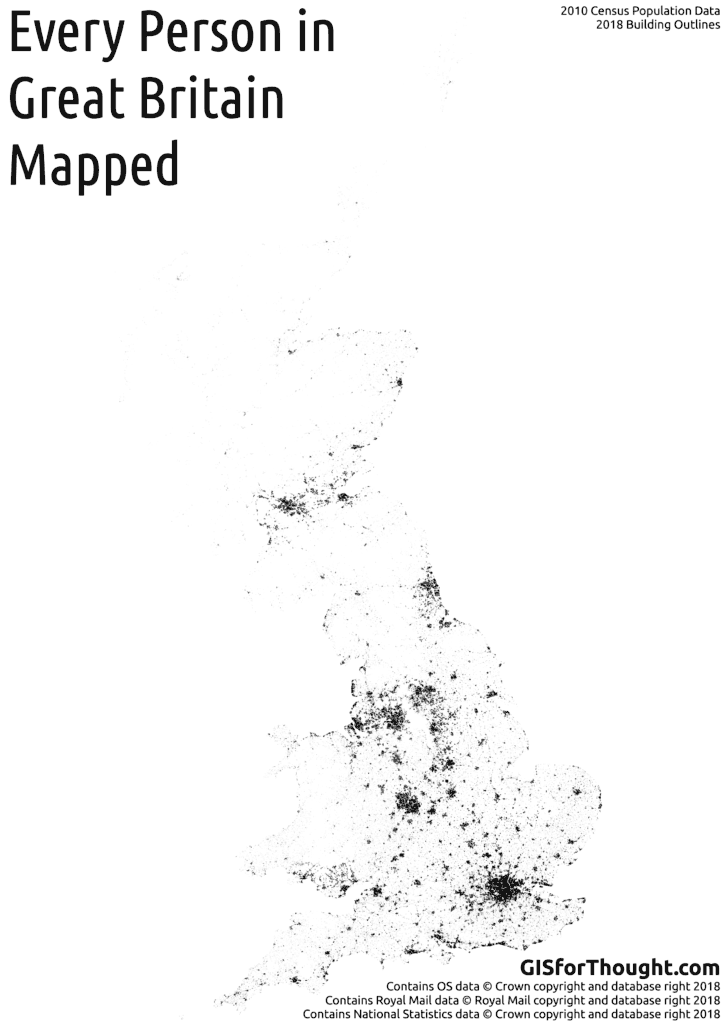
Every Person in Scotland on the Map

Winner of the 2016 OS OpenData Award for Excellence in the use of OpenData from the British Cartographic Society.

Full size.

The mapping process creates a random point within a building shell inside of a postcode area, which is repeated for every person in a postcode. This is in contrast to a simpler process, which does not take into account buildings at all, working simply with postcode areas. This can be seen in my previous post: Population of Scotland Mapped

Inspired by:
The Guardian – Every person in England and Wales on a map by Chris Cross

Based on the 2011 Scottish Census population data.

Data from the National Records of Scotland.

Combined with the Ordnance Survey, Open Map product.

Rendered with: QGIS tile writer python script.

Forth Road Bridge Closure Impact on Drive Times

In honour of the Forth Road Bridge re-opening completely. I created a map of the impact it has had on drive times from Edinburgh.

This is based on the OS Open Roads Product, using pgRouting, and network generated using the guide from Ross McDonald.

This does not take into account the increase of traffic on the other routes, or traffic in general. Would be interesting to see a real impact map from one of the major navigation providers.

Drive time with and without the forth road bridge

Difference the forth road bridge closue caused map

Mapping Glasgow Districts

First update: Glasgow Regions Mapped – Progress Update 1

Lets map the districts/regions/neighbourhoods/suburbs of Glasgow. The divisions of a city can be hard to distinguish, there are no hard boundaries between regions and these can be dynamic over time. Where does the West End begin? As soon as you cross the M8, or later? Where does the West End end? Before Partick, halfway through, or well past Scotstoun? Have your say!

People Make Glasgow, help define its boundaries.

This was done successfully in Boston: Bostonography – Neighborhoods as seen by the people.

Although Boston is a significantly easier target. Their map covered 21 different neighbourhoods. According to Wikipedia, Glasgow has at least 145 districts.

This will only be significant if we get a good number of responses. So please feel free to share!

Made possible by: Nick Martinelli from extent(PNW). Code on GitHub.

Map Glasgow’s Regions.

The Great Polish Map of Scotland Revisited

A lot of progress has been made since my last visit: Visiting the Great Polish Map of Scotland

This time I had a bit more time, staying overnight with the very accomodating girlfirend at the Barony Castle Hotel. The steak was excellent, but the sauna was not very hot. Overall a good experience though.

PANO_20151031_145802

PANO_20151031_145722

PANO_20151031_145635

As you can see from the photos restoration works are in full progress.

IMG_20151101_110954

And dontains can be made to the worthy cause at: MapaScotland.org

IMG_20151031_152433

For a view of the way up to the map, see my first post on Mapillary:

Multi Ring Buffer – Buffer the Buffer or Incrementally Increasing Distance?

Does it matter, and who cares?

Multi-ring buffers can be useful for simple distance calculations as seen in:
X Percent of the Population of Scotland Lives Within Y Miles of Glasgow
And:
X Percent of the Population of Scotland Lives Within Y Miles of Edinburgh

For these I simply created multiple buffers using the QGIS buffer tool. This works for small samples, but was quite frustrating. I had initially hoped to do the whole analysis in SQLite, which worked pretty well initally, but struggled on the larger buffers. It took too long to run the queries, and did not allow for visualisation. I think using PostGIS would however be pretty feasible.

But creating a multi-ring buffer plugin for QGIS also seemed like a good learning experience. Which got me thinking, does it matter if you create increasingly large buffers around the original feature, or if you buffered the resulting buffer sequentially. My hypothesis was that there would be pretty significant differences due to the rounding of corners.

I asked on StackExchange but the conversation did not really take off:
http://gis.stackexchange.com/questions/140413/multi-ring-buffer-methodology

My question is not about the overlapping-ness of the buffers, since I think multi-ring buffers should be “doughnuts” anyway. But rather if smoothing will occur. The only answer was to try it myself.

Buffer styles:
Buffer the resulting buffer sequentially: Sequential
Buffer the original feature with increasing buffer distance: Central
[table caption=”Speed – In seconds”]
Features, Rings,Central, Sequential
1, 5, 0.59, 0.56
55, 5, 8.06, 6.38
1, 200, 60.83, 31.76
3, 200, 62.89, 40.89
55, 200, 628.38, 586.67
1, 2000, 203.84, 67.00
[/table]

No matter how you do it the sequential style is quicker, but that may be down to my code.

Rendering

Interestingly, although understandably, the sequential style results in a lot more vertices in the outer rings. For comparison, for a 500 ring buffer the outermost ring had the following vertice counts:
[table]
Style, Vertices
Central,488
Sequential,30918
[/table]

We can see this with editing turned on.
Central:
Central_editing
Sequential:
Sequential_editing

We can also see a smoother profile in the sequential buffer. However the difference is not major, and hard to discern with the naked eye.

So we have at most about around a 10m discrepancy, with 500 50m rings, so around 25000m of distance from the original feature.
Screenshot[34]
This impacts rendering time dramatically, an example with our 500 rings:

Central:

Sequential:

So quicker to create but slower to draw. So which one is better, quicker calculation, or quicker rendering? Or should we not do 200+ ring buffers?

Hard to say. In version 0.2 of the Multi Ring Buffer Plugin. There is an option for either in the advanced tab.

Plugin: https://plugins.qgis.org/plugins/Multi_Ring_Buffer/
Please report any issues through GitHub: https://github.com/HeikkiVesanto/QGIS_Multi_Ring_Buffer/issues