As part of the 2016 Irish Census the Central Statistics Office captured data on communing to work and school/college (POWSCAR). The raw data is available for research purposes, but the anonymised data is available to all. This data is aggregated to an Electoral Division (ED) level.
There are 3440 EDs in Ireland, 3409 after amalgamating low population ones. These are legally defined administrative areas. Commutes into Northern Ireland are also captured, but only as one destination (Northern Ireland).
Overall the data consists of a CSV file with 291893 rows of commuting data.
Maps inspired by Dónal Casey.
Ireland
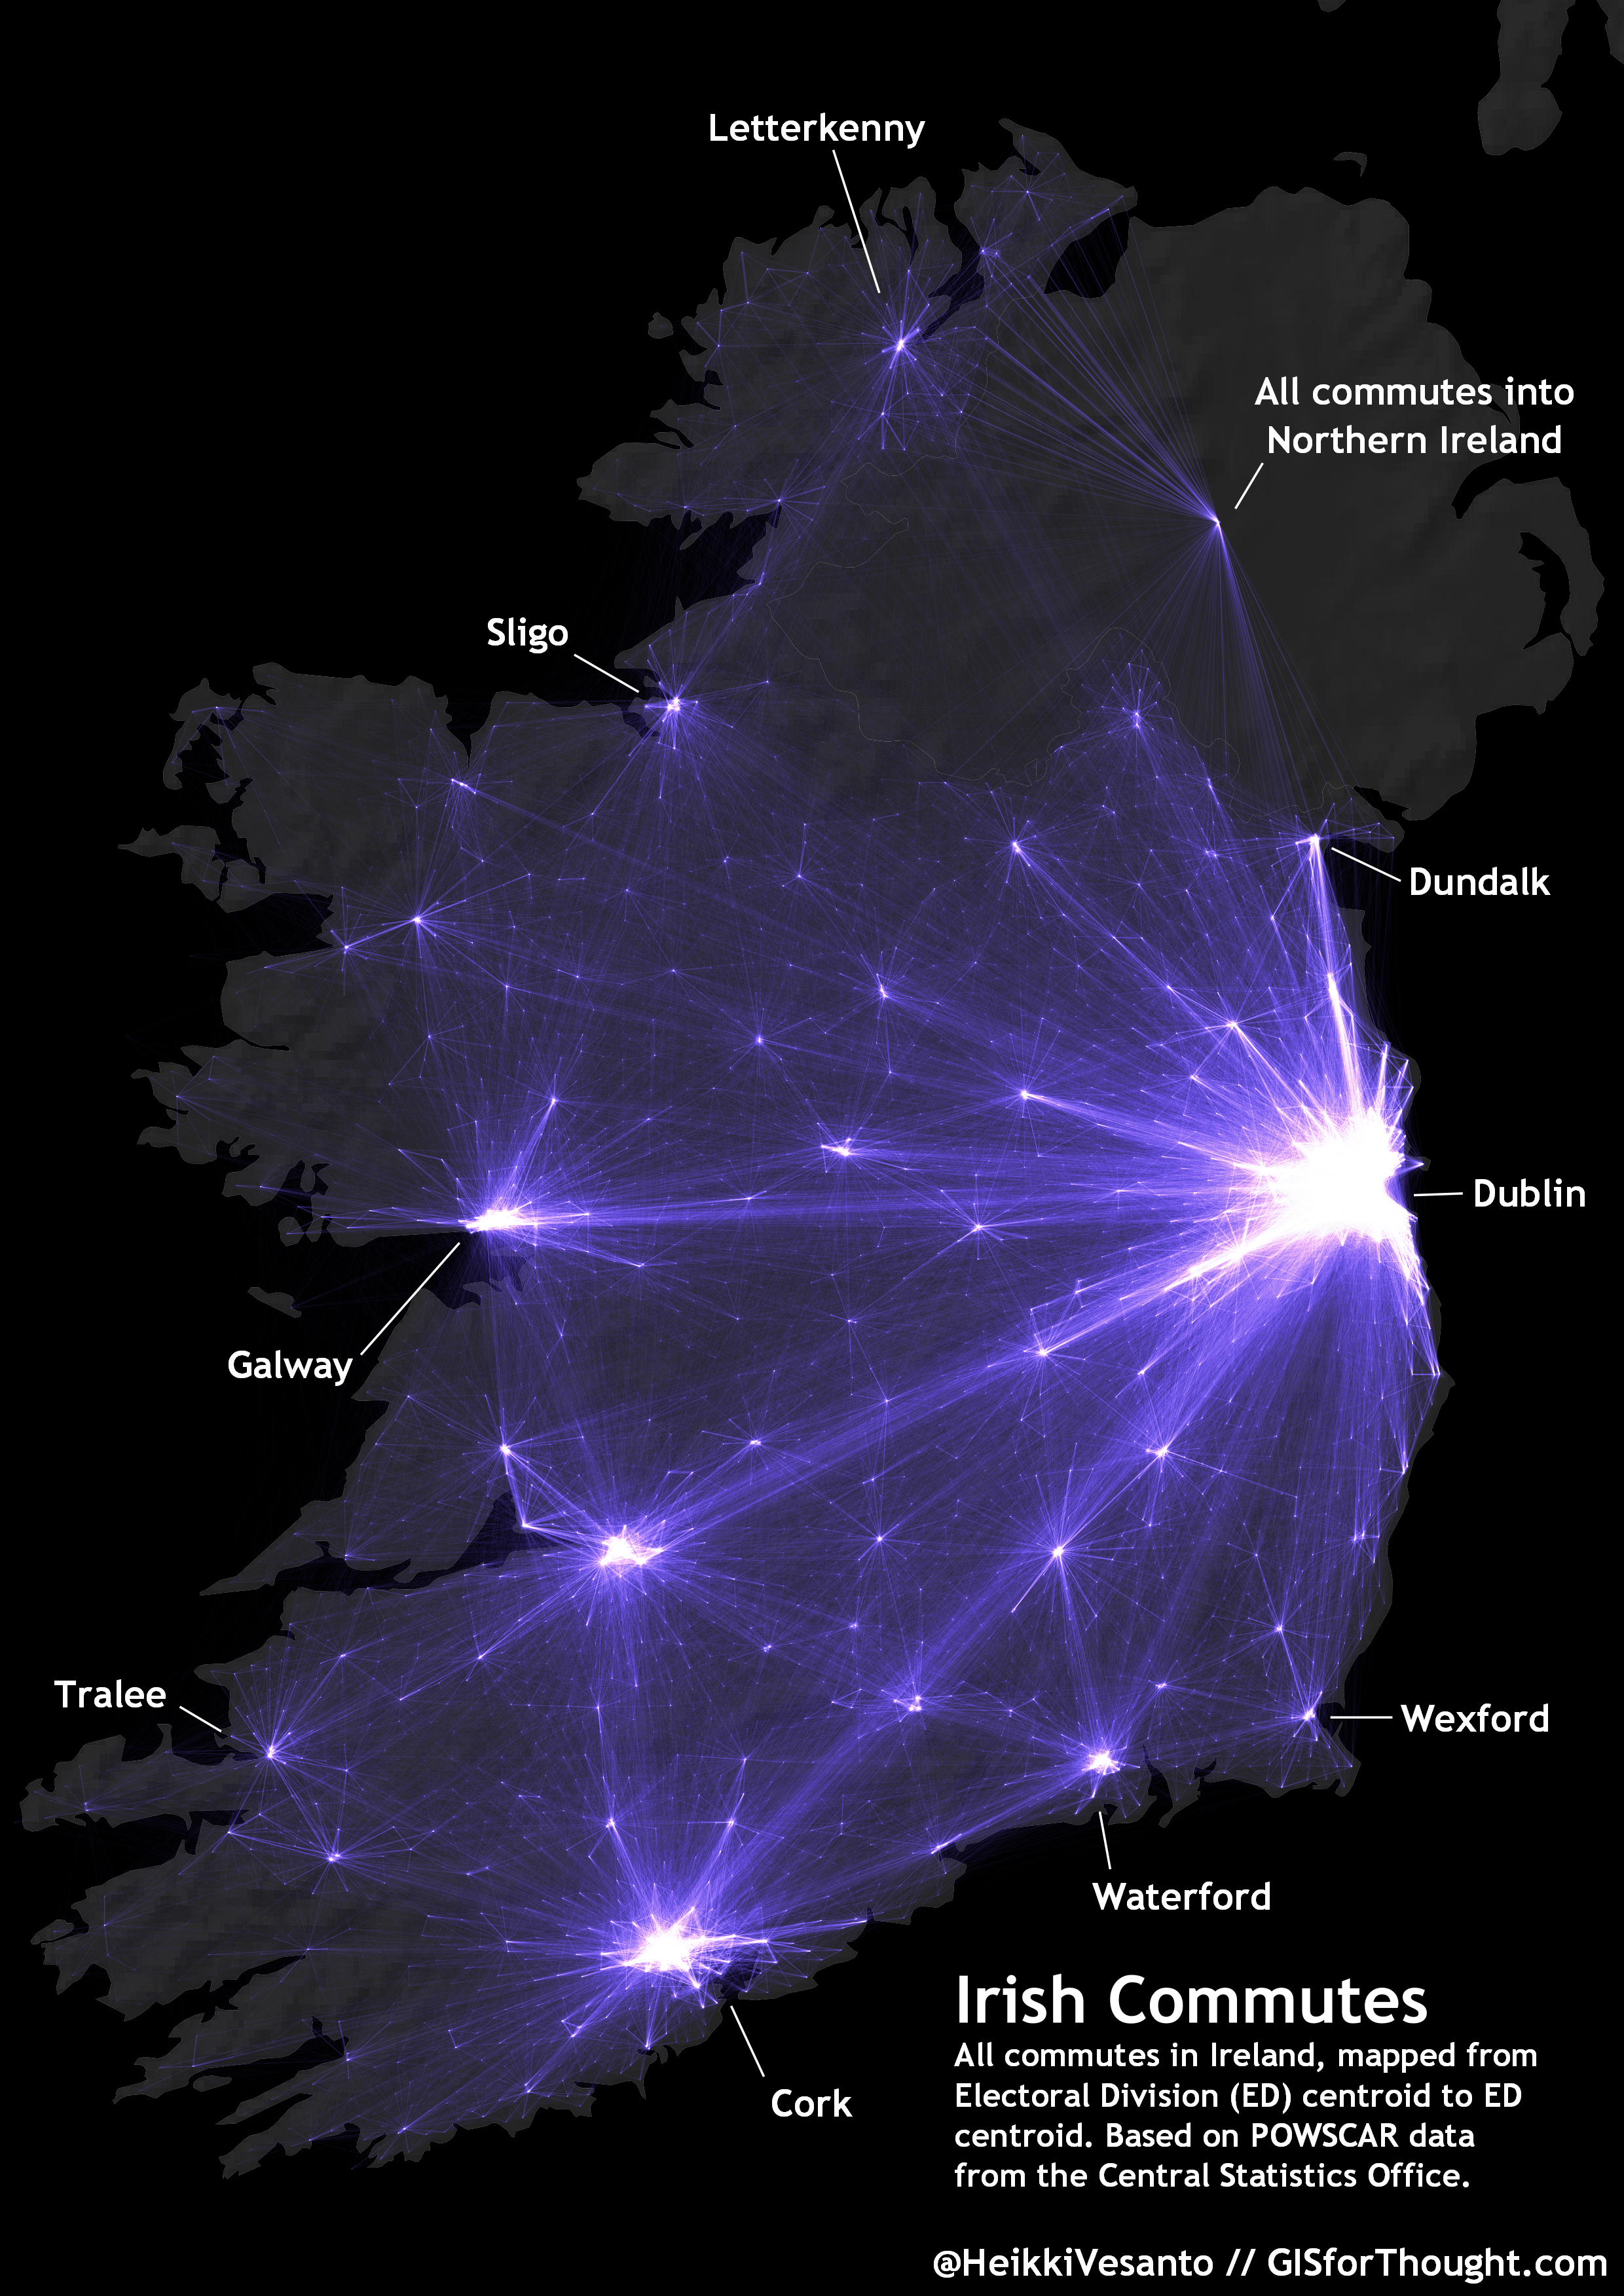
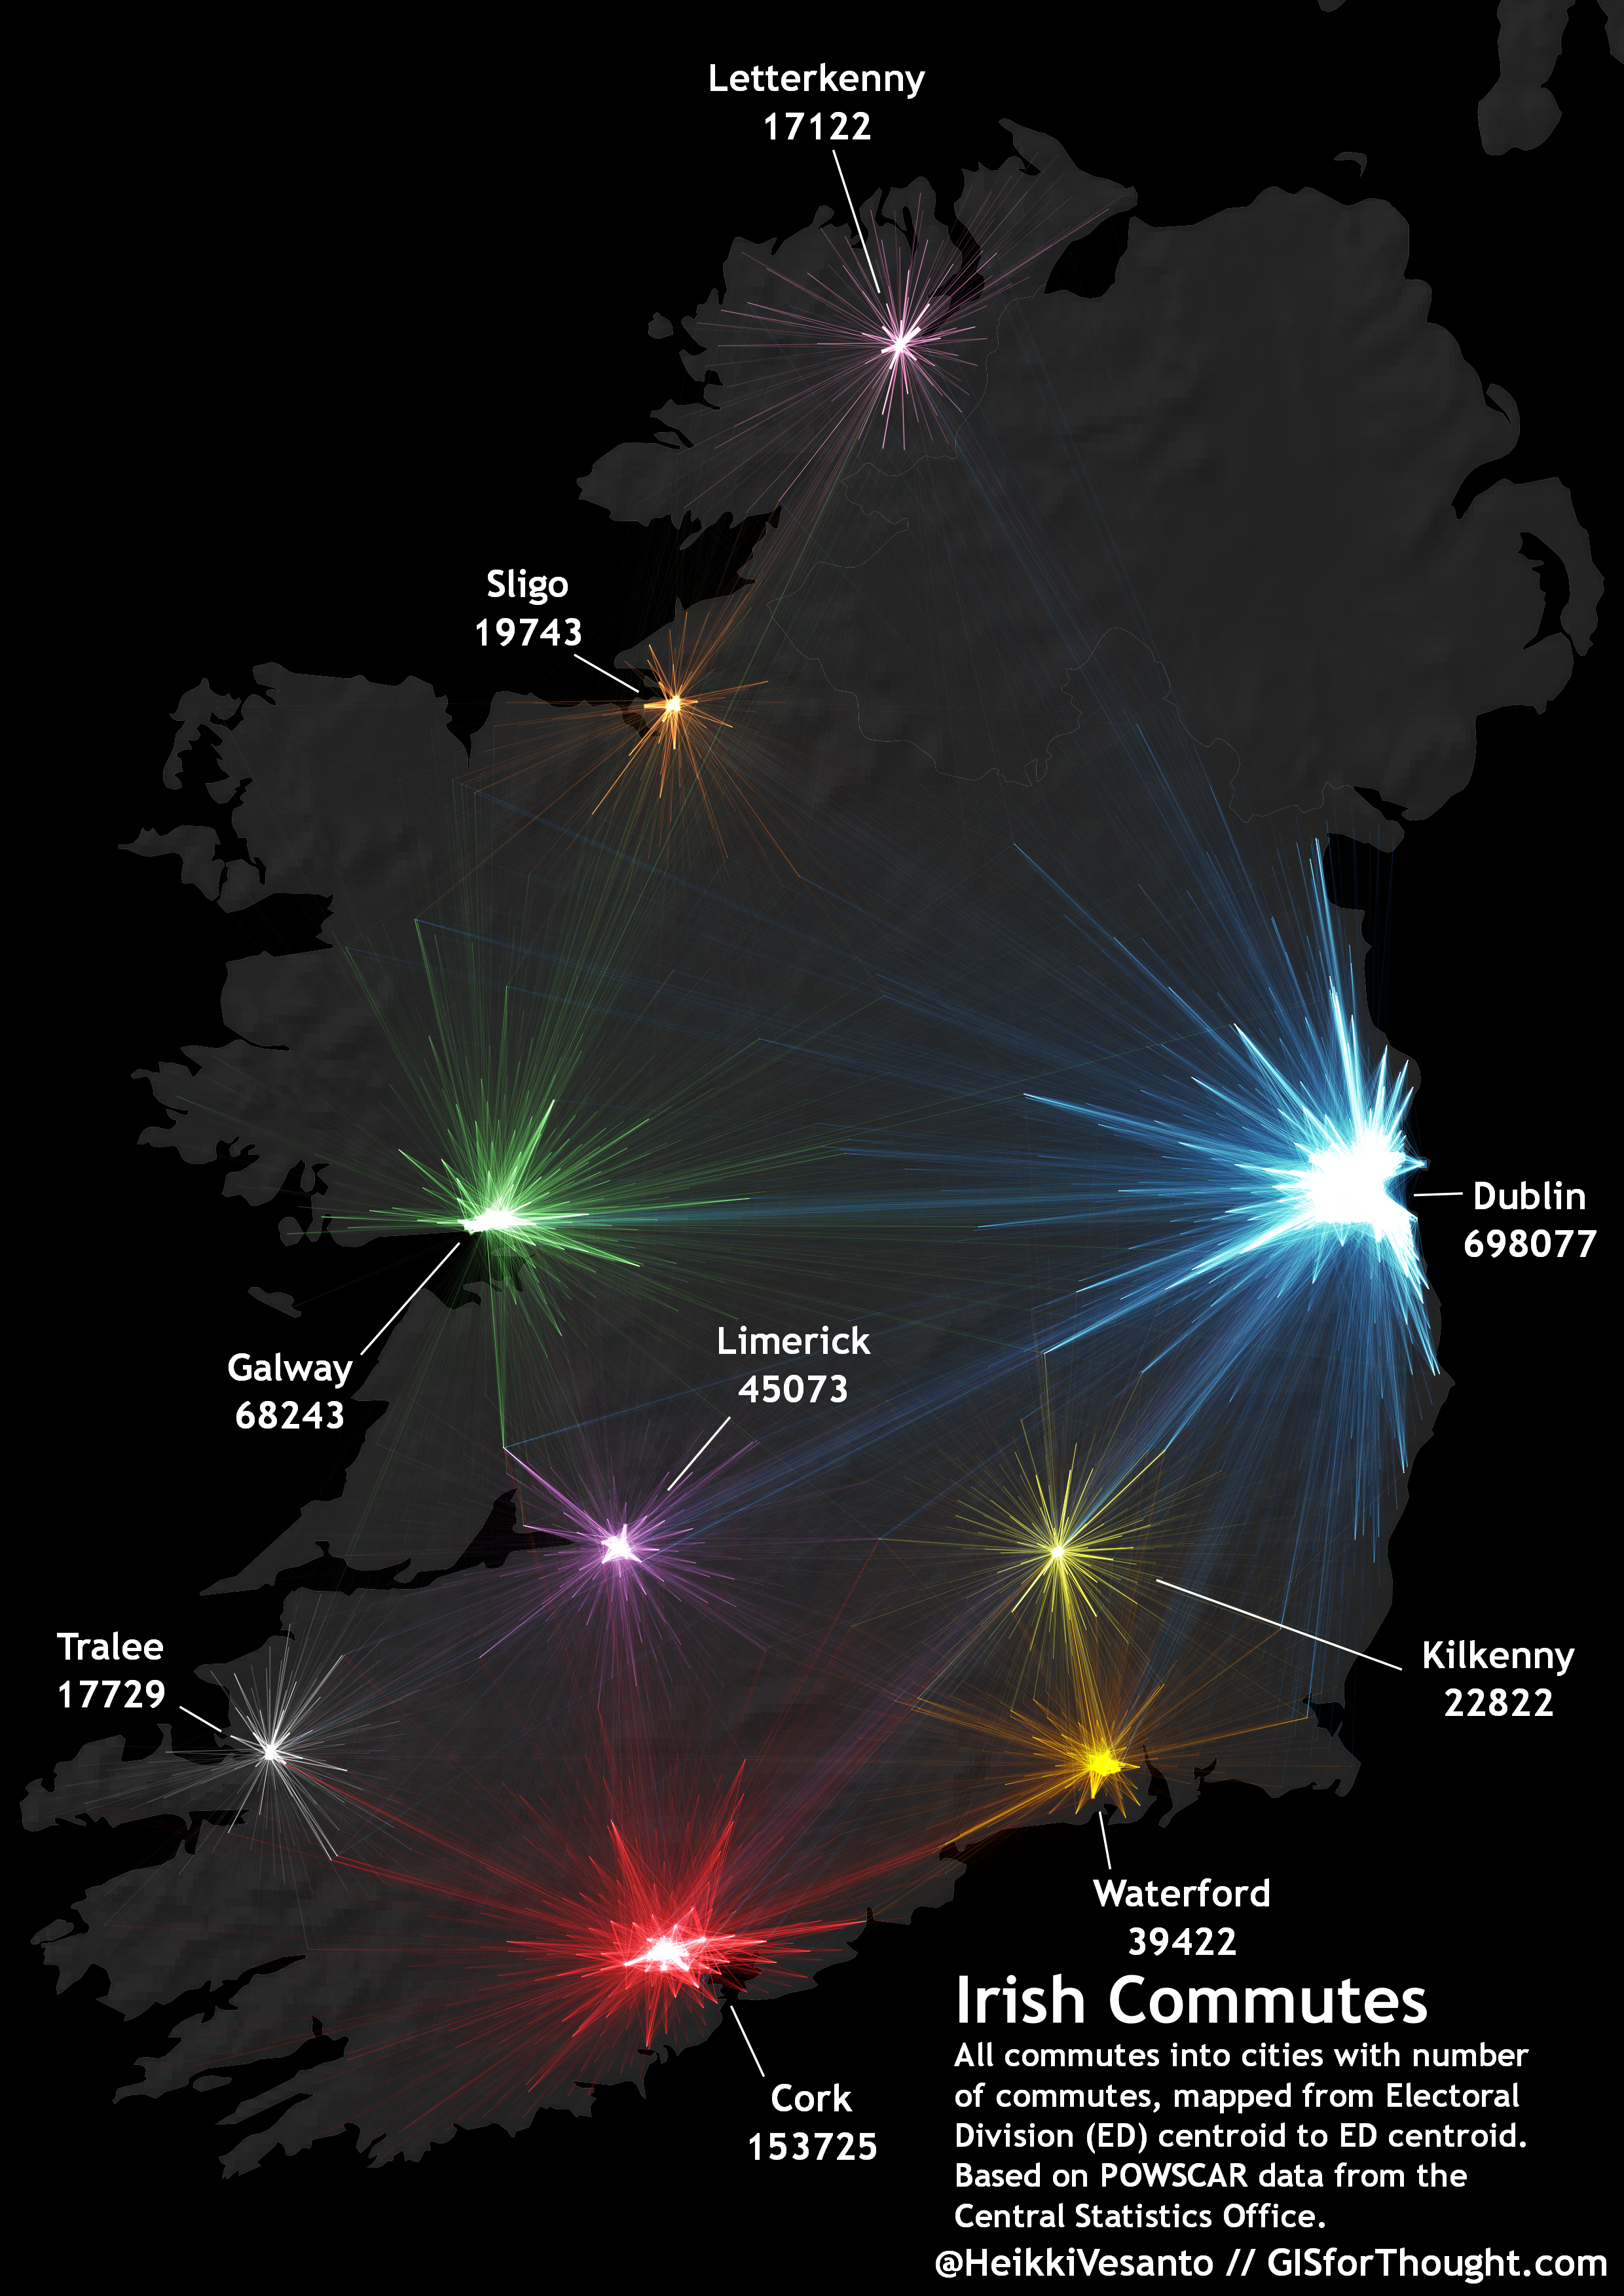
Mapping Irish commuting data at a country level allows us to see the patterns of commuting.
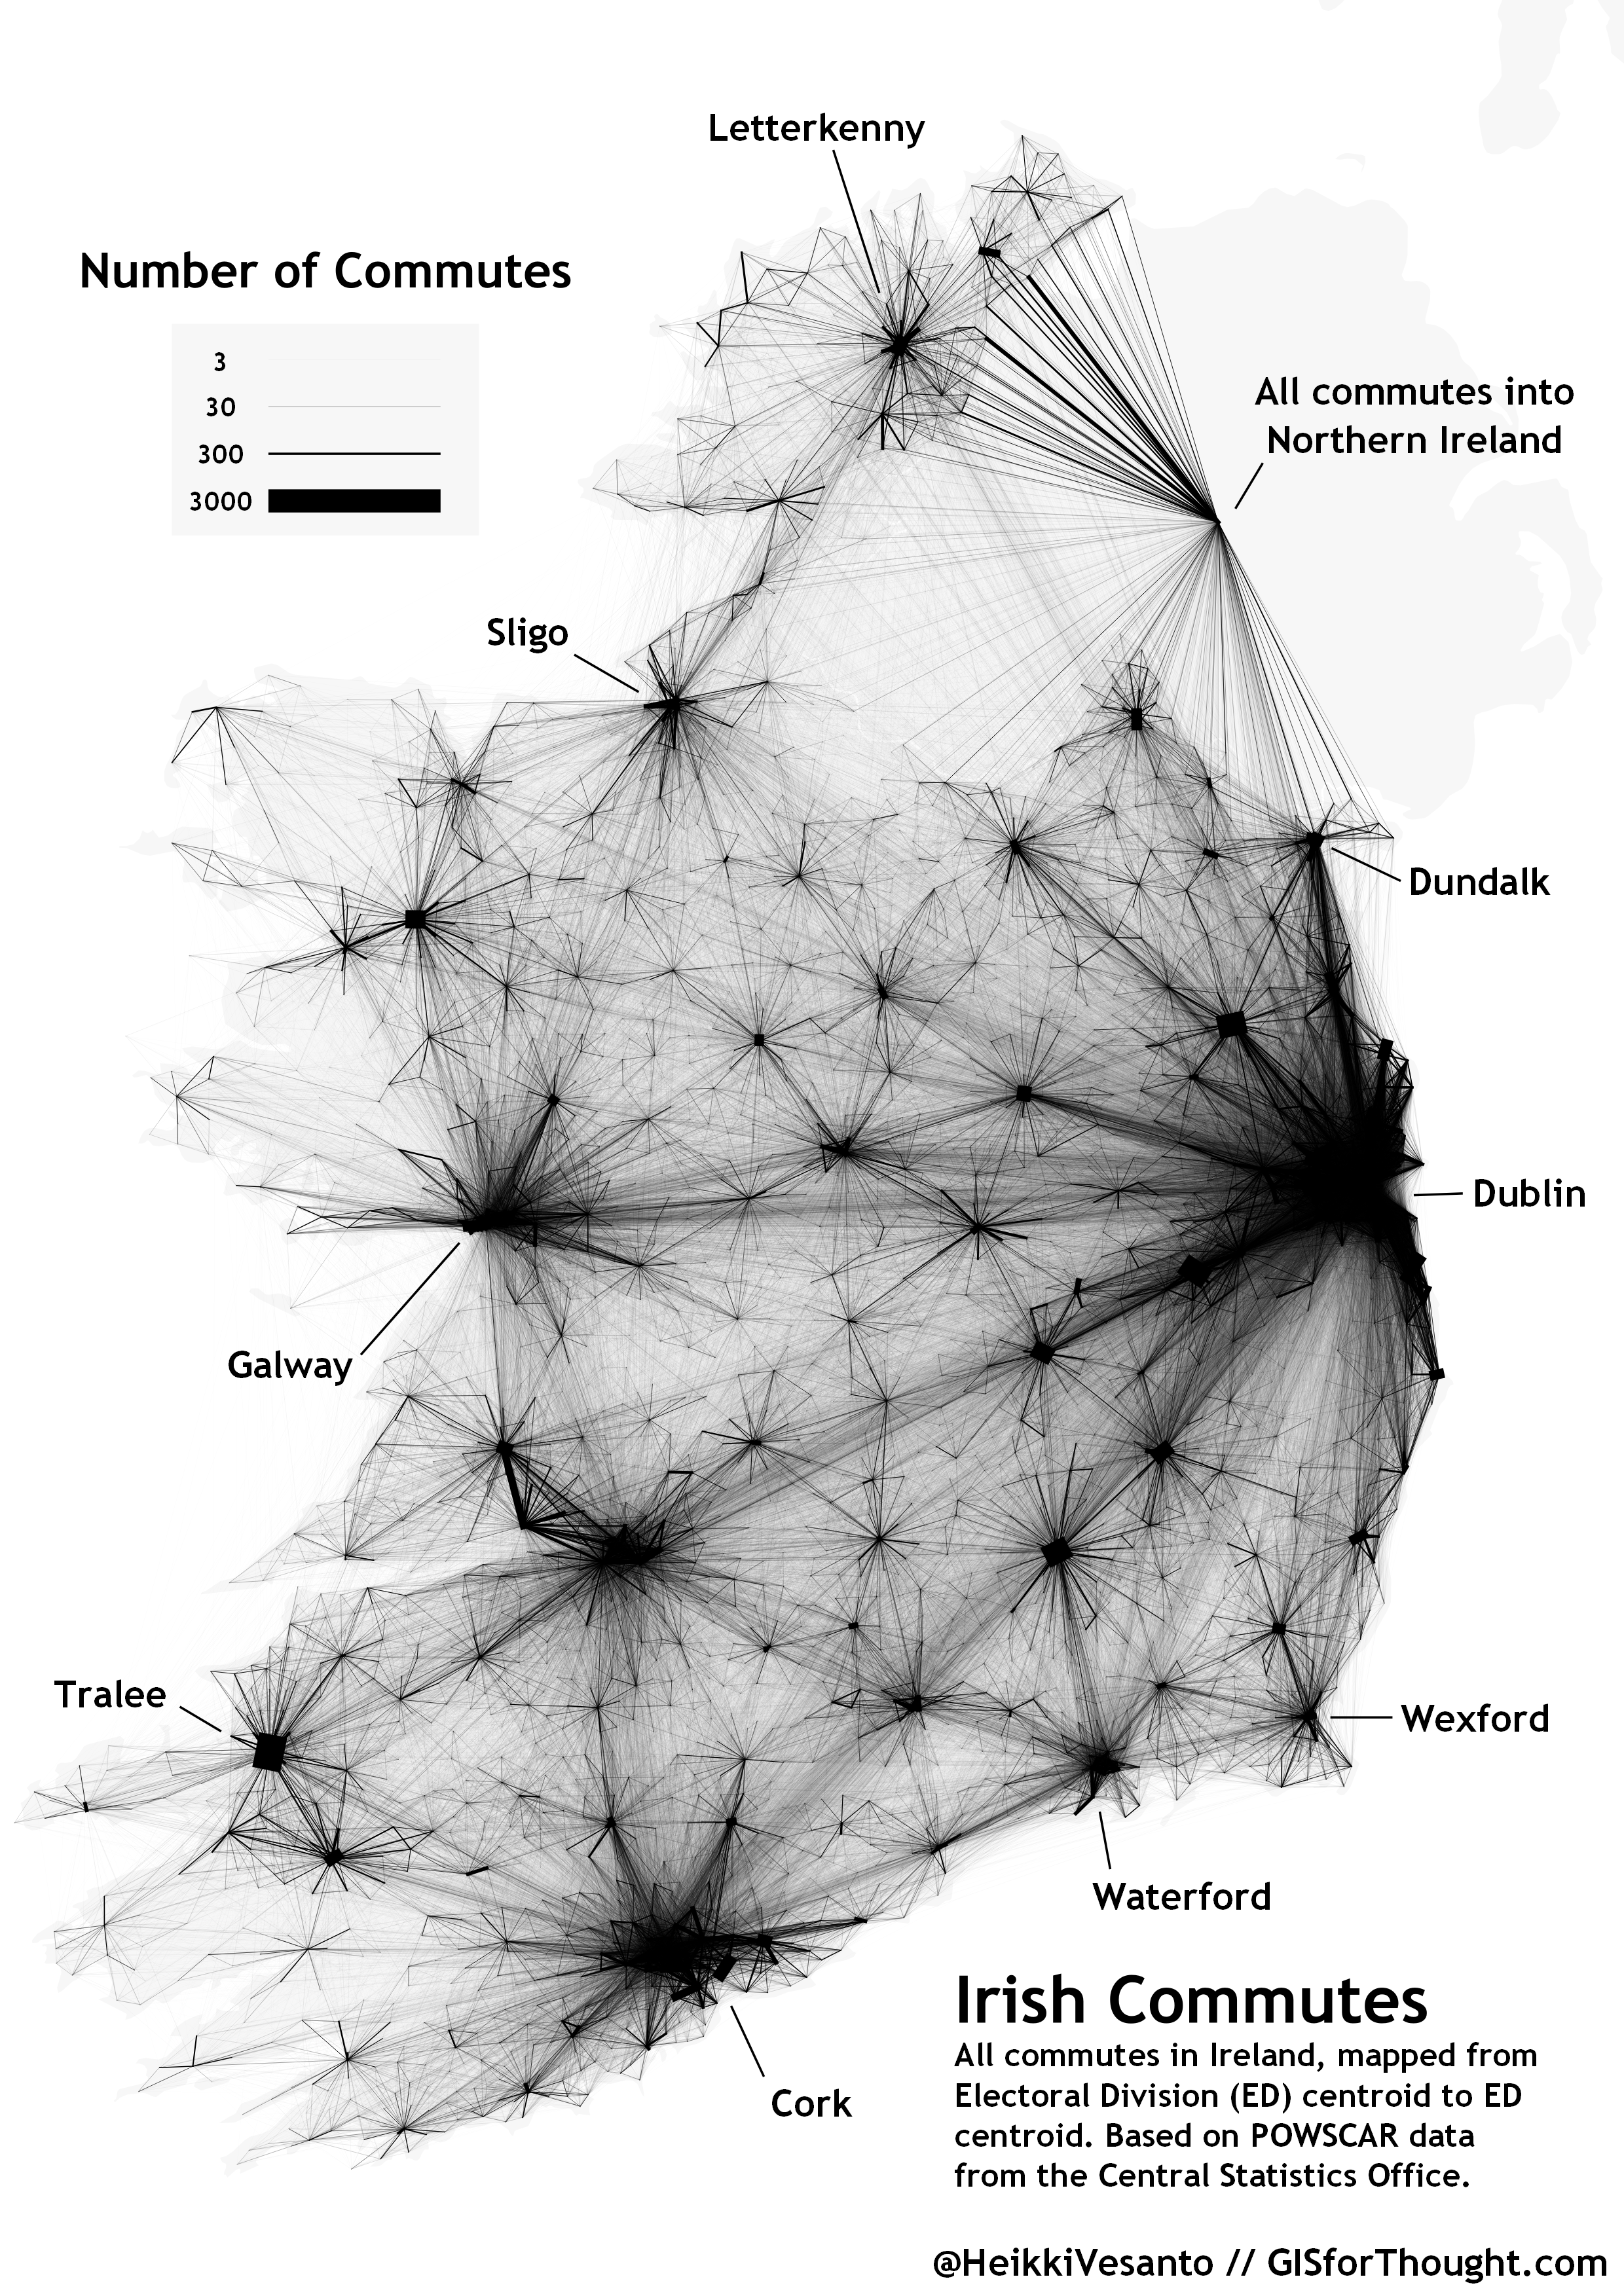
The map styles can easily be achieved in QGIS. They utilise blending modes and variable levels of symbology based on the commuter counts.
A great guide can be found on this from the Ordnance Survey. Carto tips: Using blend modes and opacity levels
I also talk about this at my FOSS4GUK 2019 talk: YouTube – IE
FOSS4GUK LIVE – Main Room / Biosphere Green – DAY 2
The purple map above use color: #6450d7 – Addition blend – 100% opacity – Line thickness: if (“count”>1000, 1000, “count”)/1000
Gold:
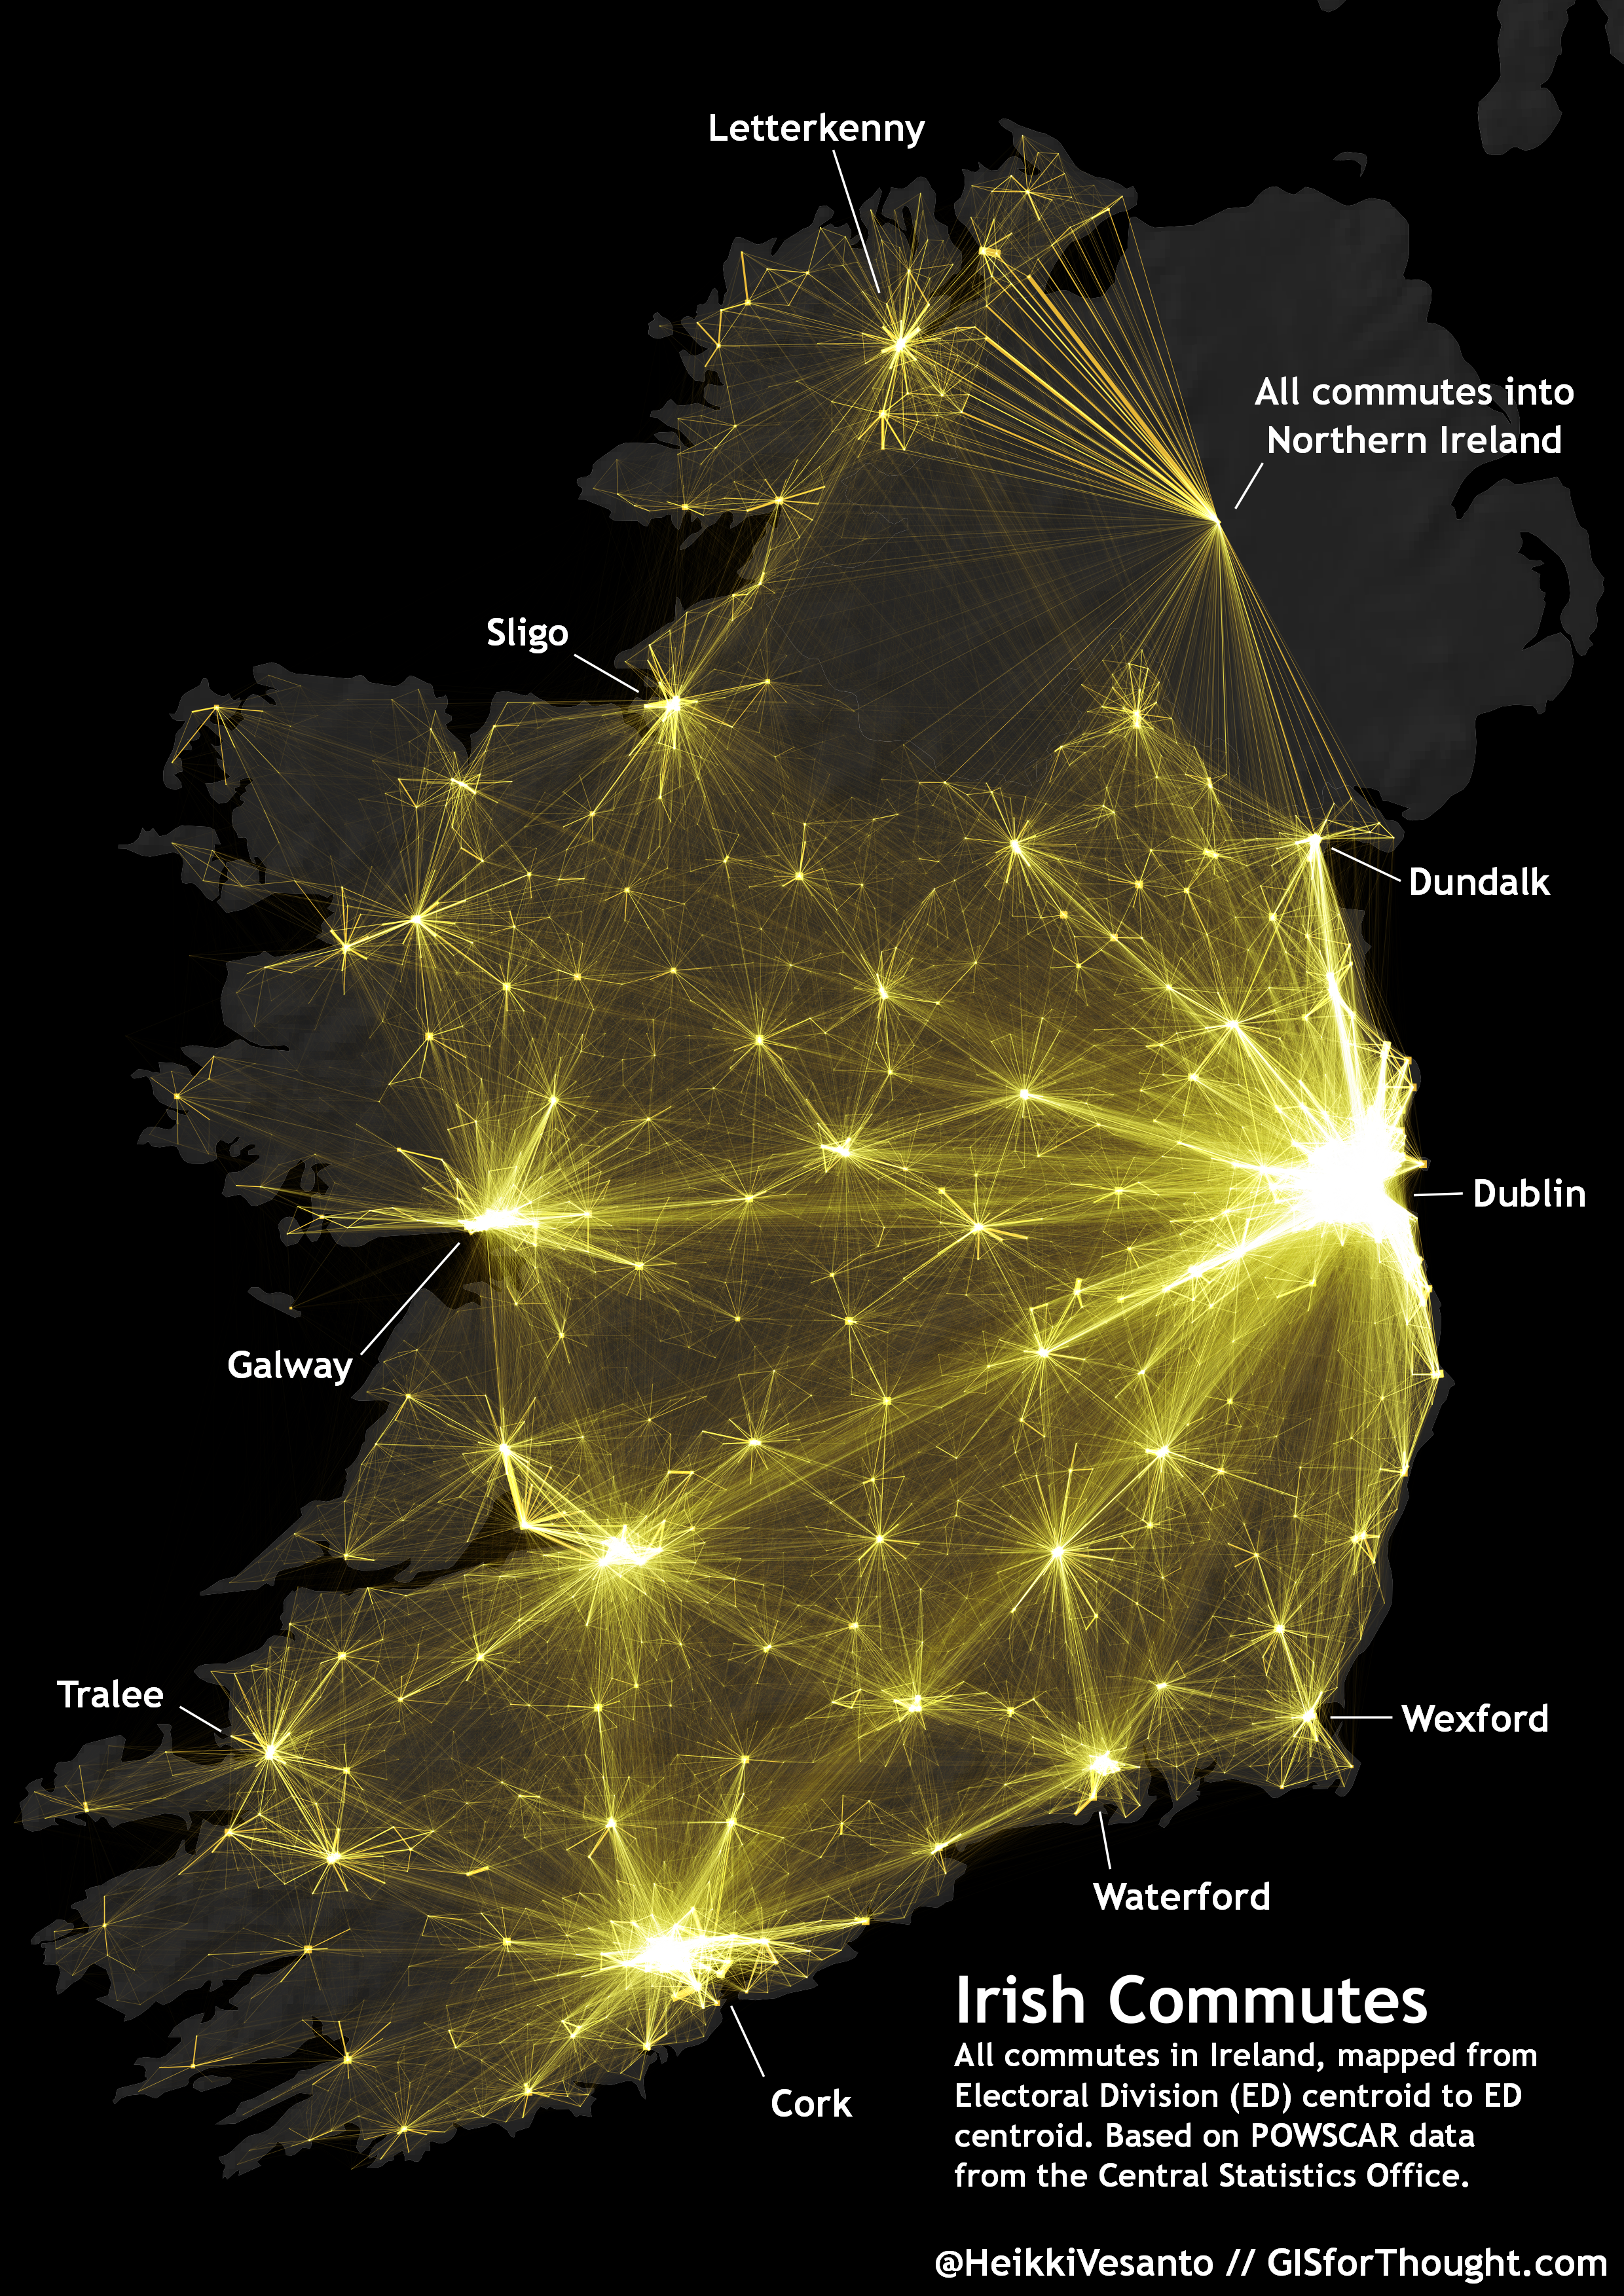
Color: #e5b636 – Addition blend – 100% opacity
This map was featured in the 2020 GeoHipster calendar.
Black and White:
Nine largest cities:
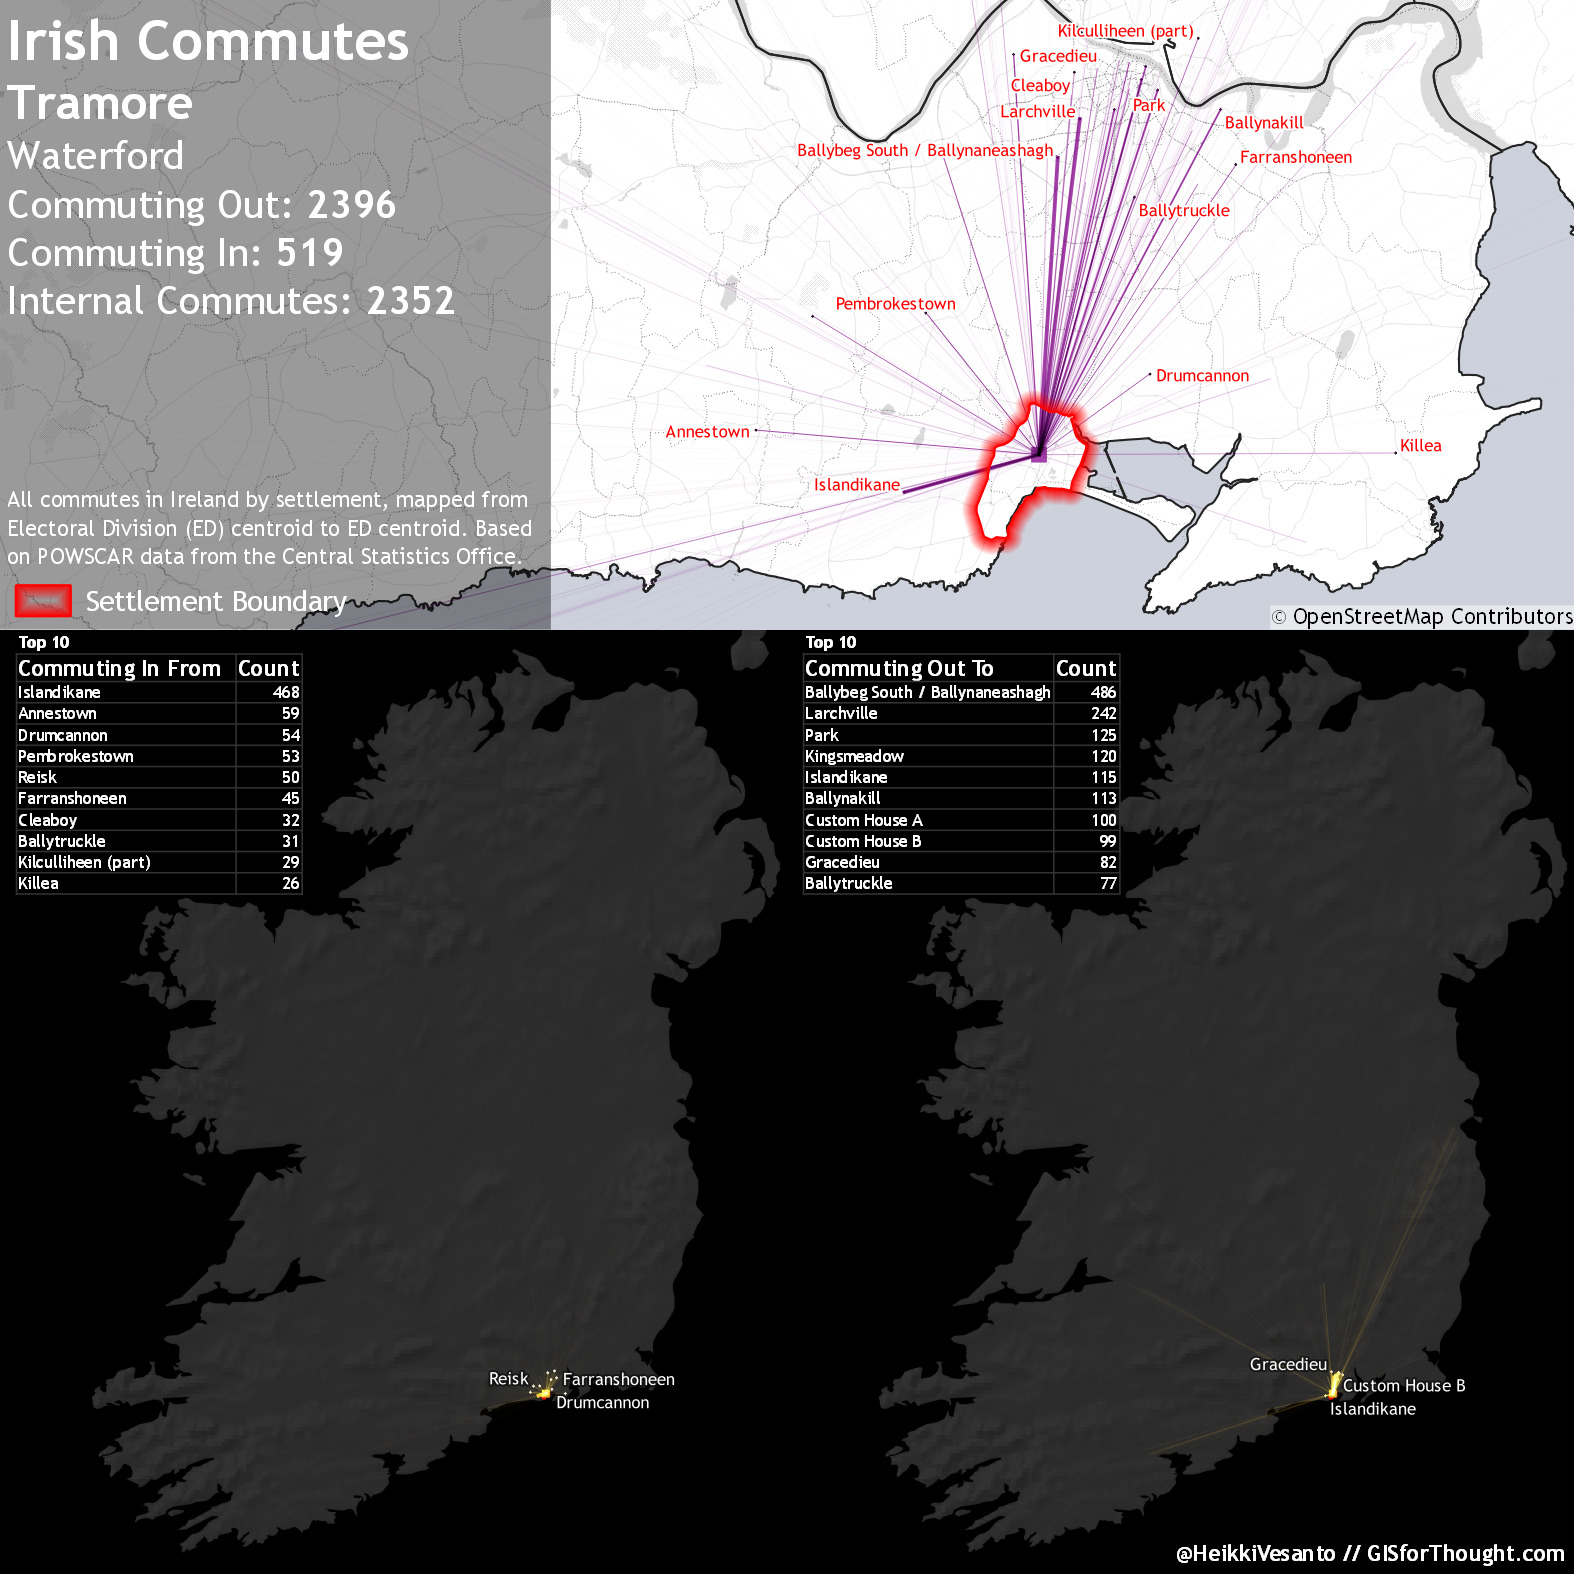
Individual Cities
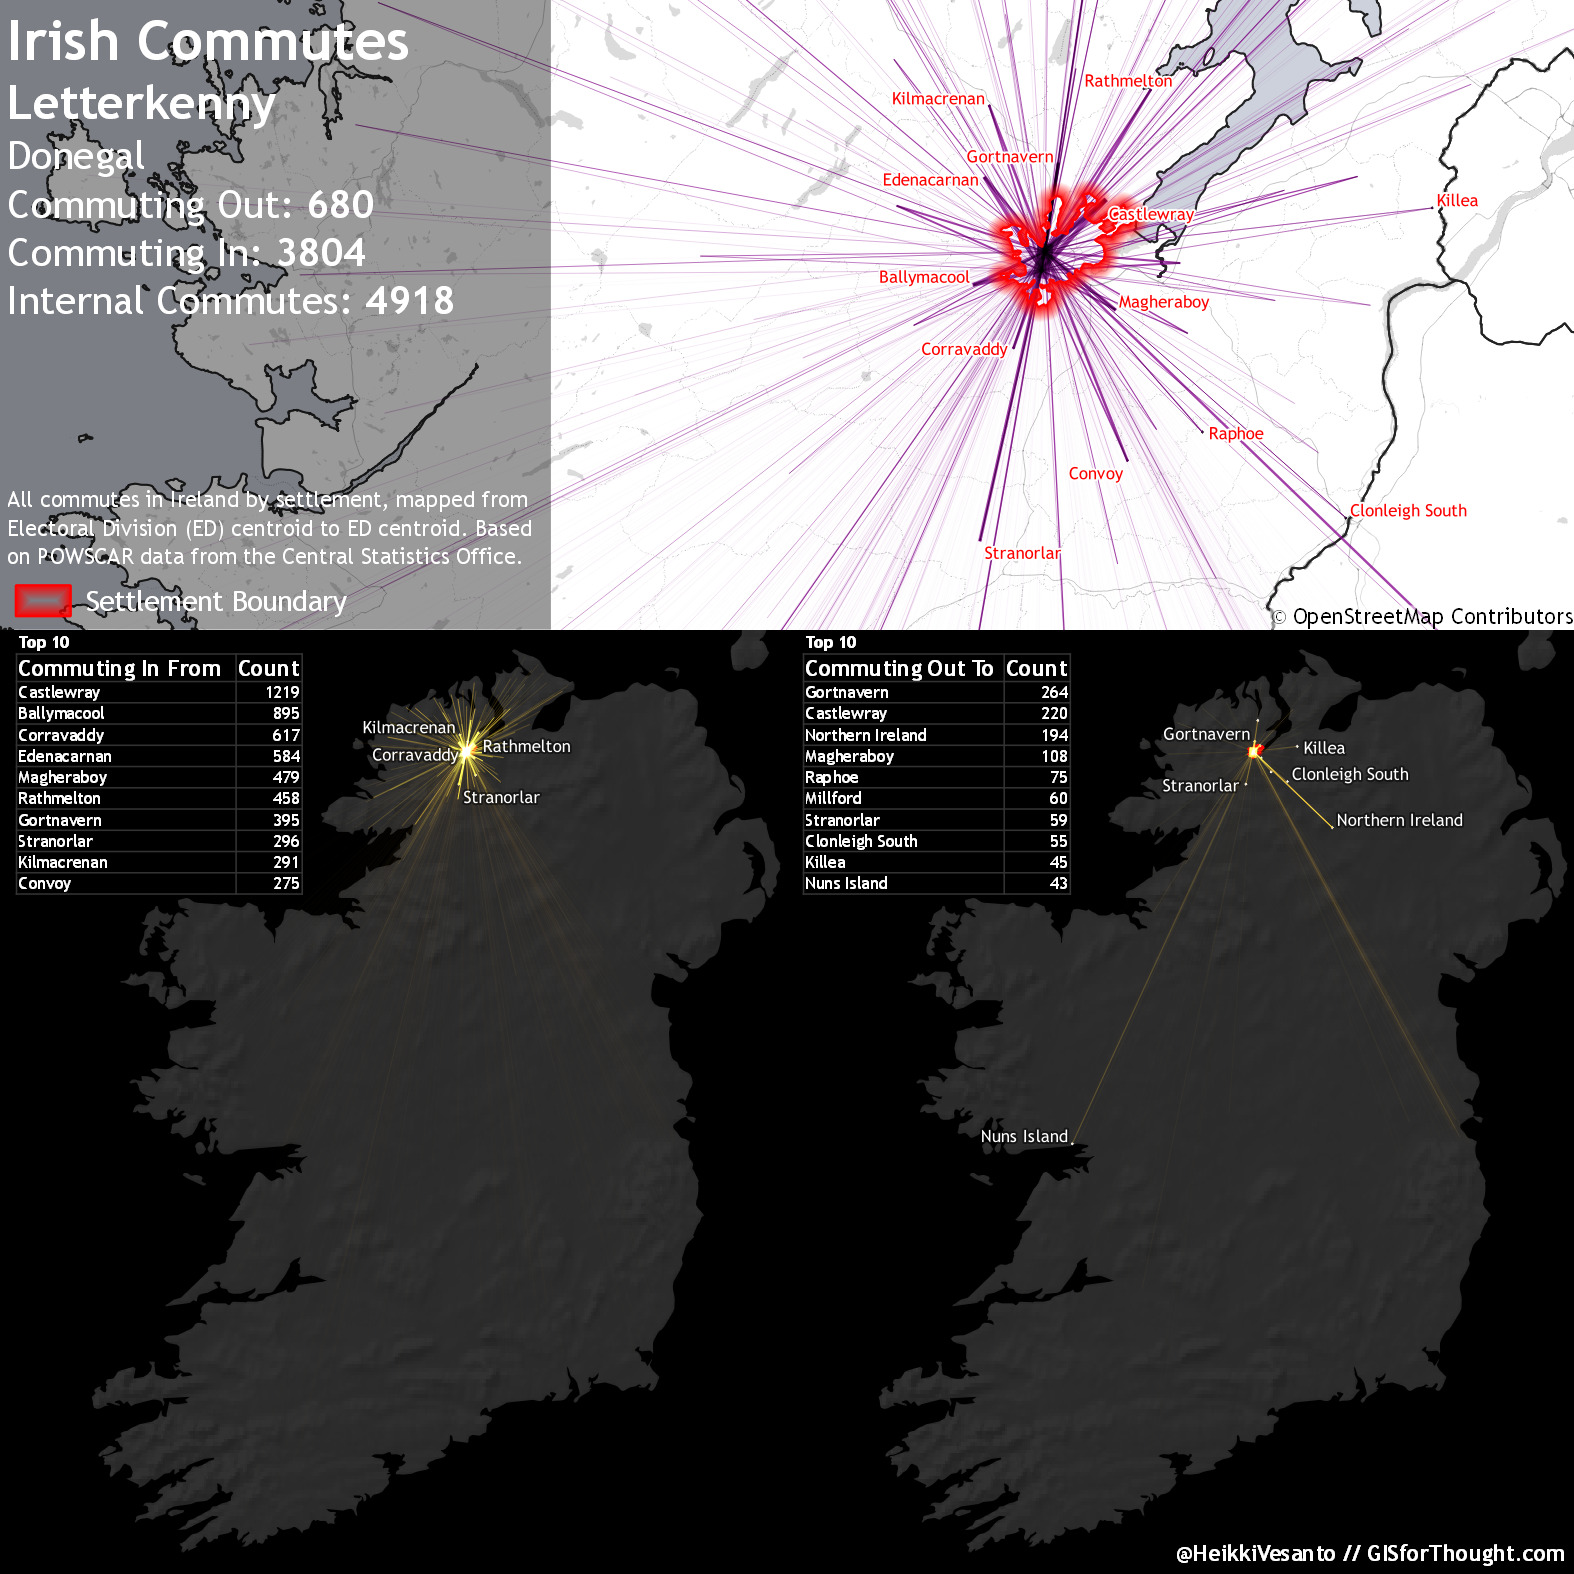
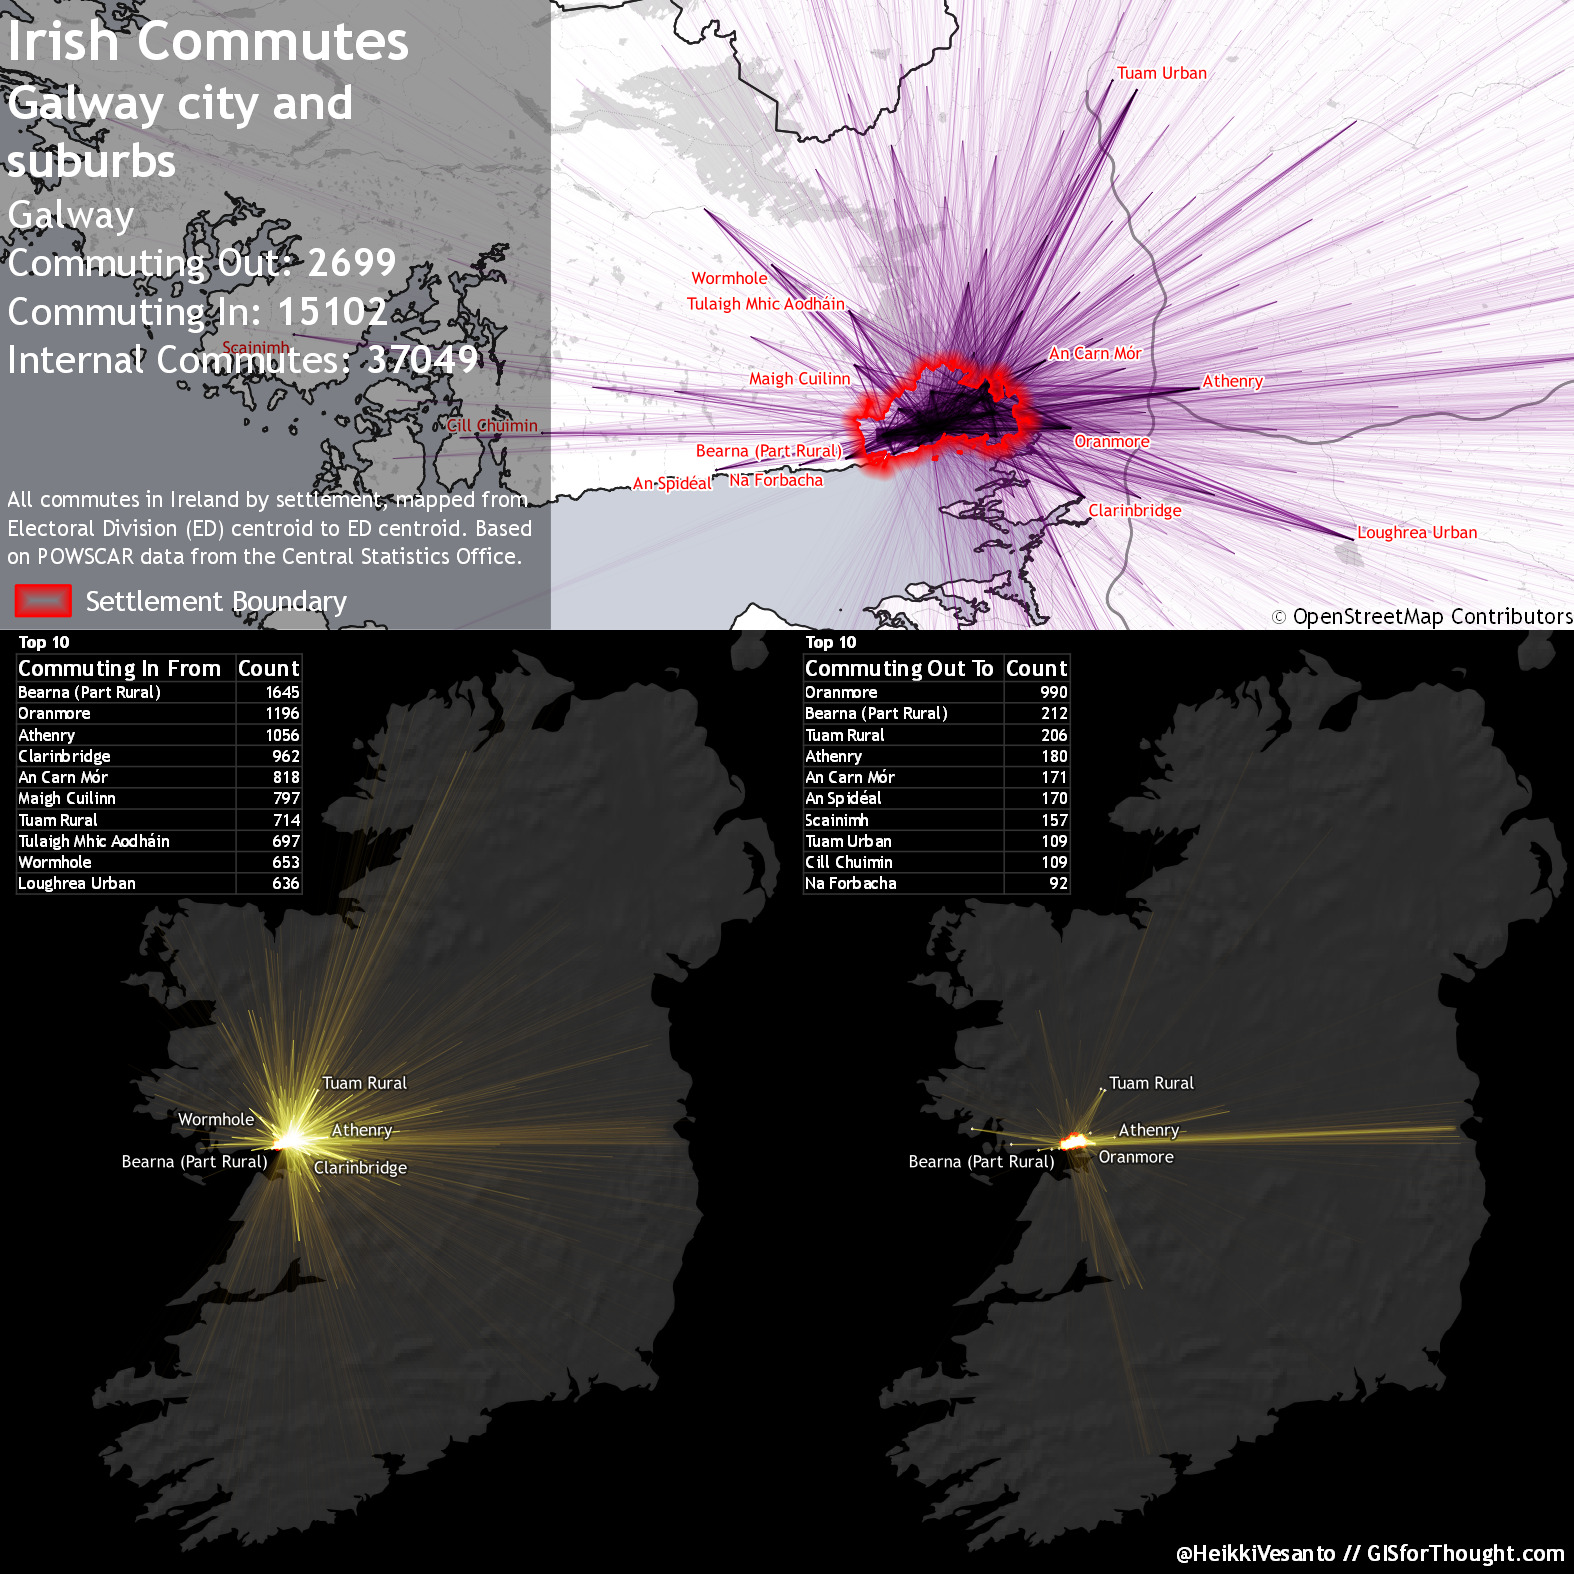
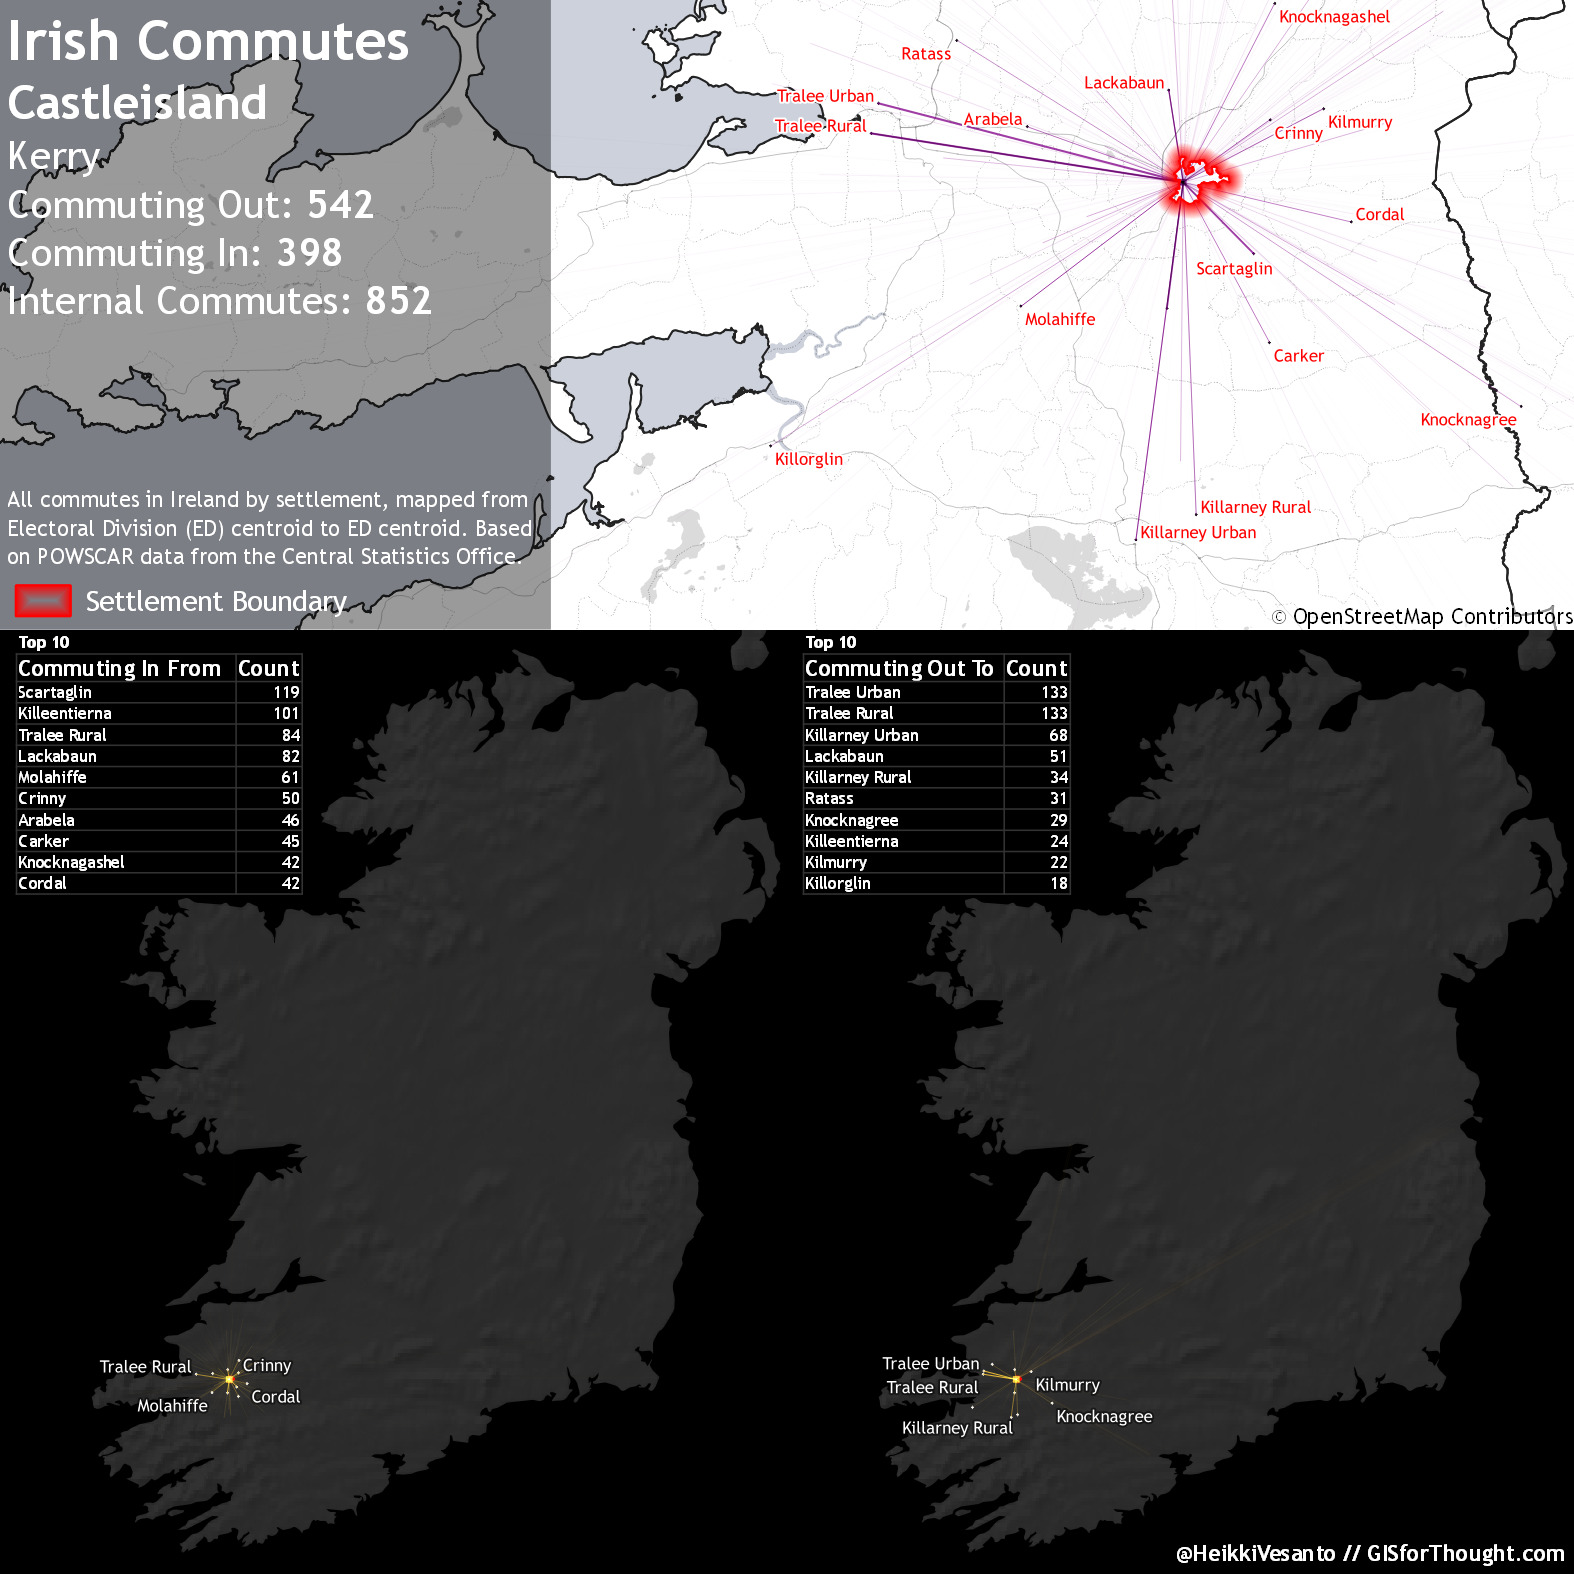
I have also created individual maps for all settlements in Ireland. This should give a better local picture of the commuter flows.
Settlements were linked to EDs based on a few characteristics:
- Settlement intersects ED AND either
- The original point on surface is within 100 meters of a settlement OR
- 75% of the settlement is in the ED OR
- 90% of the ED is in the settlement
Examples:
Letterkenny:
Galway:
Castleisland:
Tramore: