Scotland’s Cartographic Outline

This is a topic I have covered in the past as well: Scotland’s Changing Outline

But the 1654 Blaeu Atlas of Scotland was an influential cartographic masterpiece. The National Library of Scotland have covered it’s publication history very well: The history behind the publication of the Blaeu Atlas of Scotland.

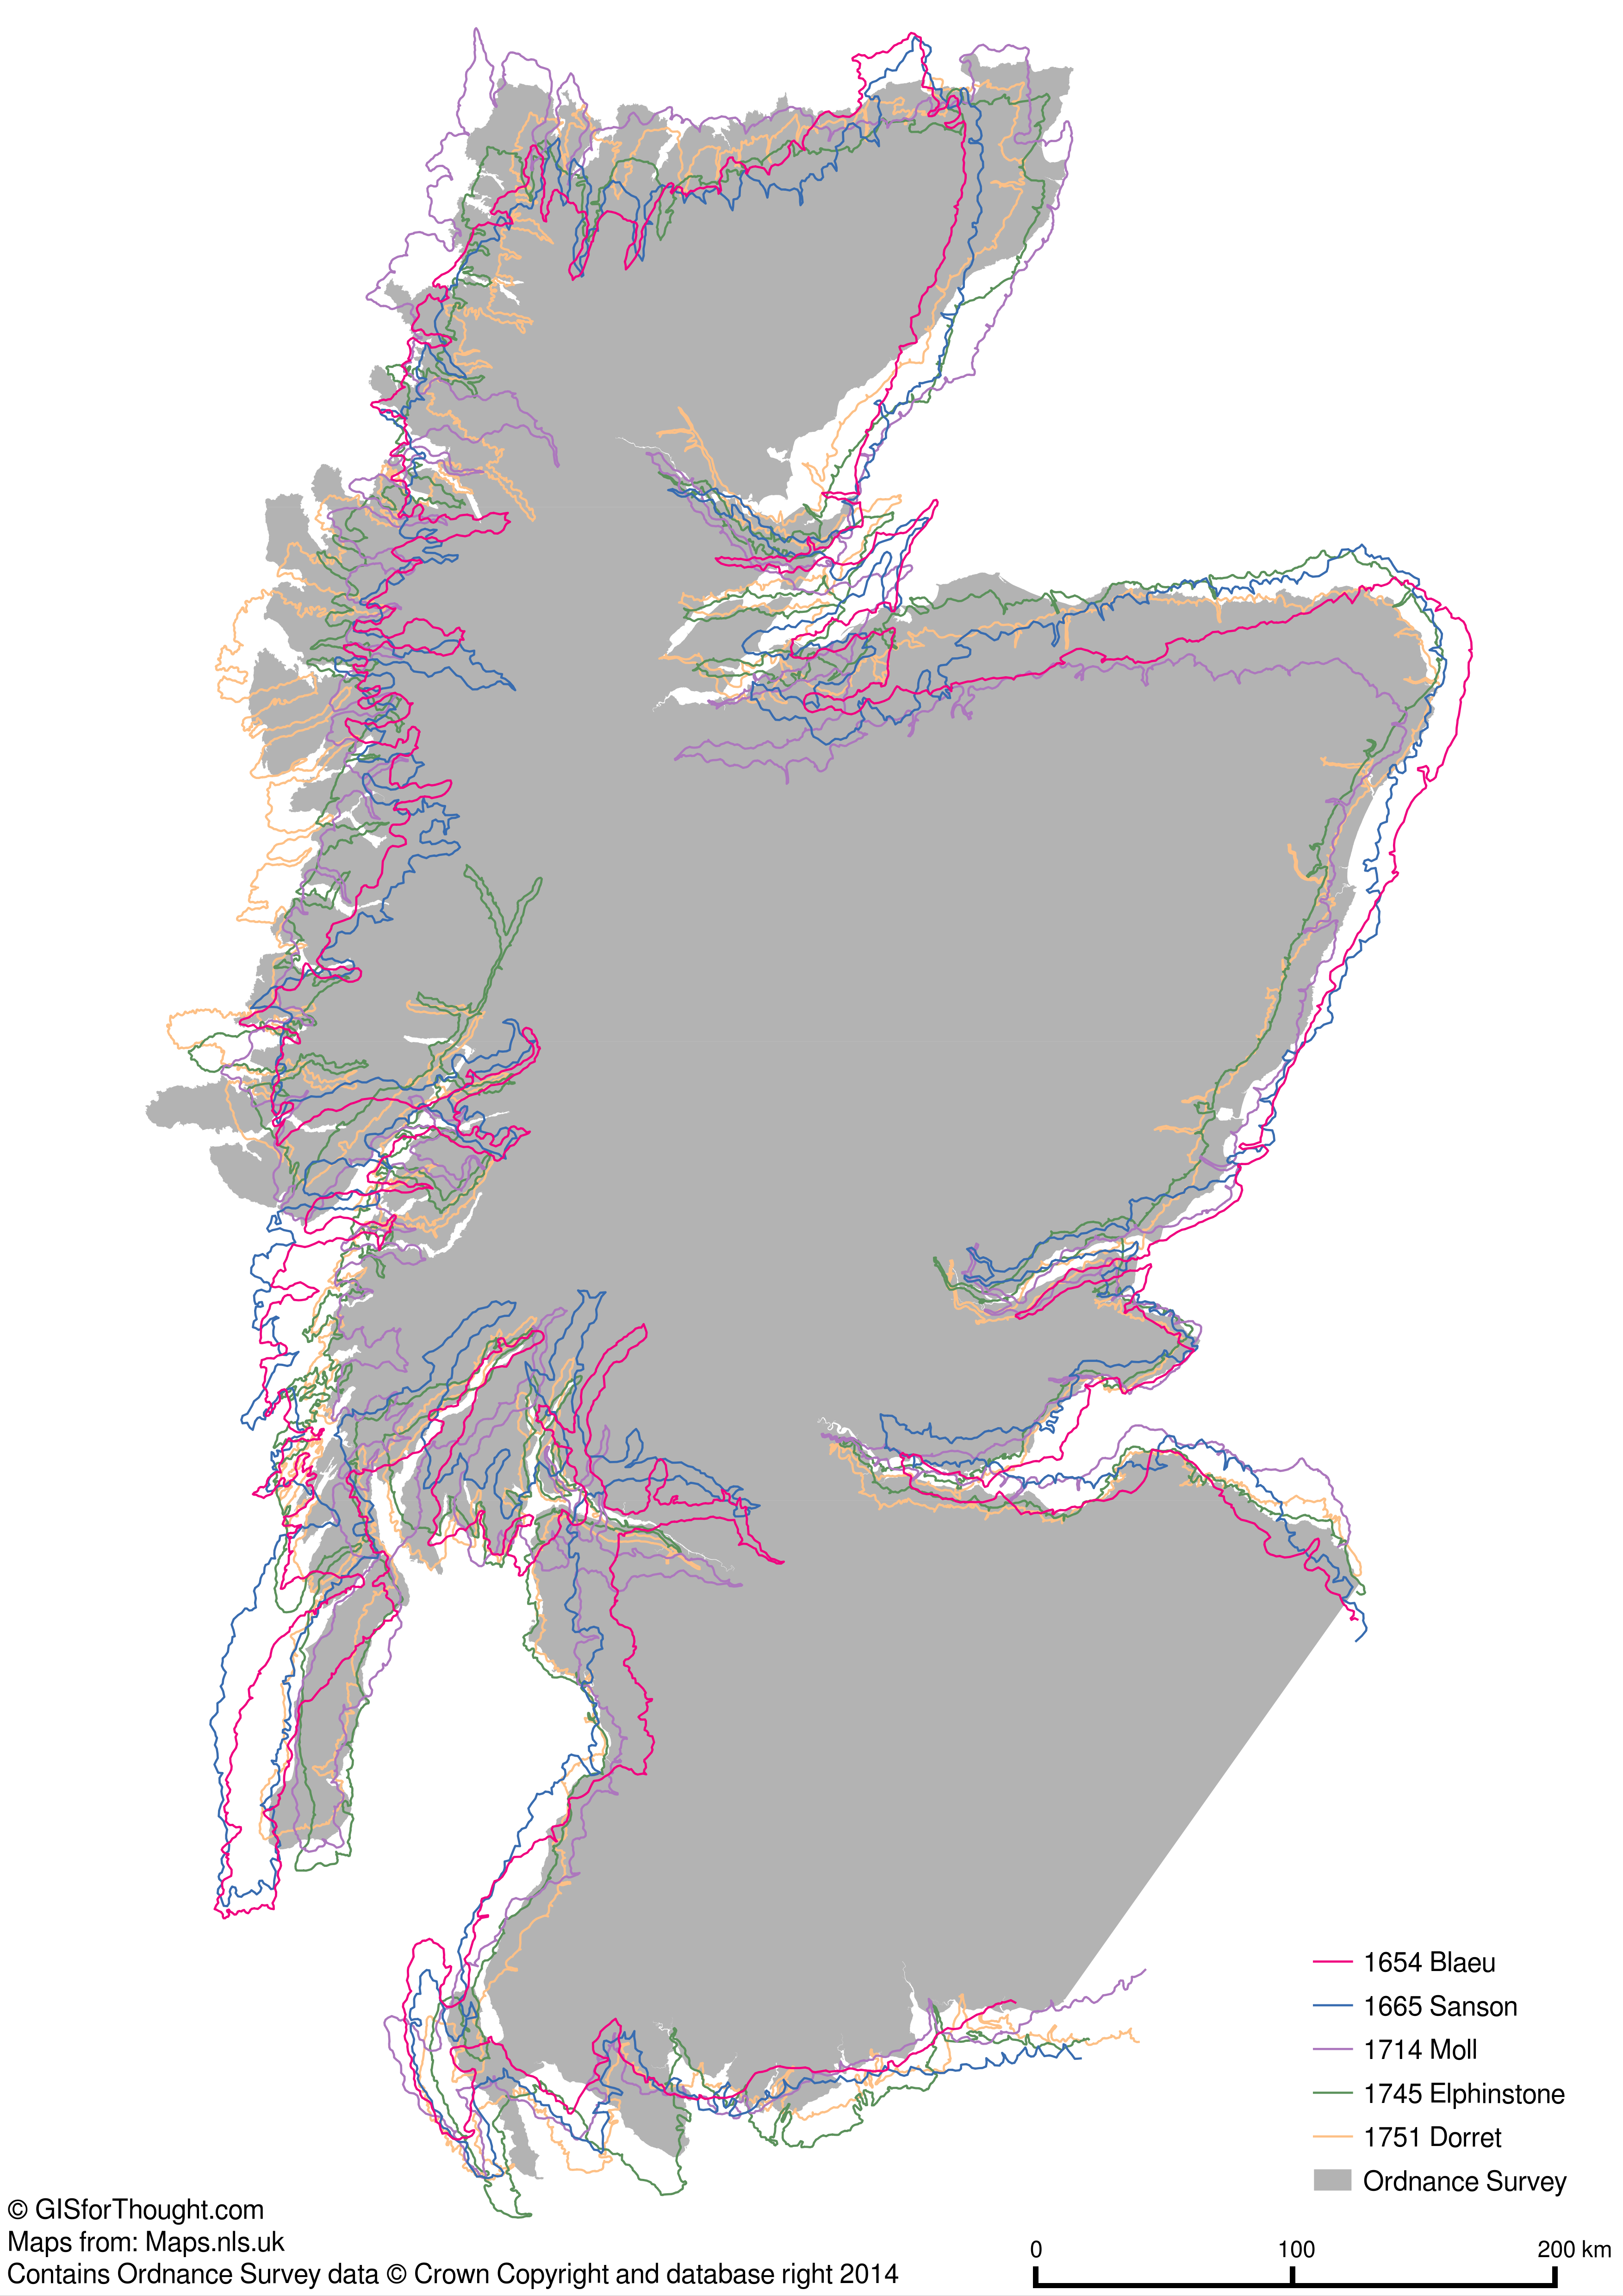
When the sixth volume of Joannis Blaeu’s Atlas Novus was released in 1655, the maps of Scotland formed one eighth of the total maps in his world atlas. Making Scotland one of the best mapped countries of the seventeenth-century world.

The animations include the following maps from the National Library of Scotland:

Blaeu Compared to Modern Day Outline from OpenStreetMap

Cycling Through the Maps by Publication Date

Blaeu – 1654
Sanson – 1665
Morden – 1687
Moll – 1714
Elphinstone – 1745
Dorret – 1751
Modern
Blaeu – 1654

Comparison to Modern Day In Between

Blaeu – 1654
Modern
Sanson – 1665
Modern
Morden – 1687
Modern
Moll – 1714
Modern
Elphinstone – 1745
Modern
Dorret – 1751
Modern
Blaeu – 1654

Comparison to Blaeu

Blaeu – 1654
Sanson – 1665
Blaeu – 1654
Morden – 1687
Blaeu – 1654
Moll – 1714
Blaeu – 1654
Elphinstone – 1745
Blaeu – 1654
Dorret – 1751
Blaeu – 1654

Overlaid

From: Scotland’s Changing Outline

Read about the maps here: Historic Maps of Scotland from Blaeu to Dorret (1600-1700)

Merch

There is also a t-shirt with all of the outlines overlaid, if you are a fan of Scottish cartographic history.

30 Day Map Challenge 2021

This November I once again took part in the 30 Day Map Challenge started by Topi Tjukanov.

Categories

I had done it the first year (30 Day Map Challenge 2019), and had made a few maps for 2020 as well.

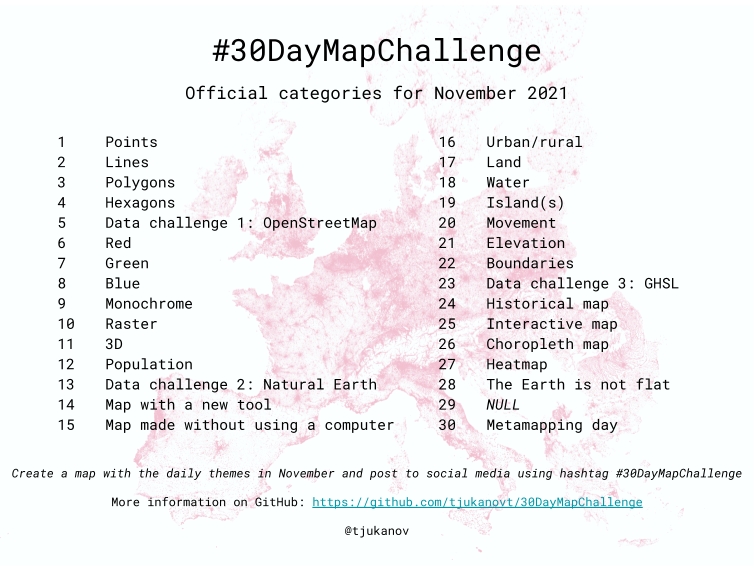
This year I wasn’t really sure I would take part, as I had no plans and nothing prepared. But it is a great challenge. It challenges your creativity, problem solving, and map making skills. It also sets a time limit so you don’t have to worry about being perfect. And making maps is good fun.

There were a few datasets that I had come across that I thought would be good subjects, and I got a lot of mileage out of them.

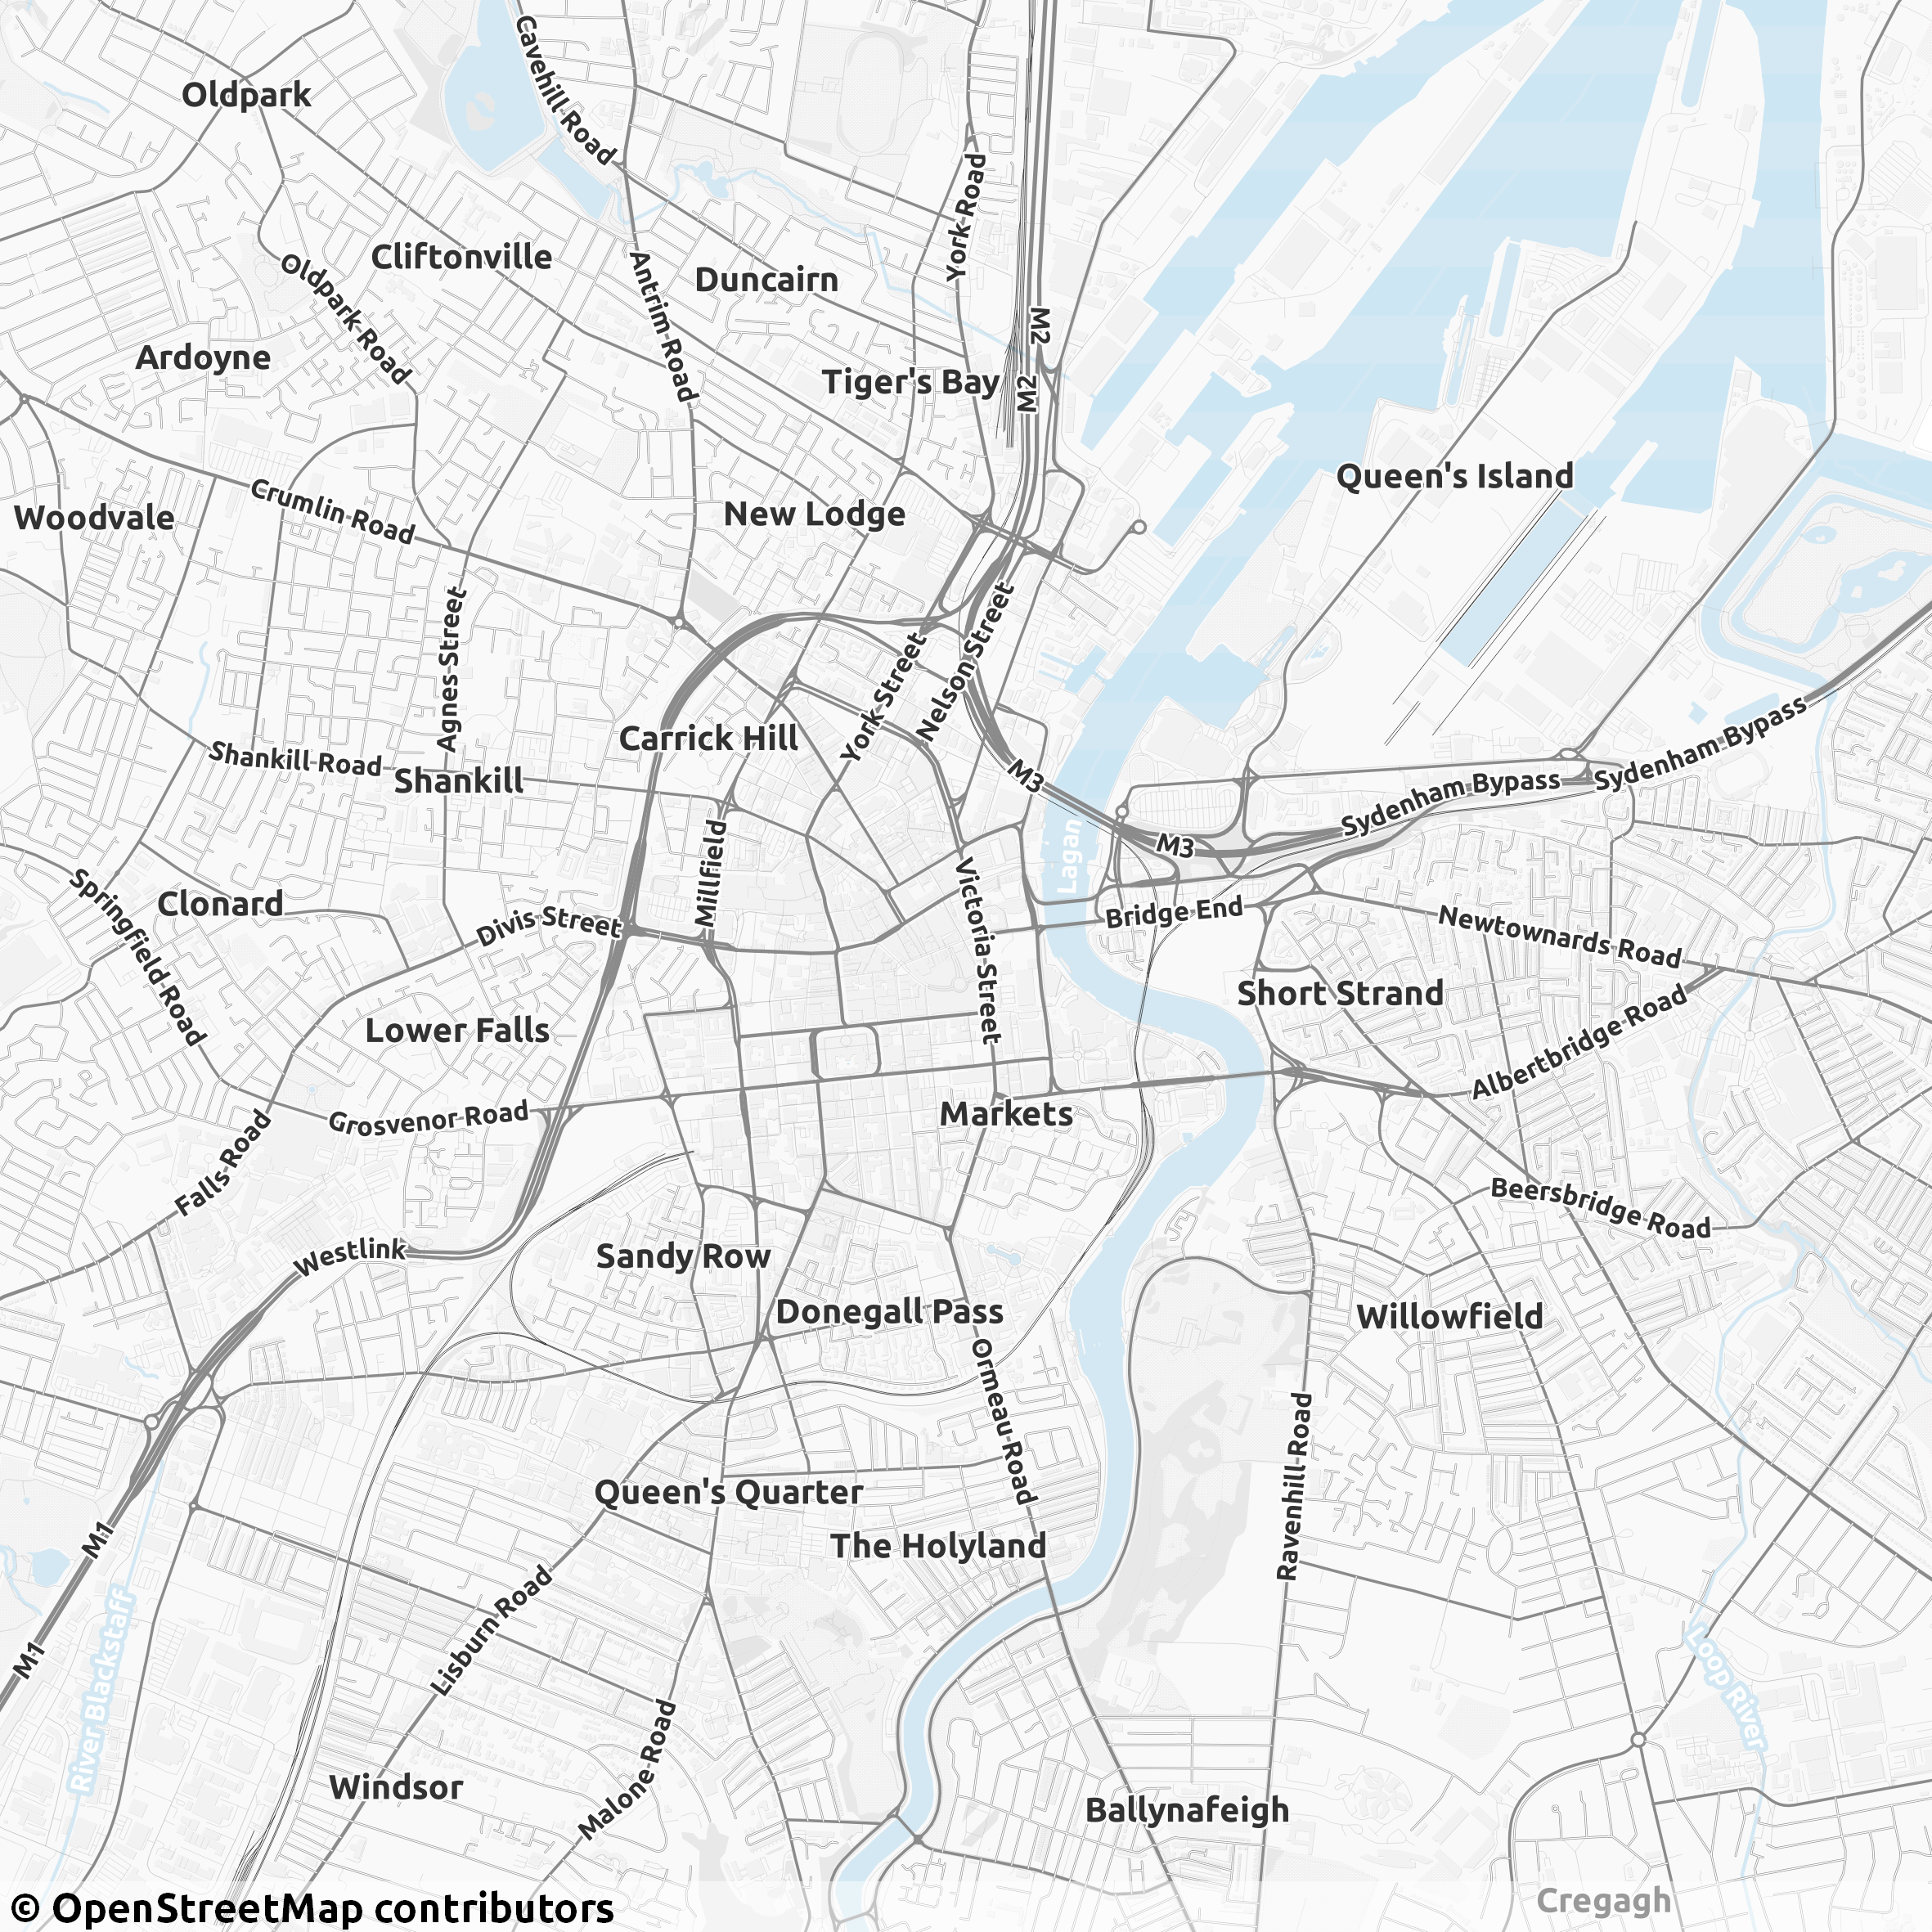
Dublin neighbourhoods

These included the Dublin Inquirer neighbourhood survey.

Will You Draw Your Dublin Neighbourhood for Us?

neighbourhoods.dublininquirer.com

I think this is a great initiative, and hopefully they get a real large set of responses. They are at over 2000 already so a great start.

I did something similar for Glasgow (here) but only got 367 responses in total. So the power of having a well read paper behind the initiative is great. They are also reaching out to areas that have not had many responses, which is really great work.

OpenStreetMap

I also wanted to do some maps around OpenStreetMap in Ireland. The community here has had a large push to map all of the buildings in Ireland, which has progressed well.

But it is very much a work in progress.

OSM Ireland Buildings poster from State Of The Map 2021

Selected Maps

Hexagons:

Hex

First of the Dublin boundaries series.

Final interactive version: Here

OpenStreetMap:

OpenStreetMap

For OSM day I wanted to try and make the data a bit easier to use for #QGIS novices.

I created styles that can be applied to the GEOFABRIK Shapefile extracts, from here.

The styles are available: https://github.com/HeikkiVesanto/QGIS_OSM_Styles

Red:

Red

Mac vs Mc.

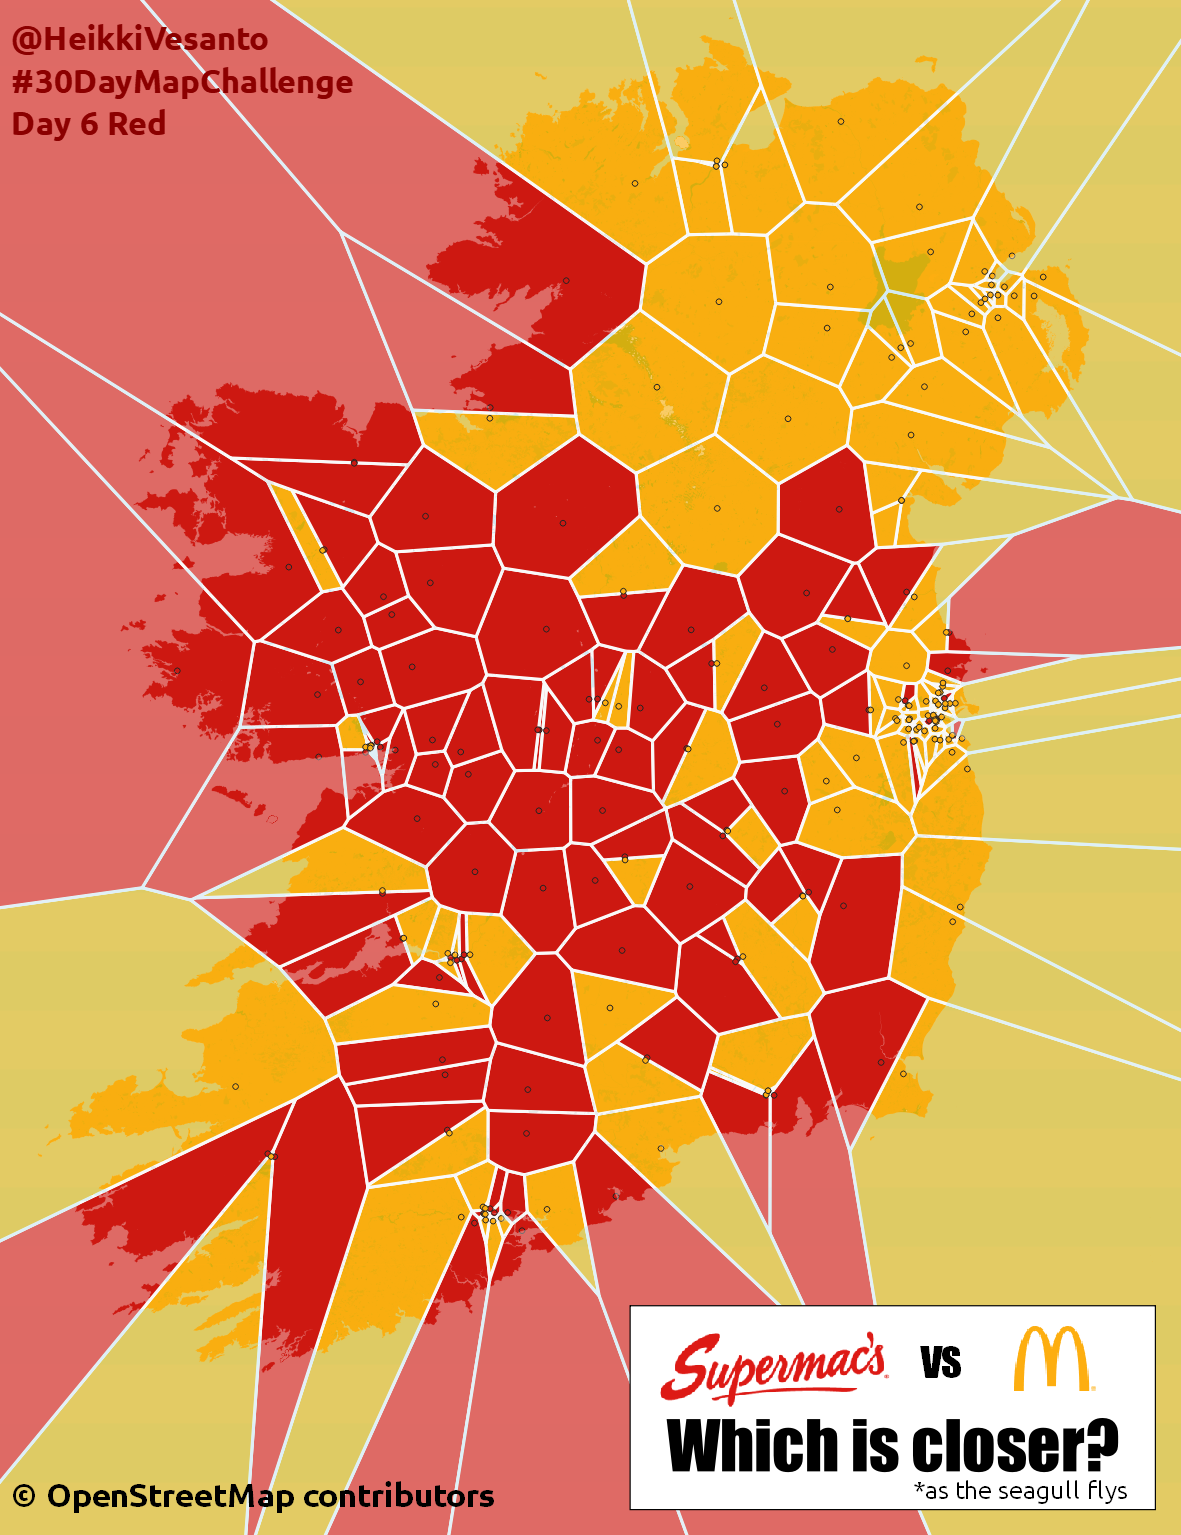
Supermac’s is an Irish fast food restaurant chain, who have had a few trademark disputes over the years with McDonald’s over the use of Mc and Mac in burger names.
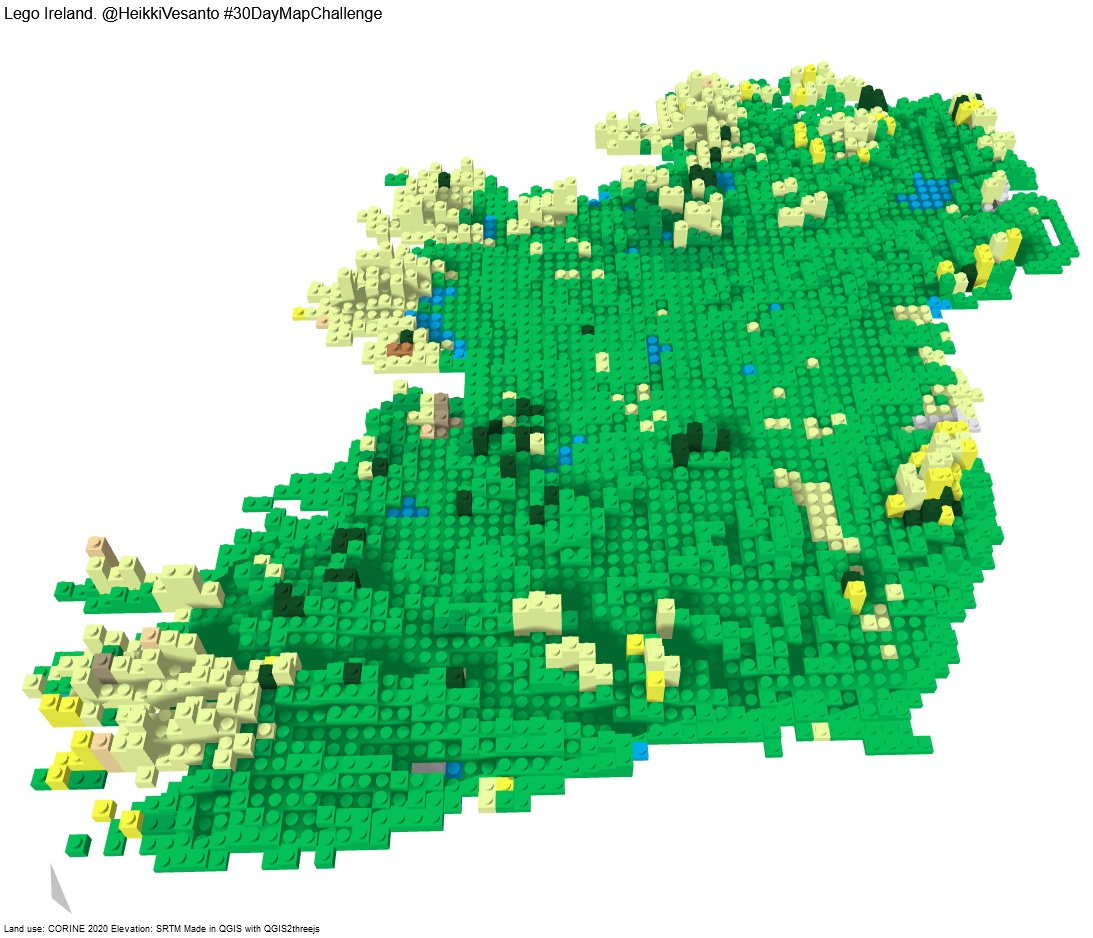
3D:

3D

This turned out a lot better than I expected.

Was pure QGIS. Create grid (5km x 5km), zonal statistics on CORINE (Majority) and DEM (Median). New field for height rounded up to the nearest 40:

to_int(ceil((“_h_median” / 40))) * 40

Set colors. Create centroids with same colors. These become the Lego nubs.

Rendered in QGIS2threejs plugin. The grid is extruded, with a height of height * 50. The centroids are cylinder rendered height * 50 + 30 * 50, so they come a bit higher, radius of 1800.

The “rayshader” export makes it look realistic.

Interactive: https://maps.gisforthought.com/LegoIreland/

Might be better to not use landuse, but elevation for the colours.
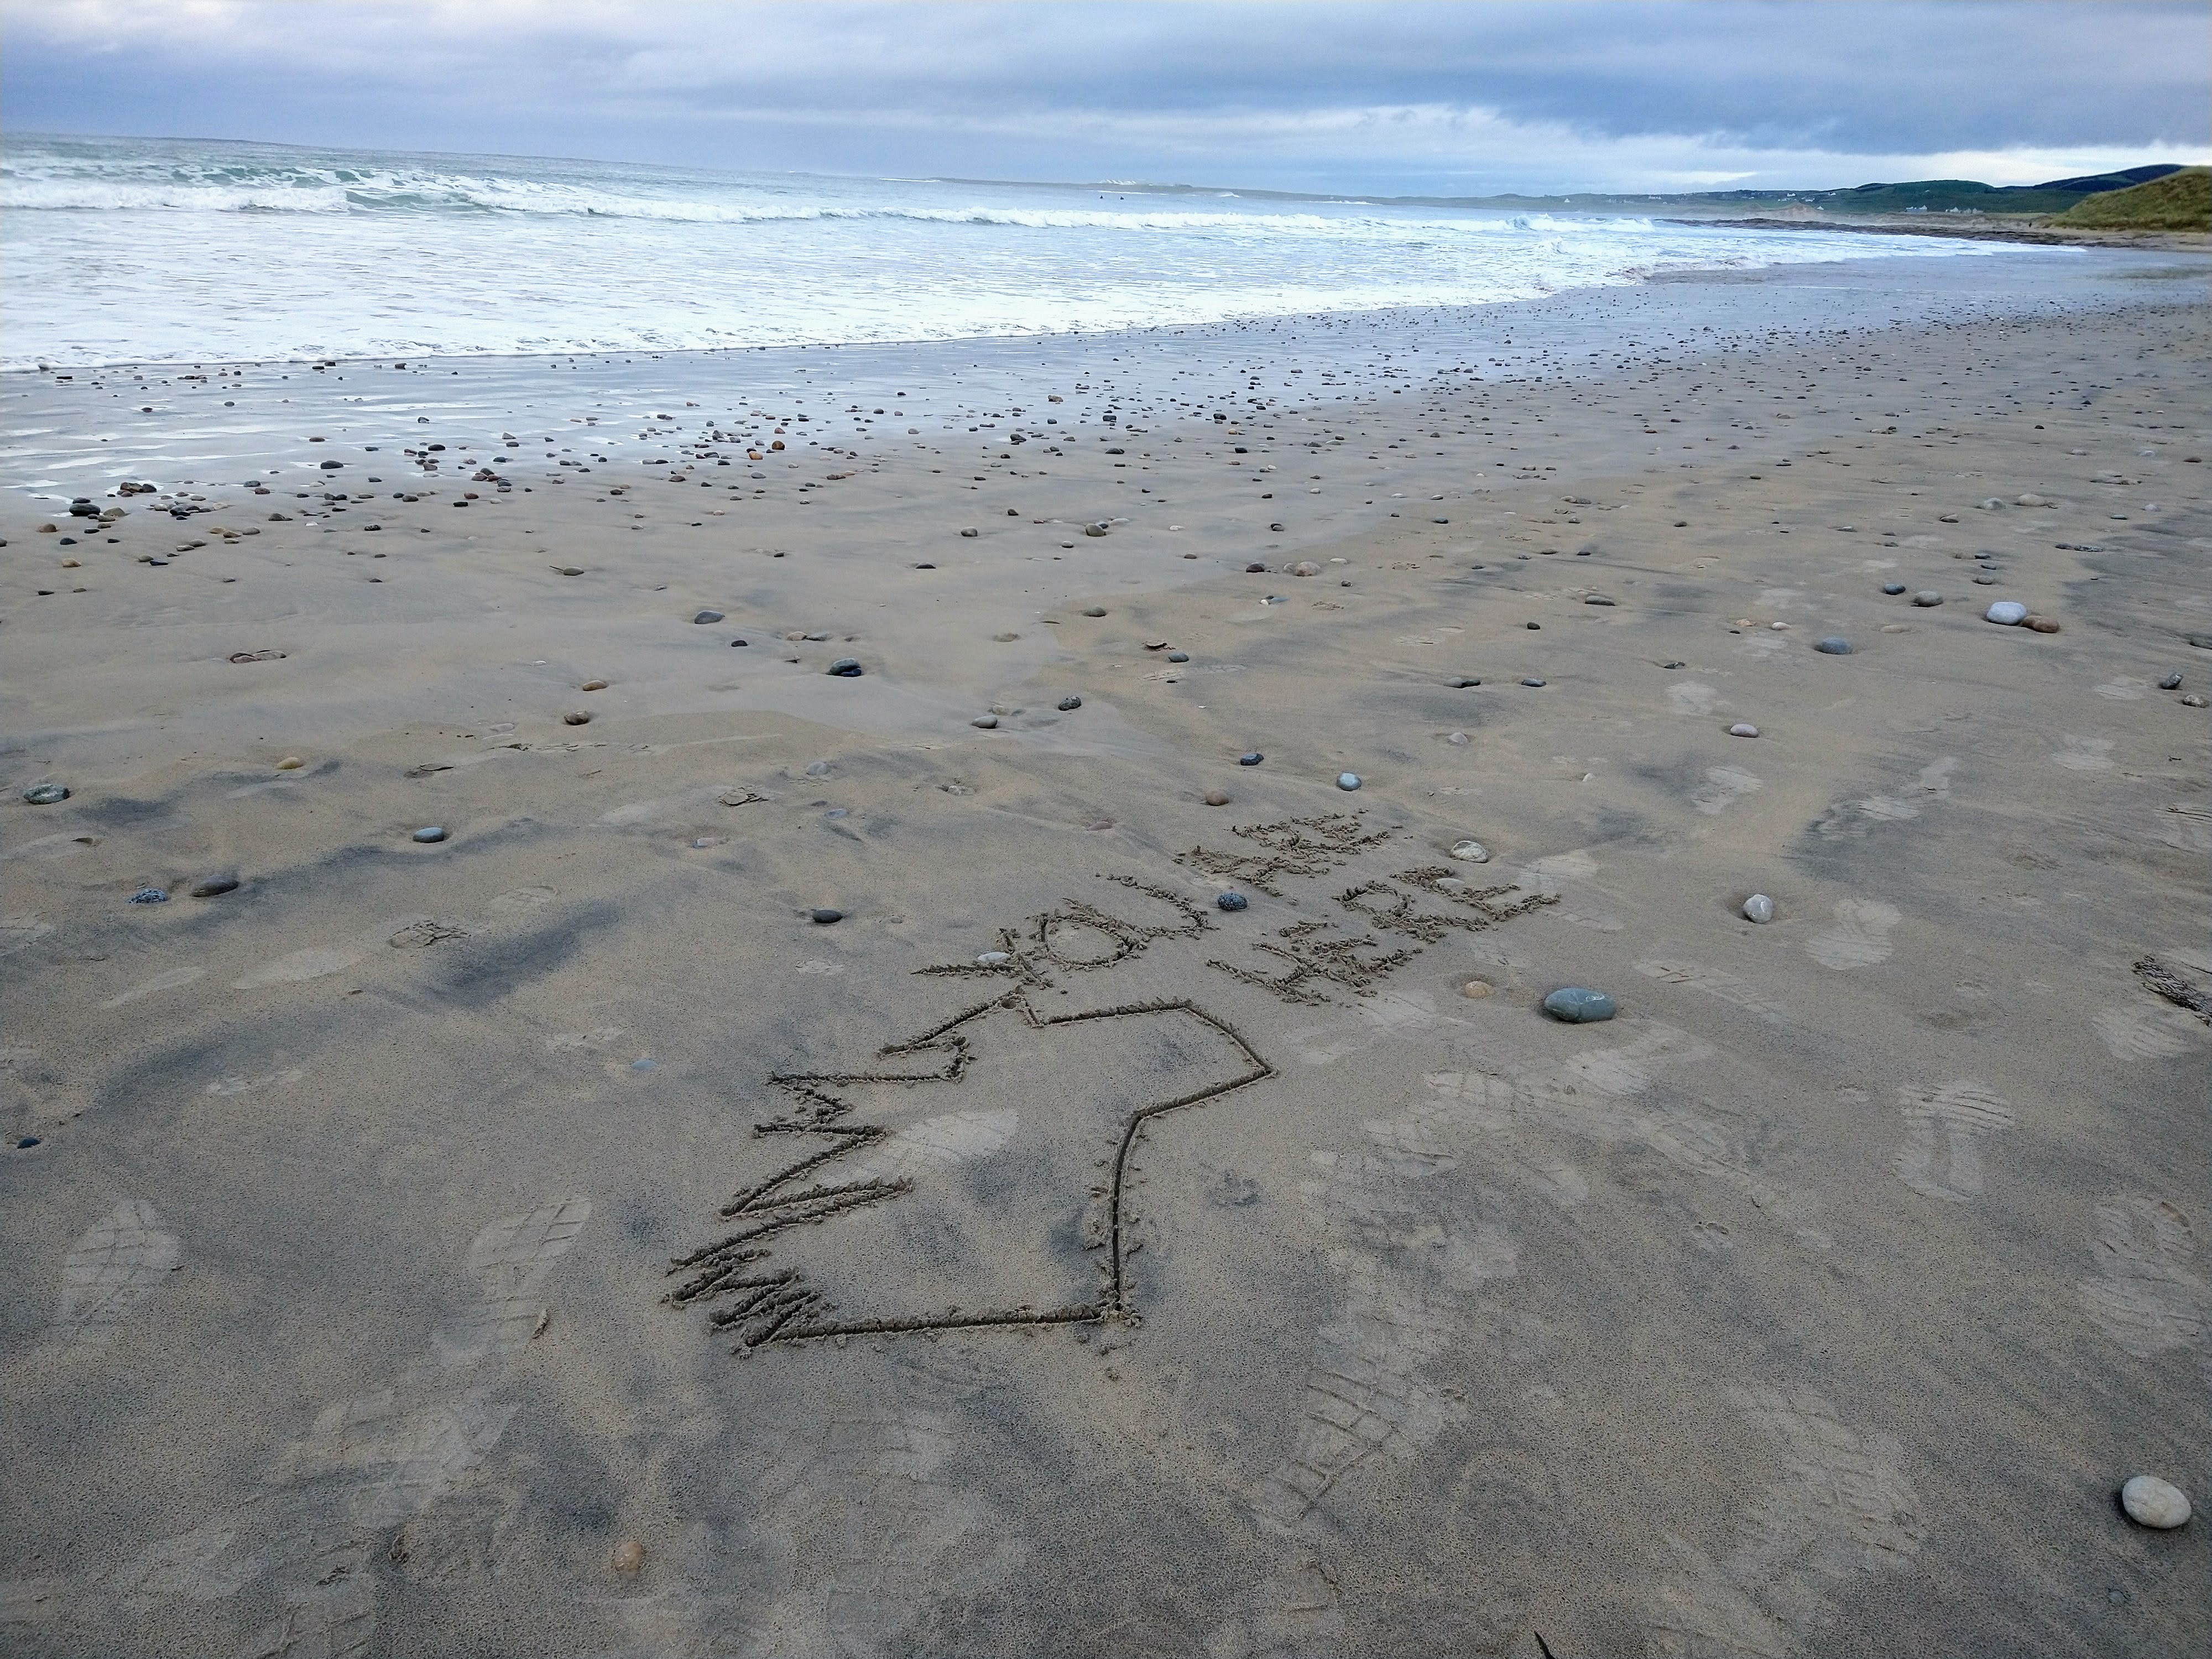
No Computer:

No Computer

Nice to get away from the computer. Definitely promotes some creativity. But I just took it as an opportunity to walk on the beach.
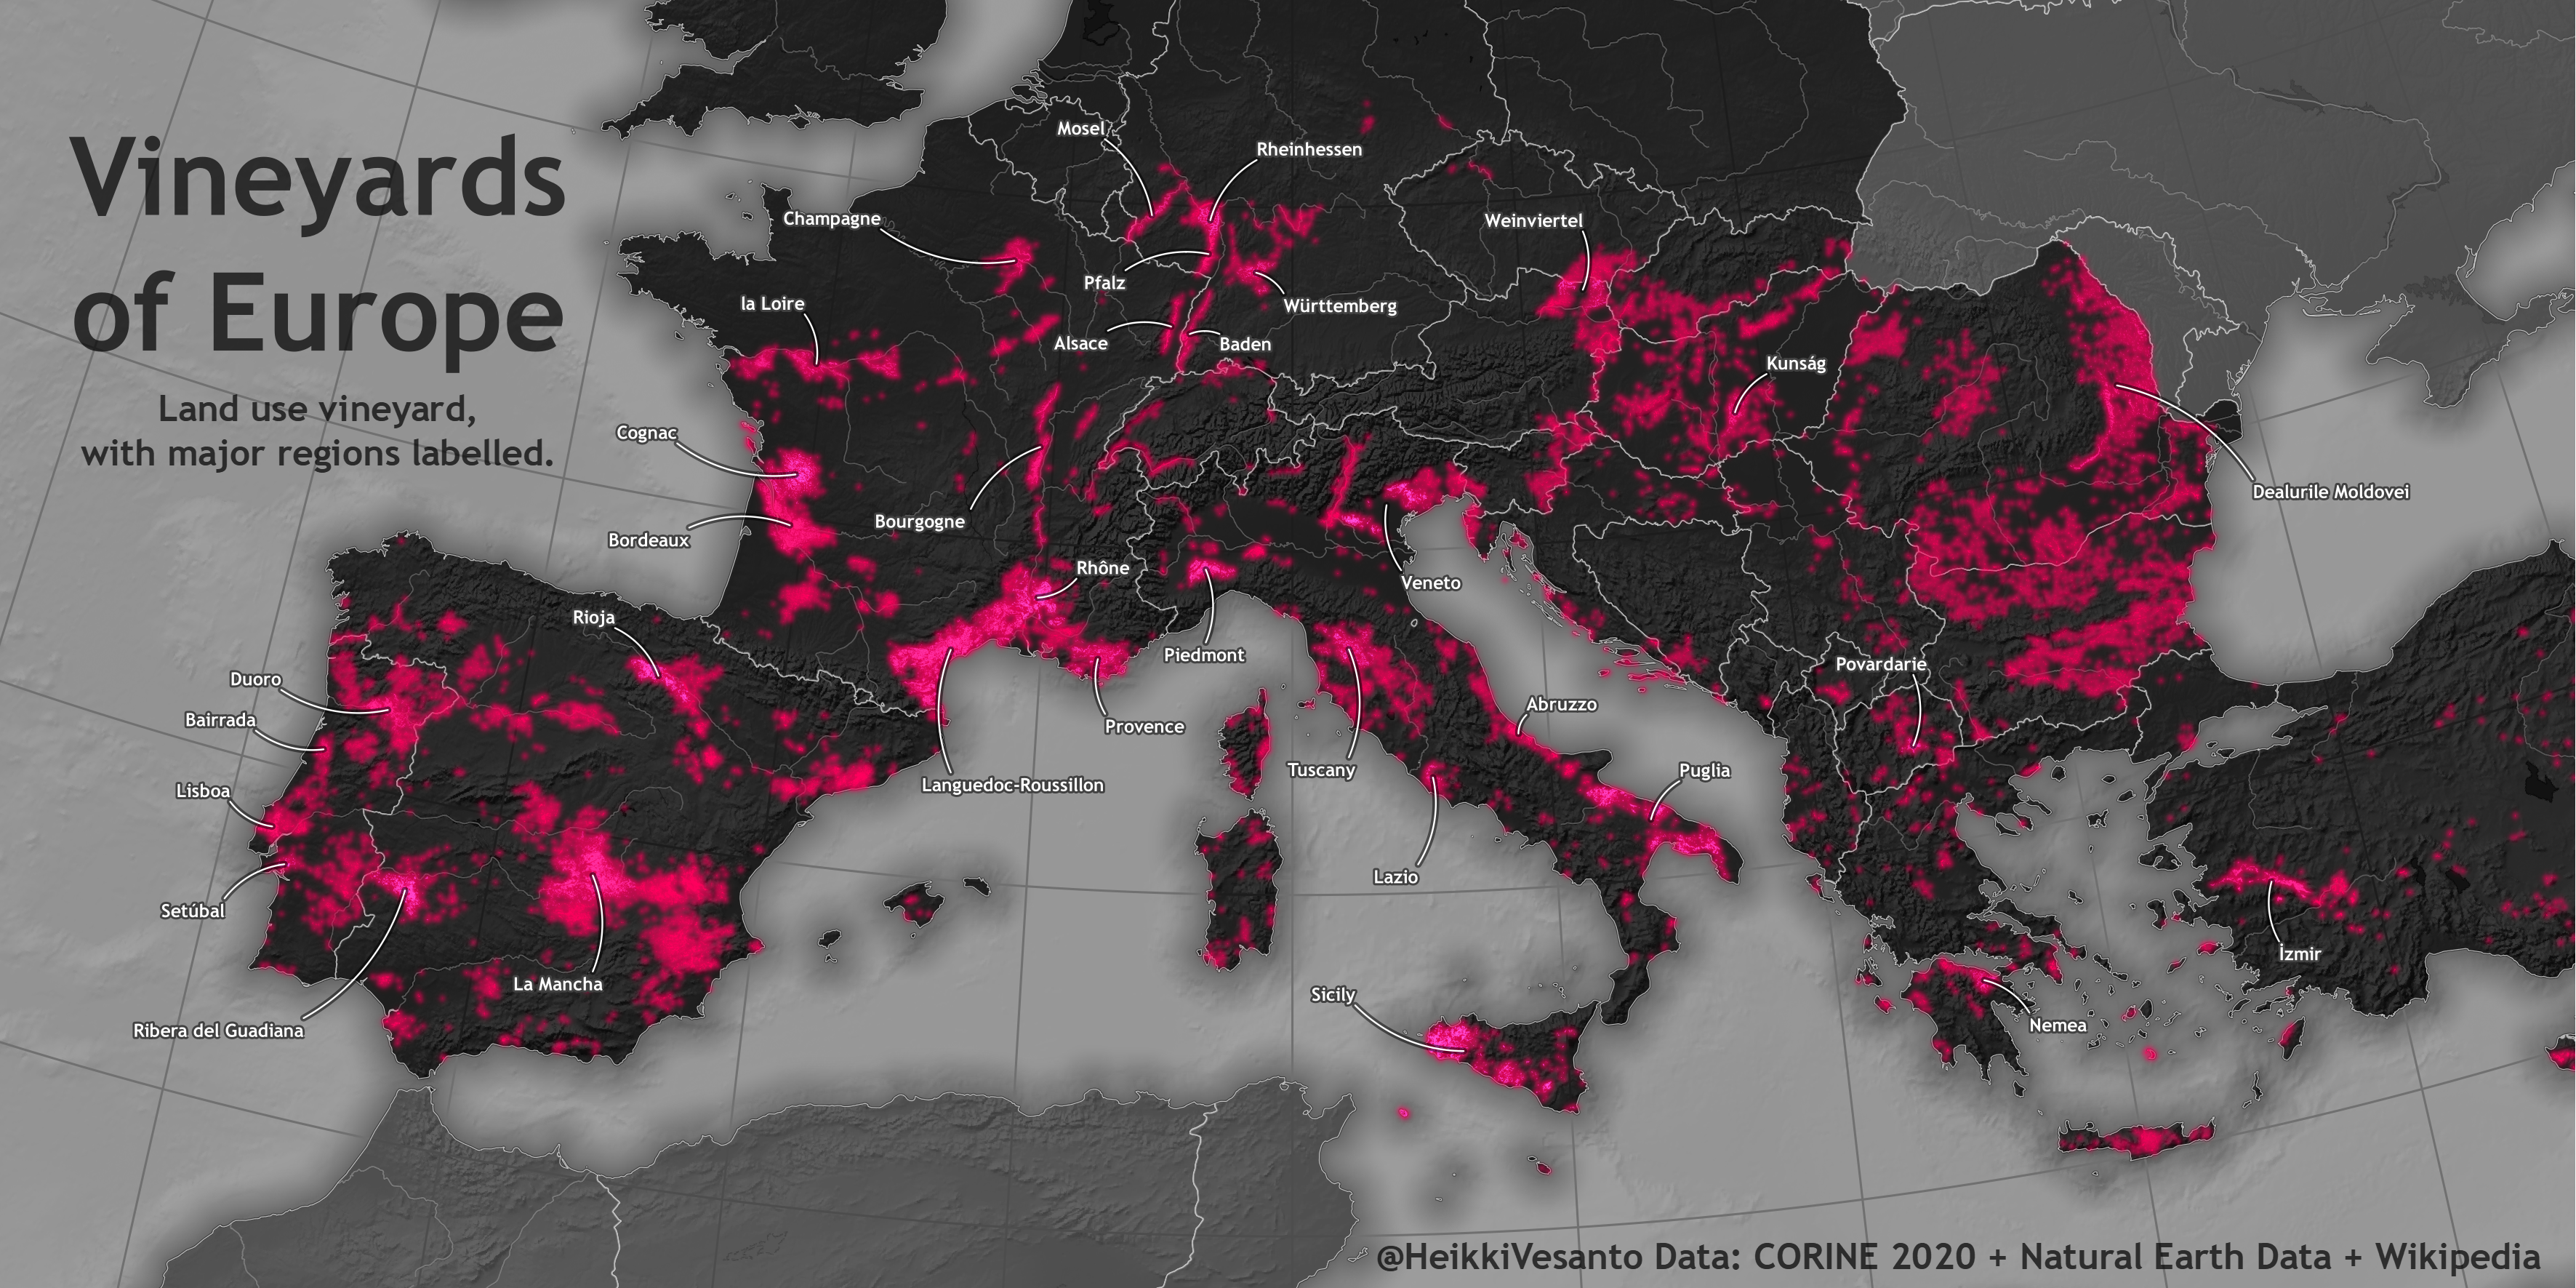
Land:

Land

My favourite of my maps.

Land use vineyard across Europe from CORINE 2020, with the major regions labelled.

GHSL:

GHSL

Seasonal population of the Balearic Islands.

Data clipping in QGIS/GDAL, rendered in Aerialod, with labels with GIMP afterwards.

This was my second favourite of my maps. I think the topic is interesting and the execution is pretty good. Was however quite manual and probably needed more exaggeration to see the differences.

Historical:

Historical

A time lapse of 1,831,044 buildings in Ireland being added to OpenStreetMap.

If you want to get involved see: OpenStreetMap Ireland Buildings

Globe:

Globe

Simple spinning globe in QGIS, but I was happy that I was able to automate the export: Gist

All maps:

See here

Every Person in Great Britain Mapped

A follow up to my previous post: Every Person in Scotland on the Map. Winner of the 2016 OS OpenData Award for Excellence in the use of OpenData from the British Cartographic Society.

Full size interactive map.

The mapping process is pretty straightforward, and not accurate. I don’t know where you live. But I can make an educated guess.

I simply amalgamate the two sets of census data from the NRS (National Records of Scotland) for Scotland (2011 census) and the ONS (Office of National Statistics) for England and Wales (2010 census).

Postcodes were then created based on the ONS Postcode Directory, filtering for postcodes that were live in 2011 (which is the latest census data). The postcode centroids were turned into polygons using voronoi polygons.

Then we simply select all of the buildings in a postcode from Ordnance SurveyOpen Map product, filtering out most schools and hospitals. Then we put a random point in a random building for each person in that postcode.

I would have loved to include Northern Ireland, but the Ordnance Survey of Northern Ireland do not have an equivalent open building outline dataset, like Open Map from the Ordnance Survey.

Rendered with: QGIS tile writer python script. Processing done 100% in PostGIS.

Crowdsourced City Extents

Following up from my Glasgow Regions Mapped Update.

Alasdair Rae recently started a crowdsourcing project for four cities in the UK: London, Birmingham, Manchester, and Glasgow. Write up of the results. The post was however very popular and resulted in responses from around the world.

Since the project was created with the excellent code from Nick Martinelli, the data can be downloaded by anyone.

So I created a breakdown of the number of responses in 1 km grids for each city that received at least 5 responses.

The full album, ordered by country name and then city name can be found:

Here.

Highlights

Glasgow

The west end is the true Glasgow.
UnitedKingdom_Glasgow_extents46

Edinburgh

Very inclusive.
UnitedKingdom_Edinburgh_extents33

Liverpool

Much larger and inclusive than Manchester.
UnitedKingdom_Liverpool_extents20

London

The M25 provides a very handy limiting barrier.
UnitedKingdom_London_extents29

LA

Far reaching urban sprawl.
UnitedStatesofAmerica_LosAngeles_extents10

New York

Probably some selection bias, with crowd sourcing more popular in Brooklyn.
UnitedStatesofAmerica_NewYork_extents32

Washington

DC.
UnitedStatesofAmerica_Washington_extents21

All cities.

Glasgow Regions Mapped – Progress Update 1

You can read the initial post at: Mapping Glasgow Districts

We have had some great progress on the mapping so far. There have been 367 regions mapped to date. However, as mentioned in the original post, there are a huge number of regions in Glasgow so even with over 300 responses many regions have only one response and others are still unmapped. But in the hopes of encouraging some more responses I felt it would be nice to show what progress has been made to date.

Statistics so far:
Unique region names so far: 241

Most mapped regions:
City Centre – 10
Finnieston – 9
Merchant City – 9
Dennistoun – 8
Partick – 7
West End – 7
Garnethill – 6
Hyndland – 6
Woodlands – 5
Hillhead – 5
Mount Florida – 5

Regions so far. Click for PDF version.
map_so_far

We can see that there are still quite a few regions that have had the same number of responses with multiple region names.

We can look at what these responses have been, in an interactive map:


Full Screen.

We can see that the West End in general has been the target of a large number of responses, so we can drill in a little further:

west_end1

Extent of the west end:

West End

Individual regions:

Anderston

Anniesland

Blairdardie

Broomhill

Charing Cross

Dowanhill

Drumchapel

Finnieston

Firhill

Garrioch

Hillhead

Hyndland

Jordanhill

Kelvingrove Park

Knightswood

Maryhill

Not Partick

Park Circus

Partick

Partickhill

Scotstoun

Thornwood

West Maryhill

Whiteinch

Woodlands

Yoker

Yorkhill

A final note, there have been some creative responses as well, as expected. But the flagging system on the mapping page has worked incredibly well.

A huge thanks if you have responded.