Following up from my Glasgow Regions Mapped Update.
Alasdair Rae recently started a crowdsourcing project for four cities in the UK: London, Birmingham, Manchester, and Glasgow. Write up of the results. The post was however very popular and resulted in responses from around the world.
Since the project was created with the excellent code from Nick Martinelli, the data can be downloaded by anyone.
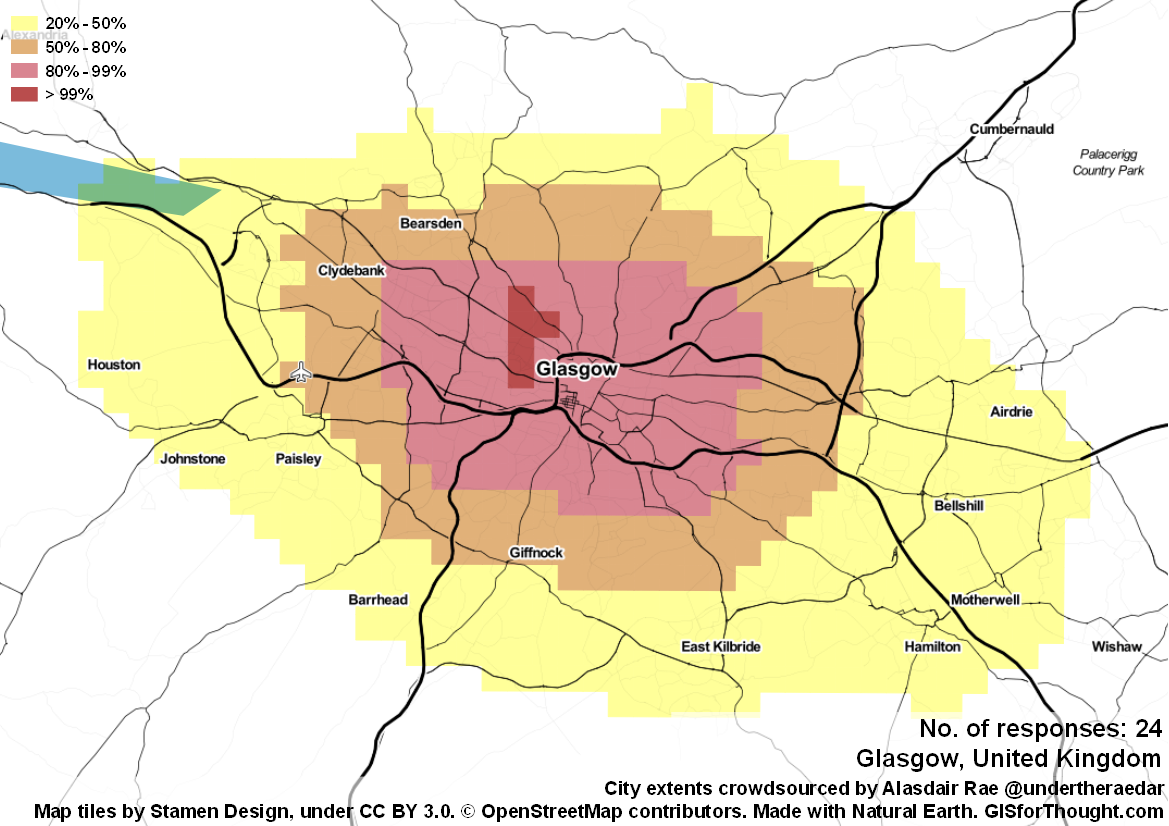
So I created a breakdown of the number of responses in 1 km grids for each city that received at least 5 responses.
The full album, ordered by country name and then city name can be found:
Highlights
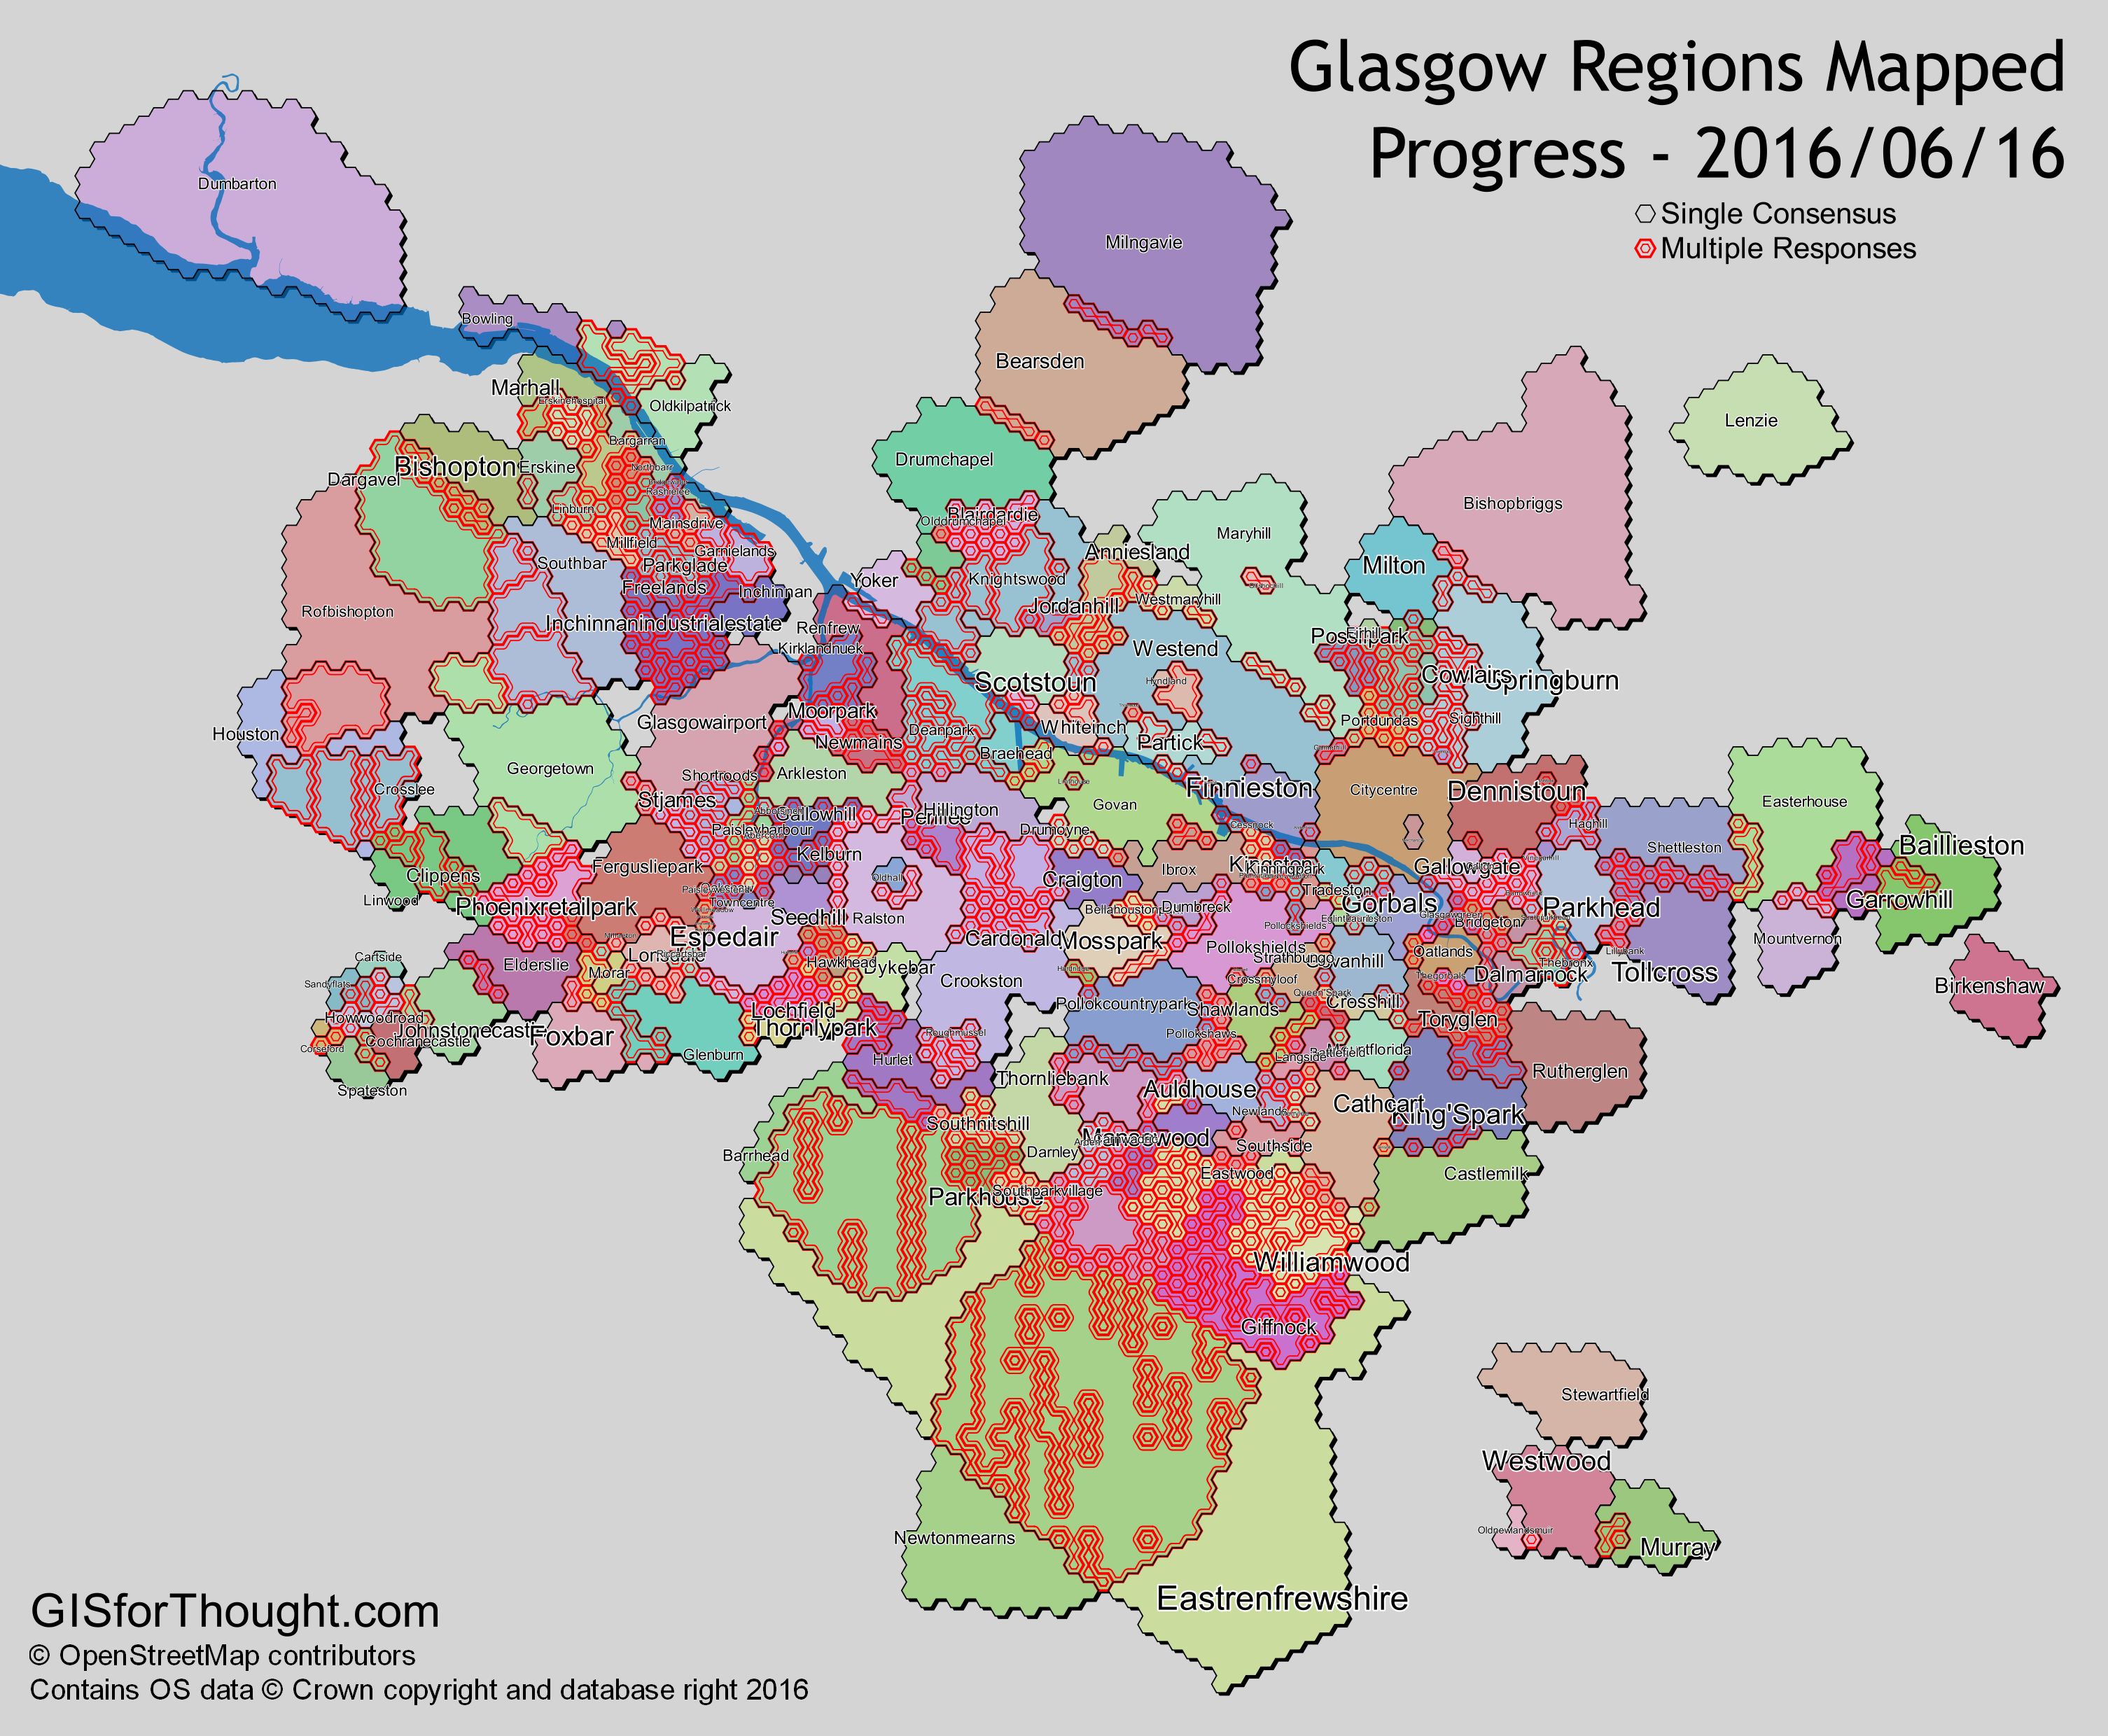
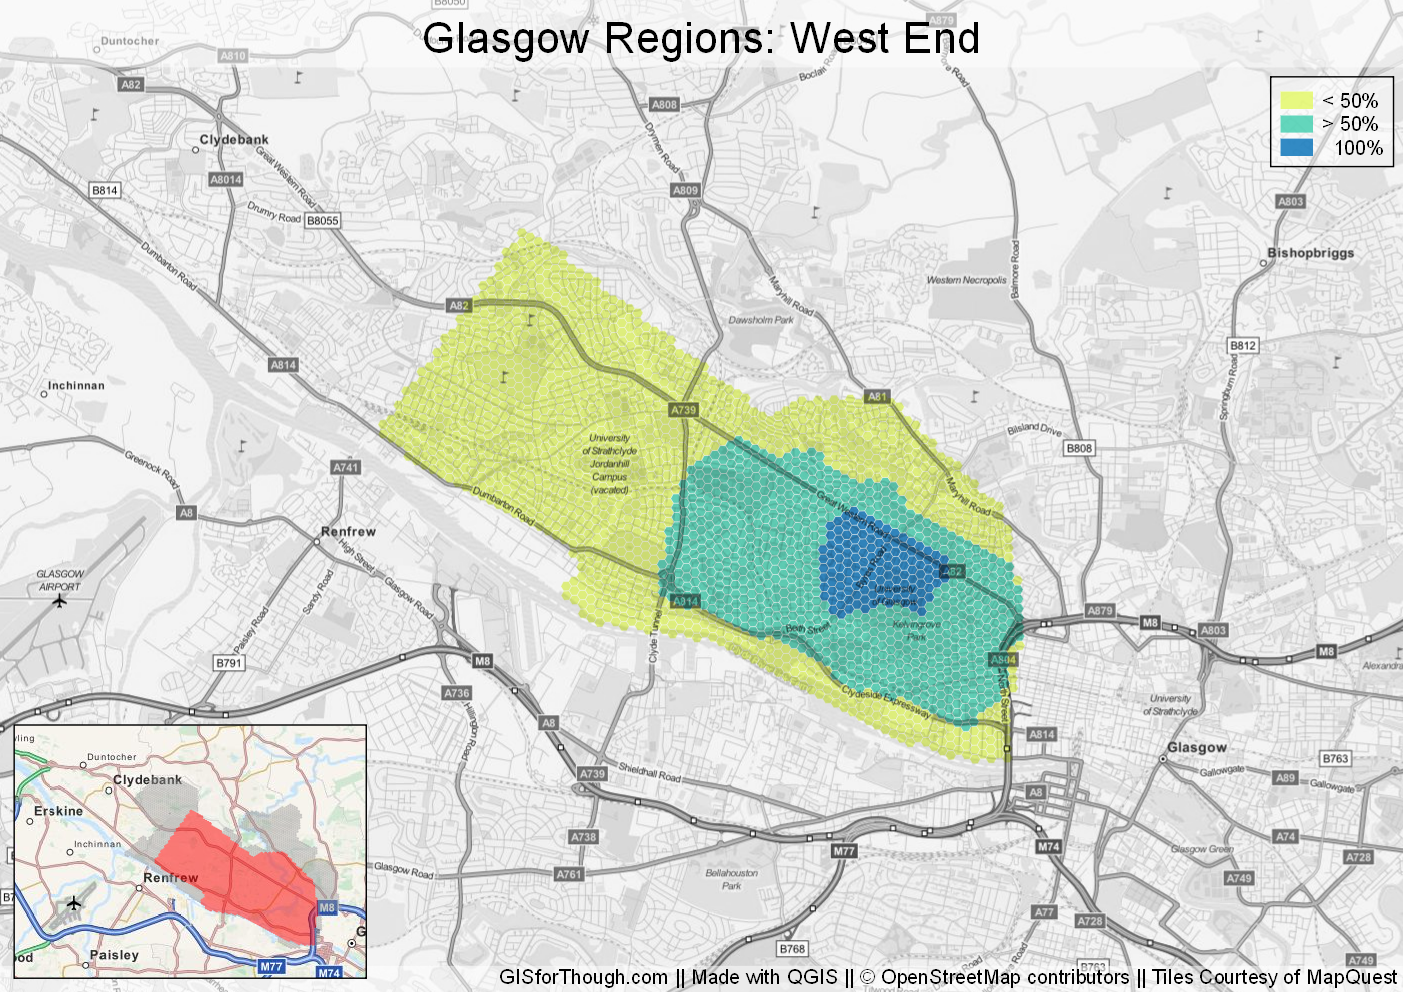
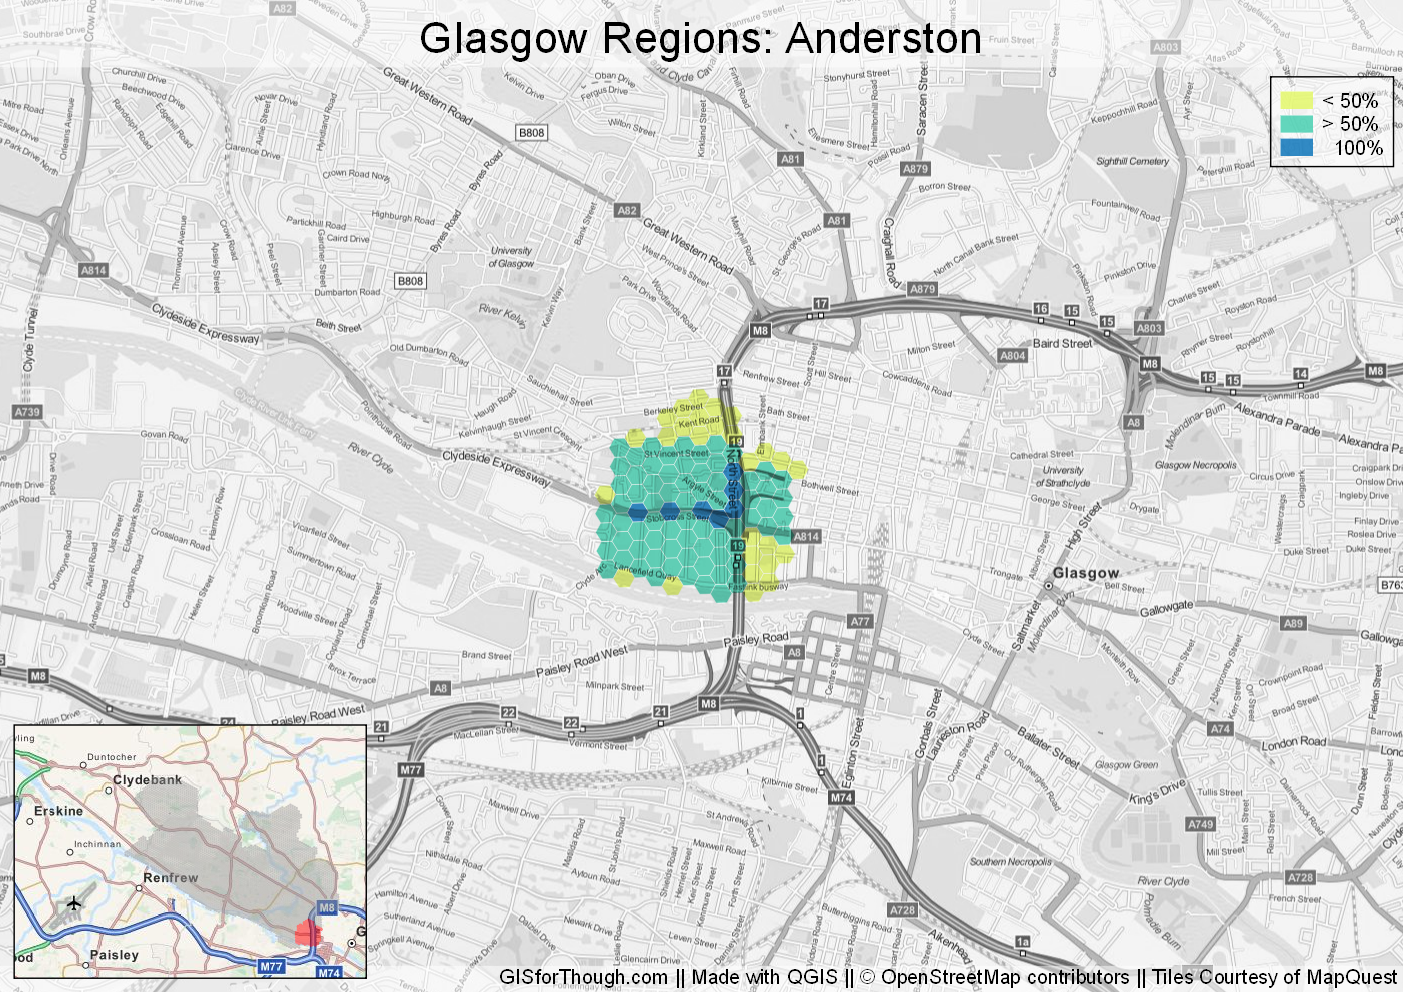
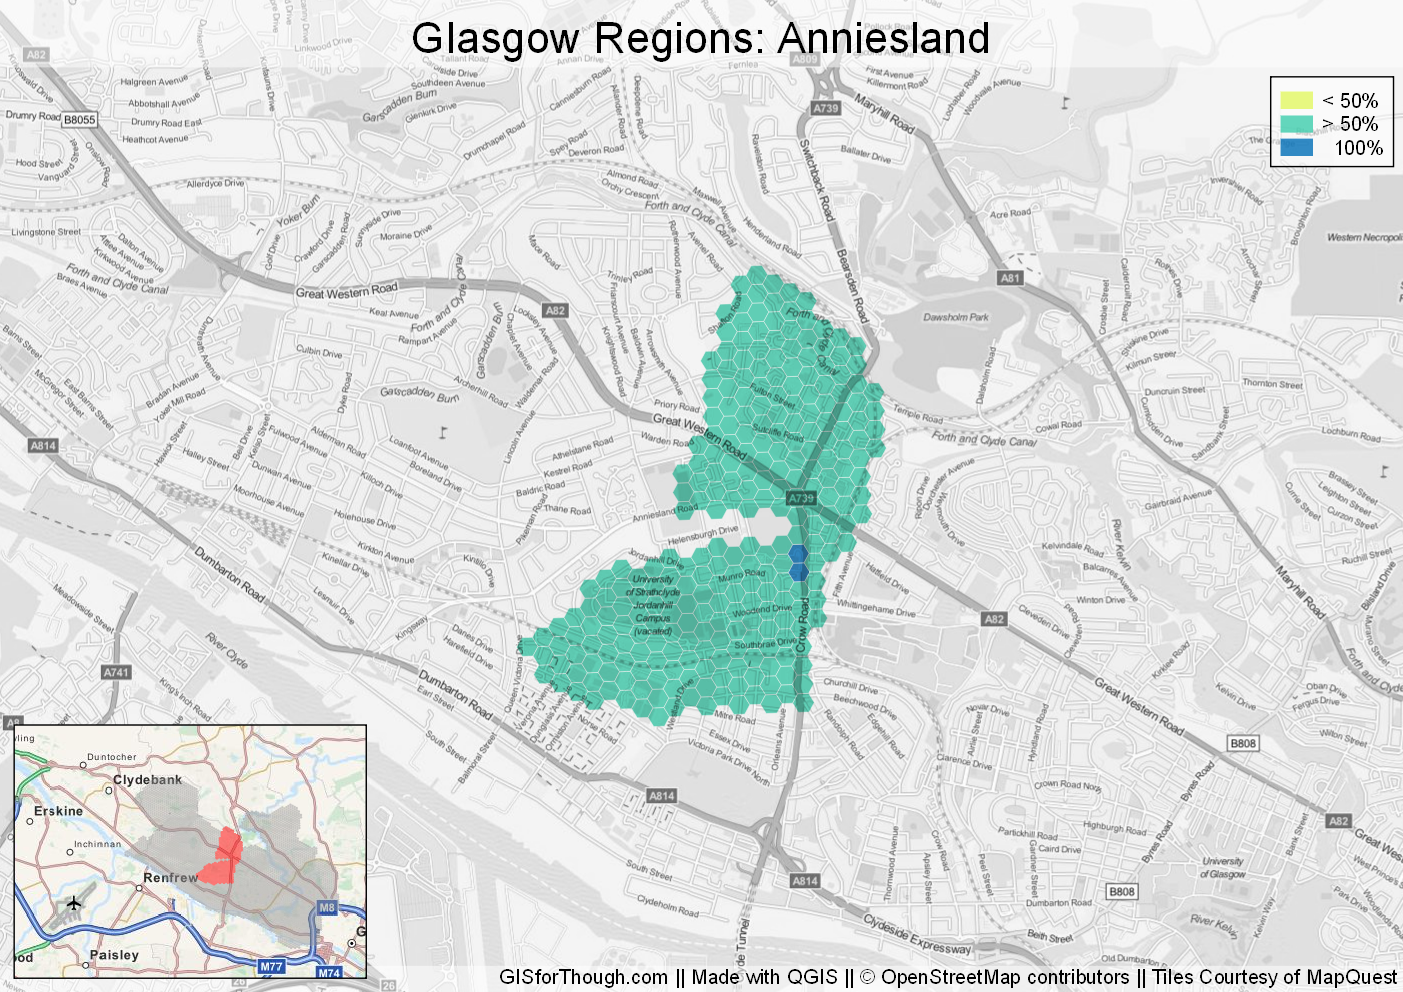
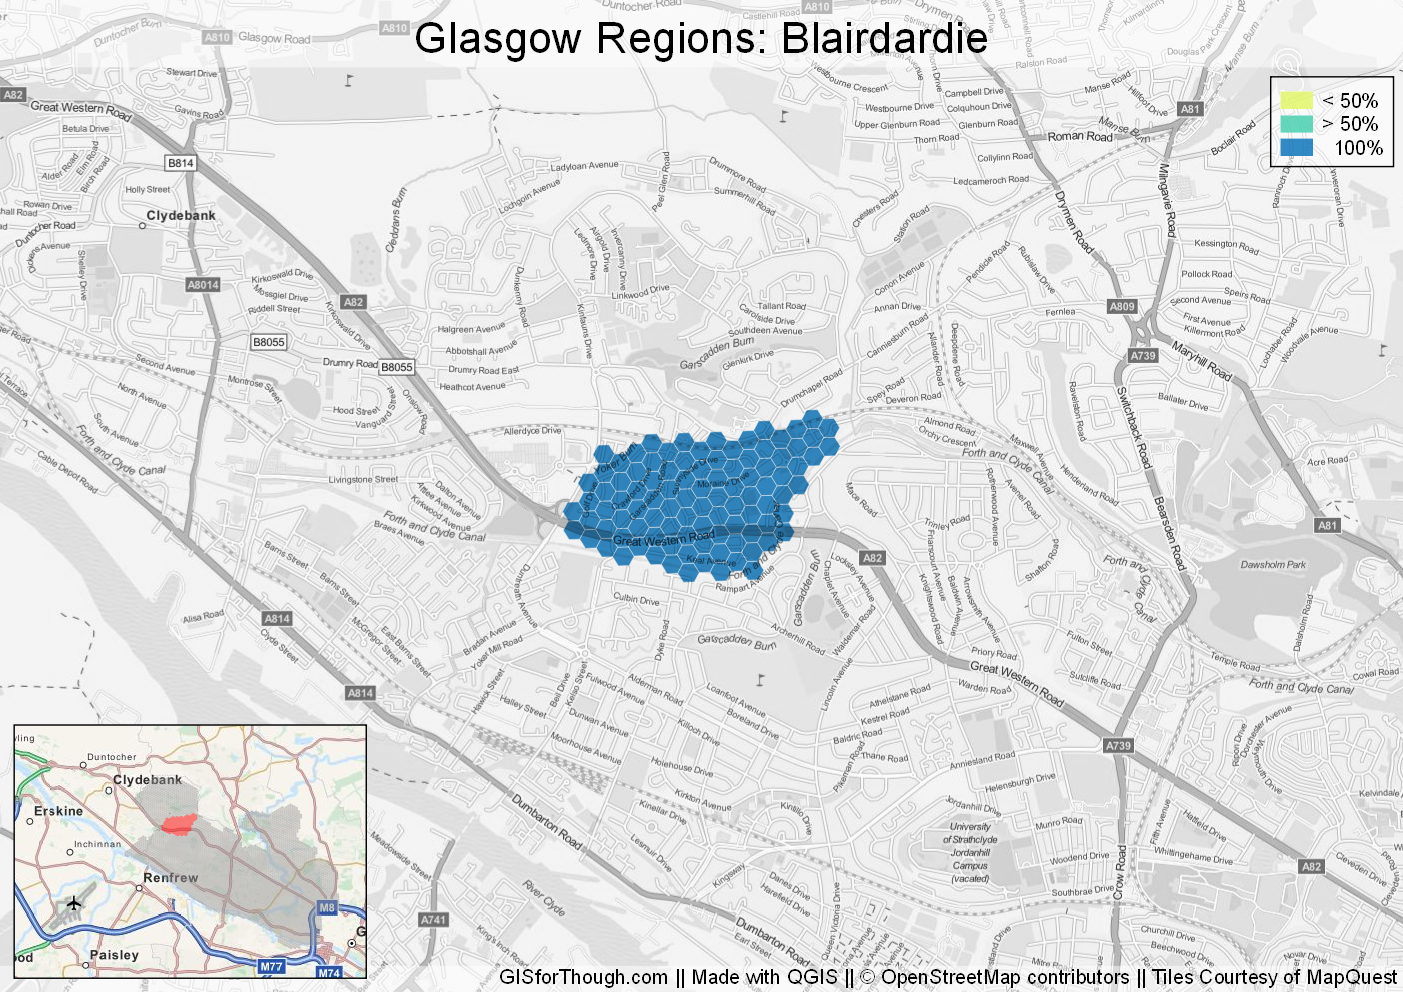
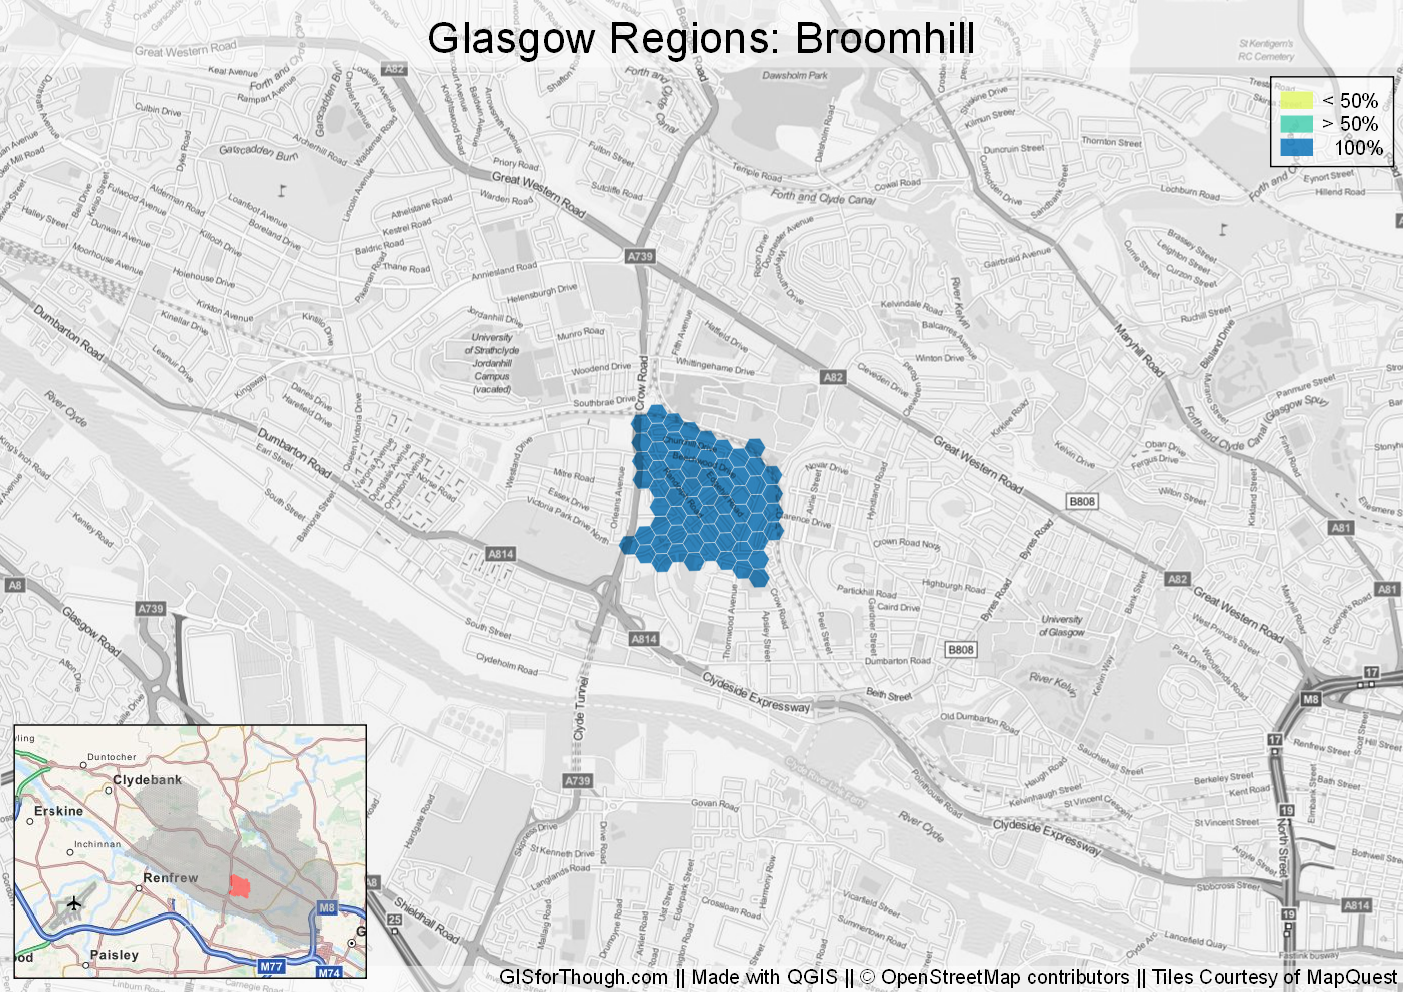
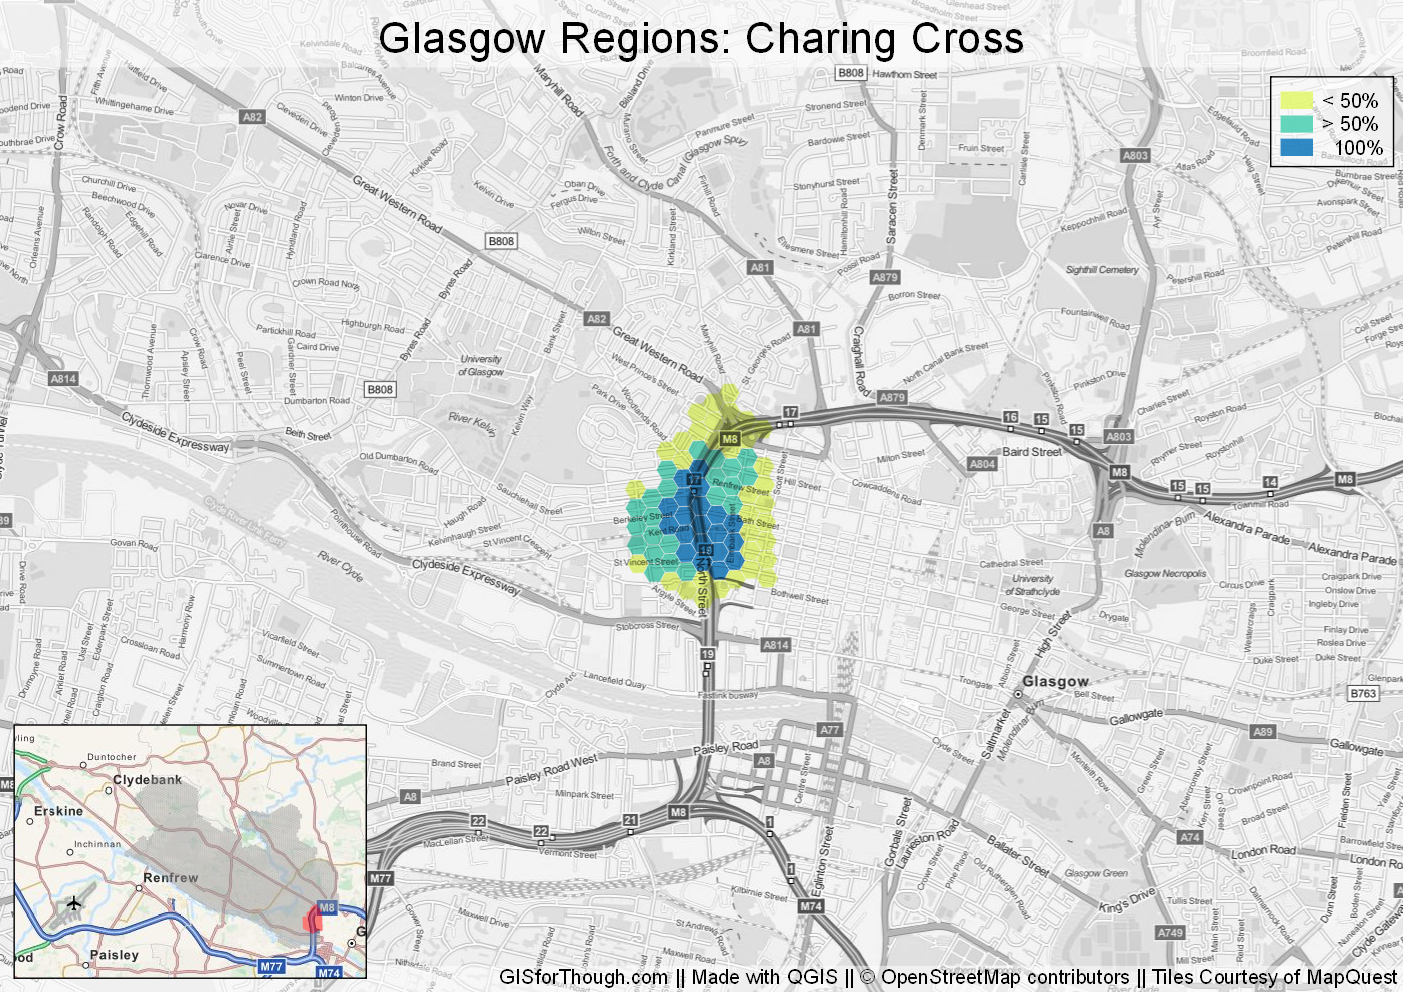
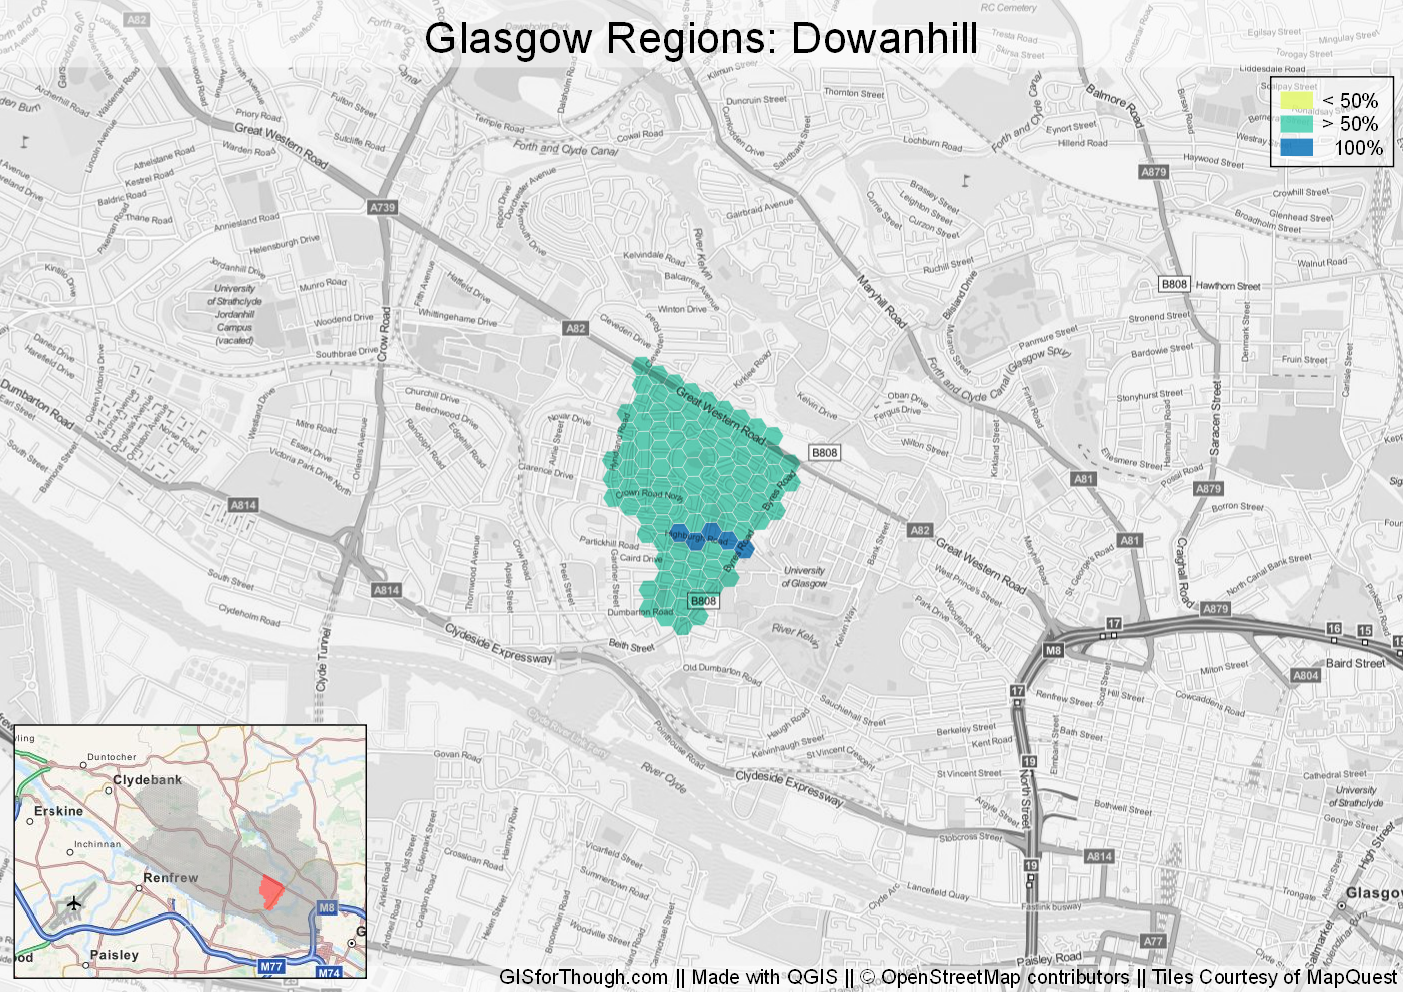
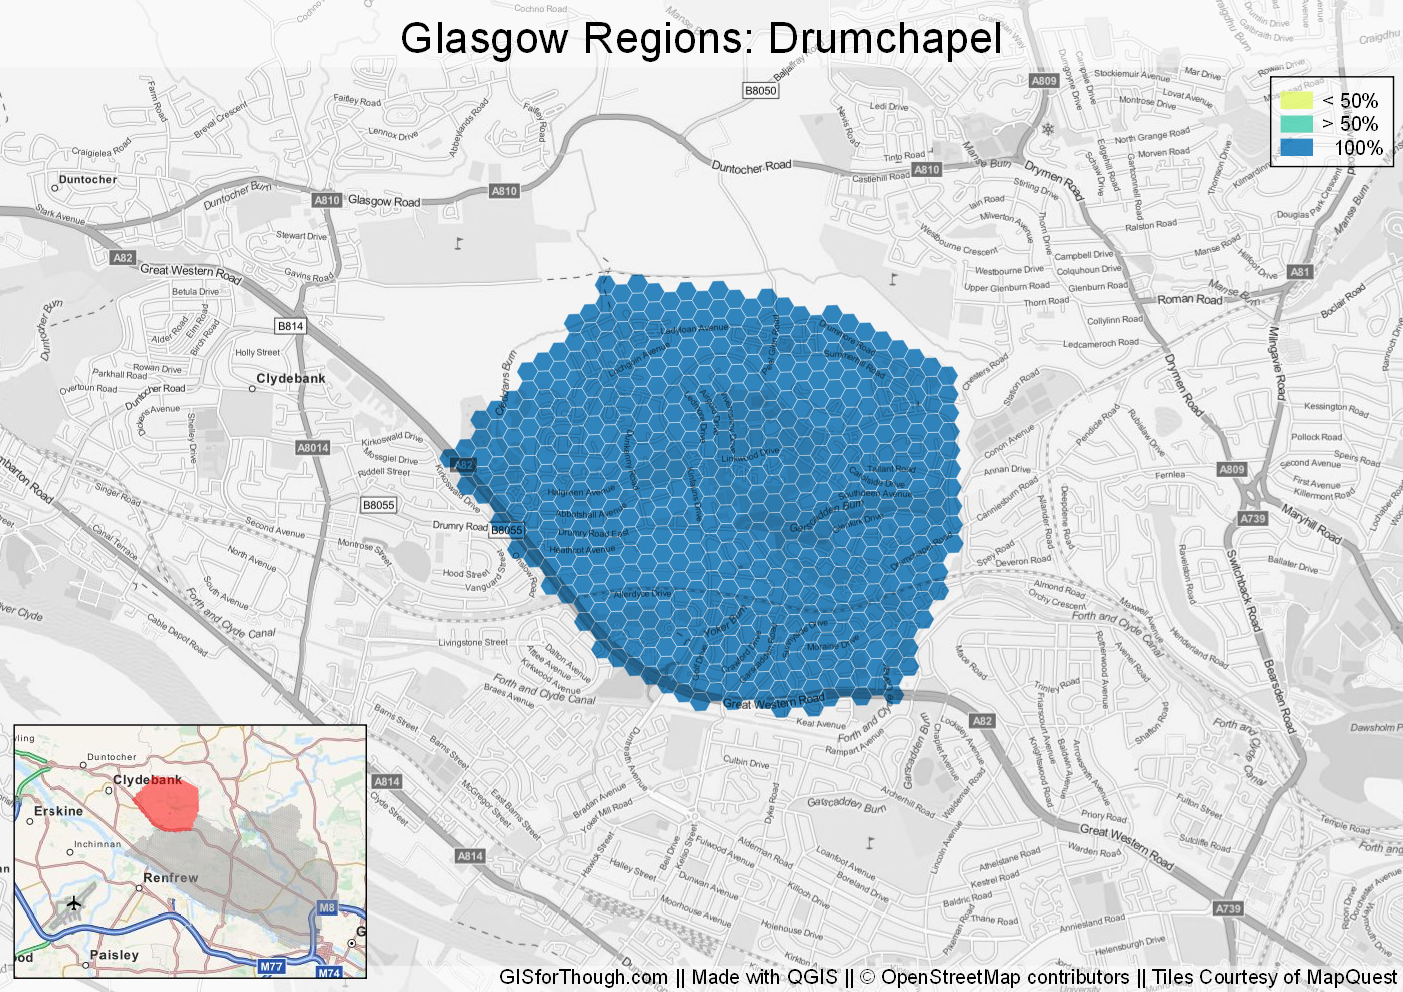
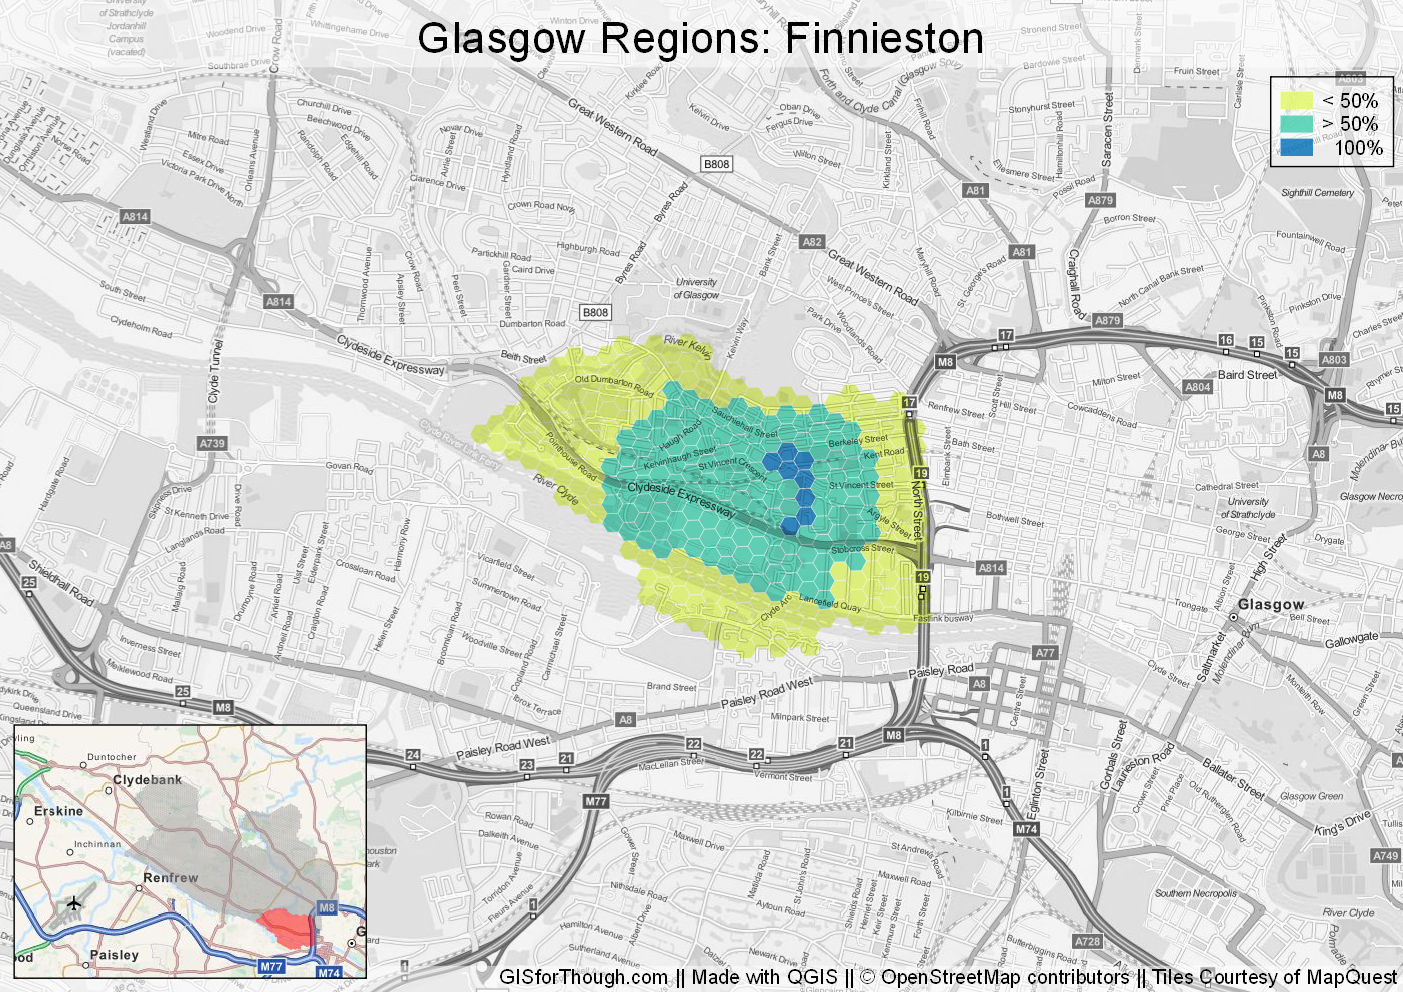
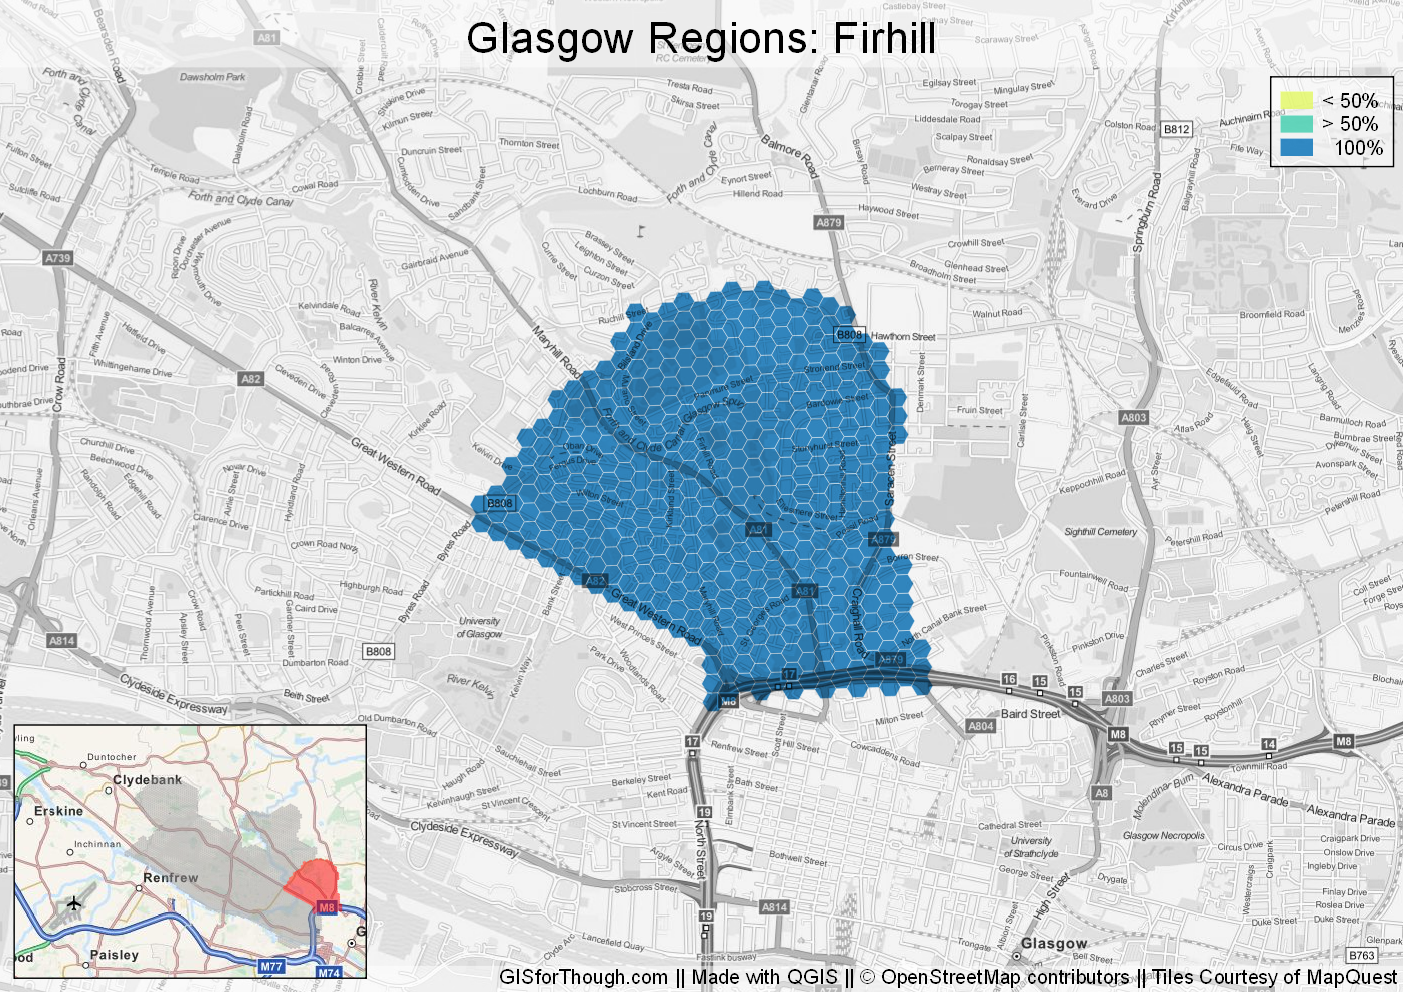
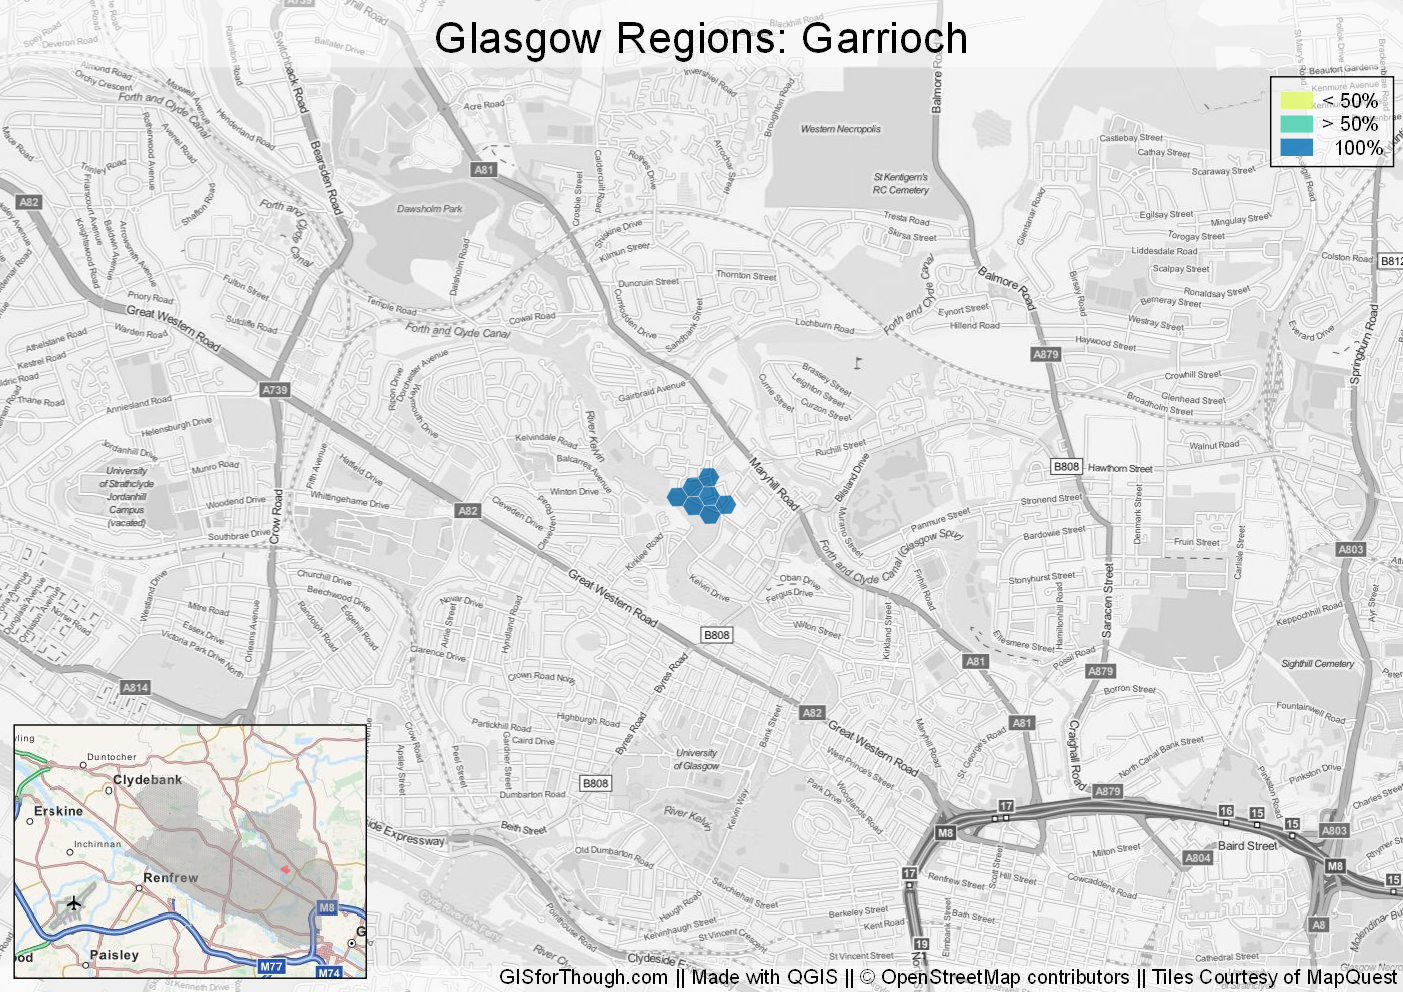
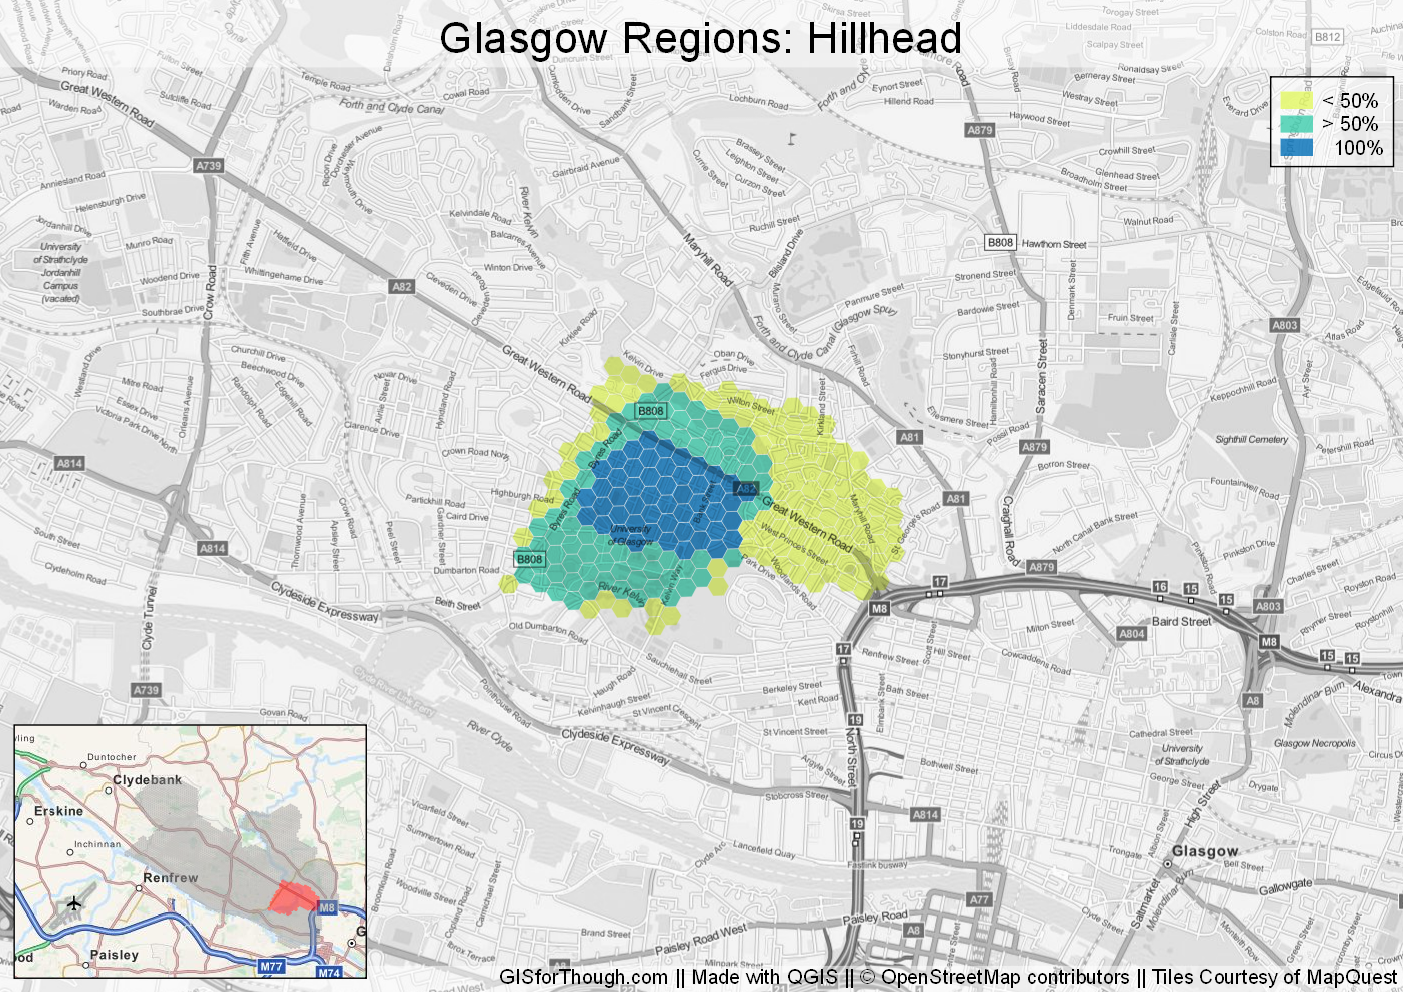
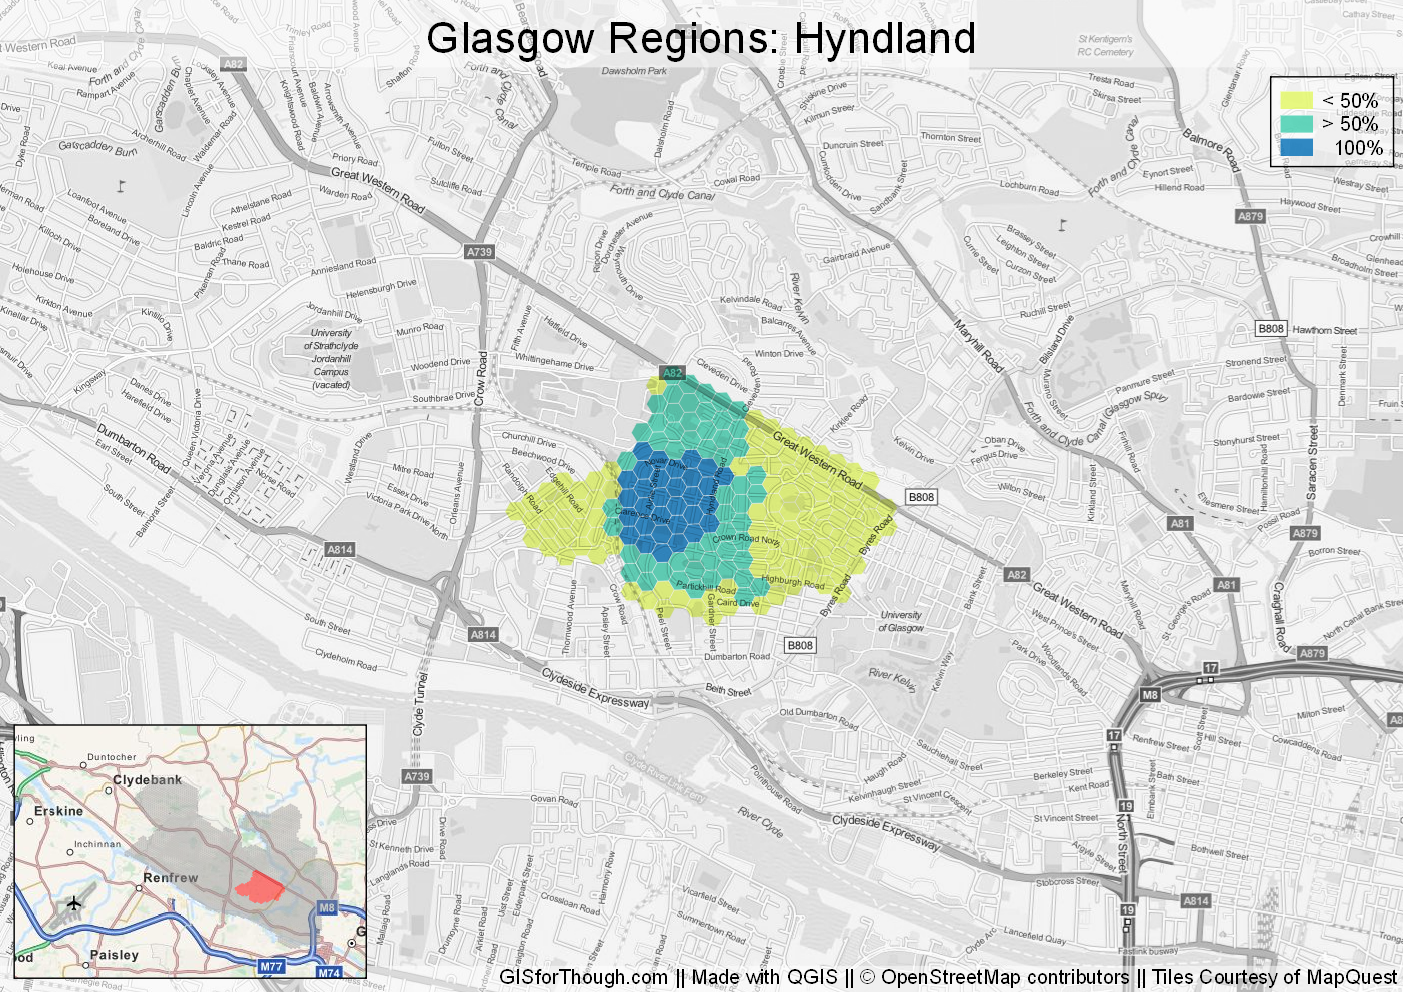
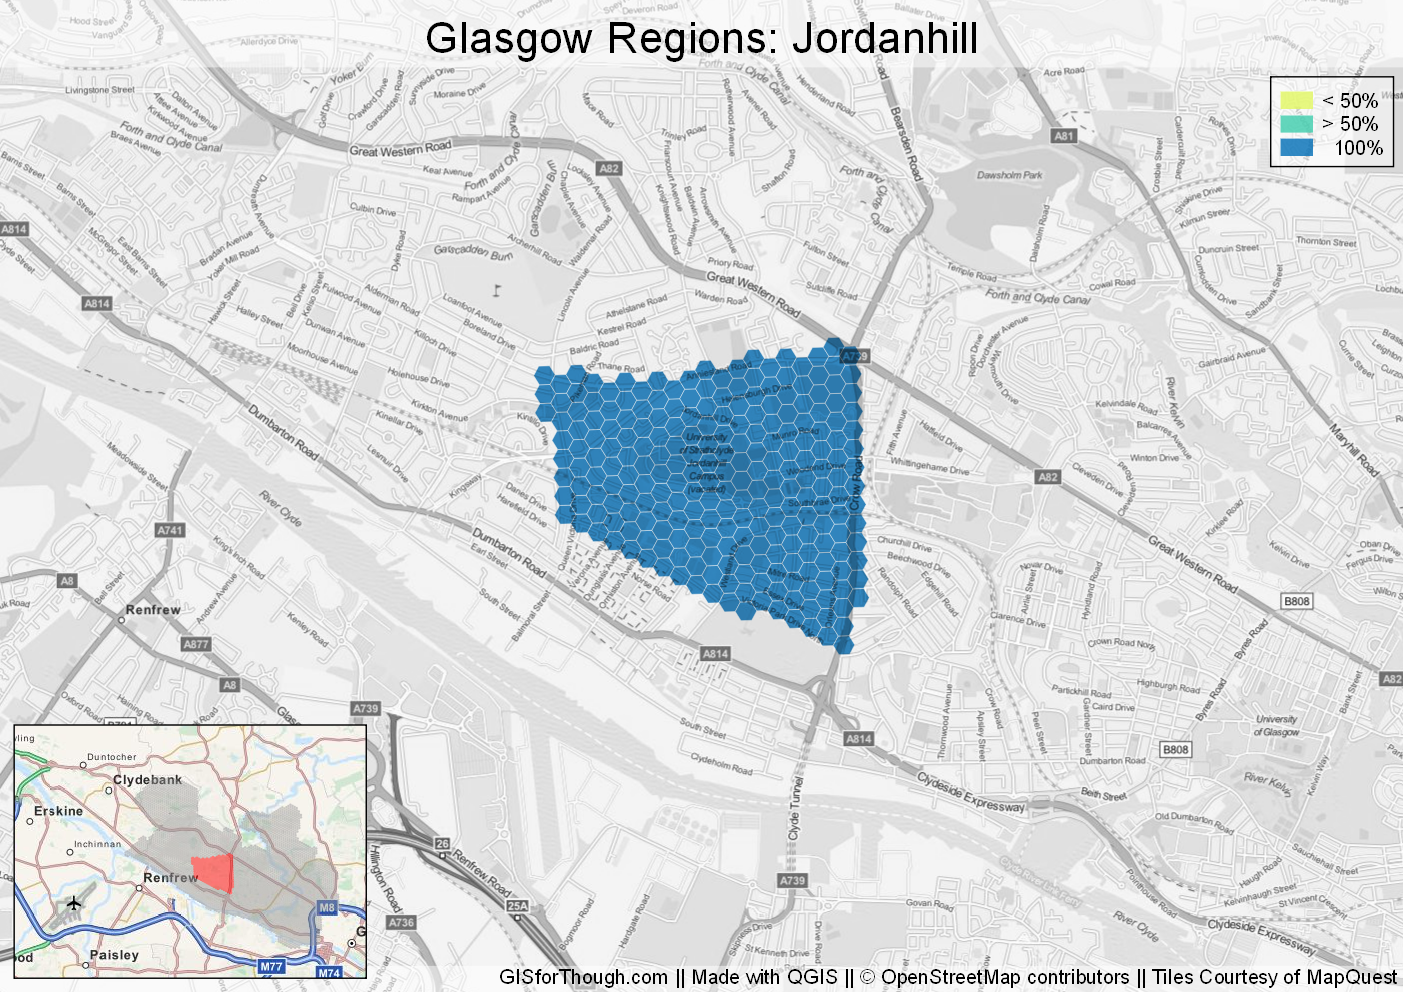
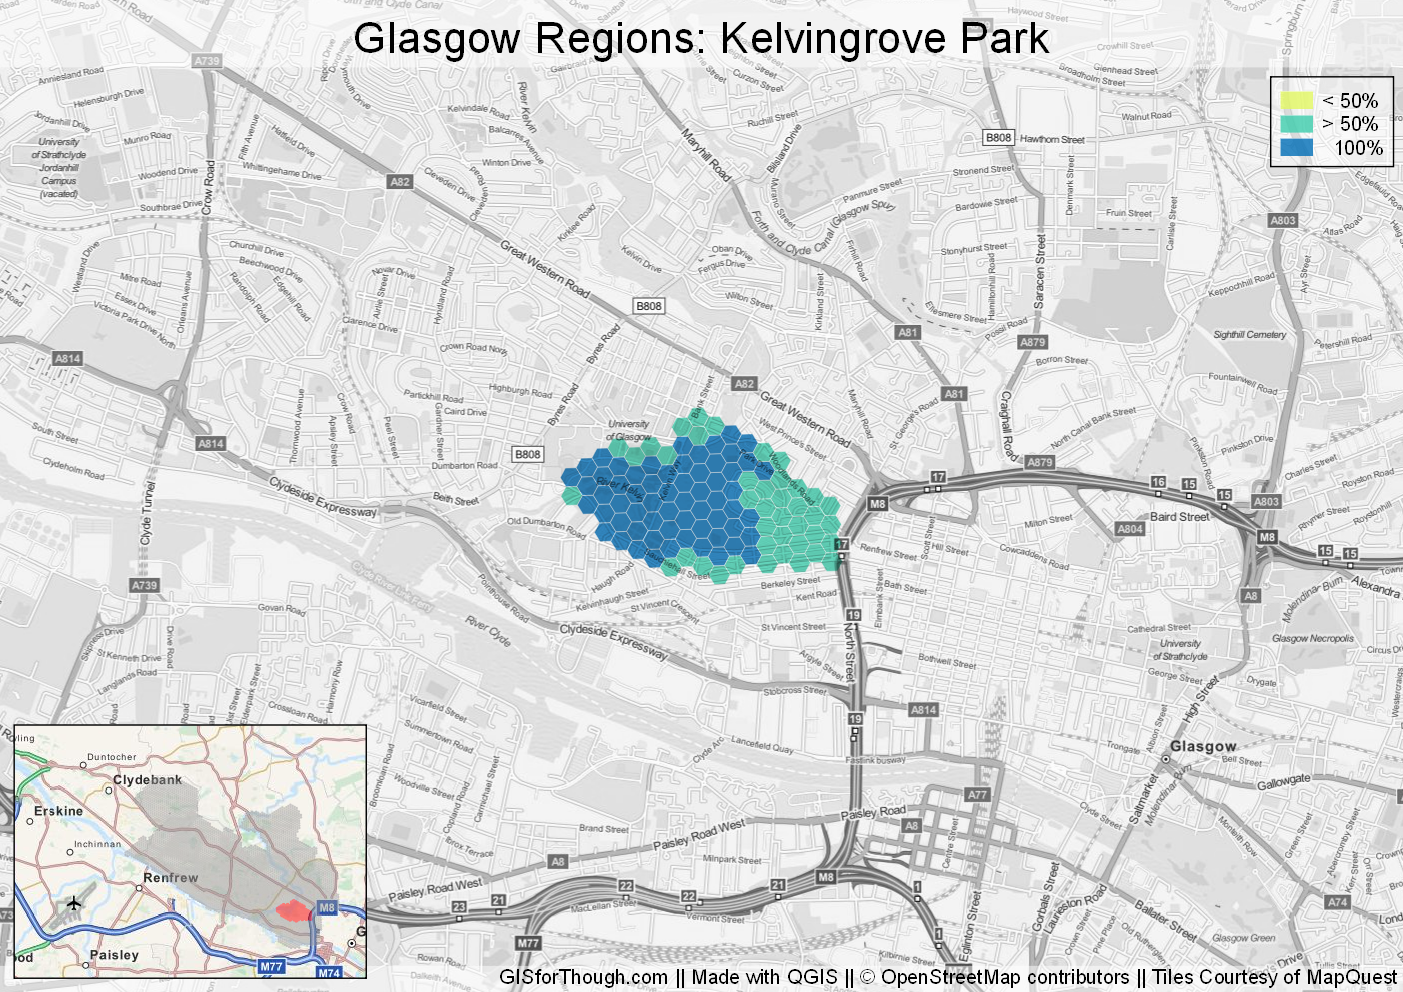
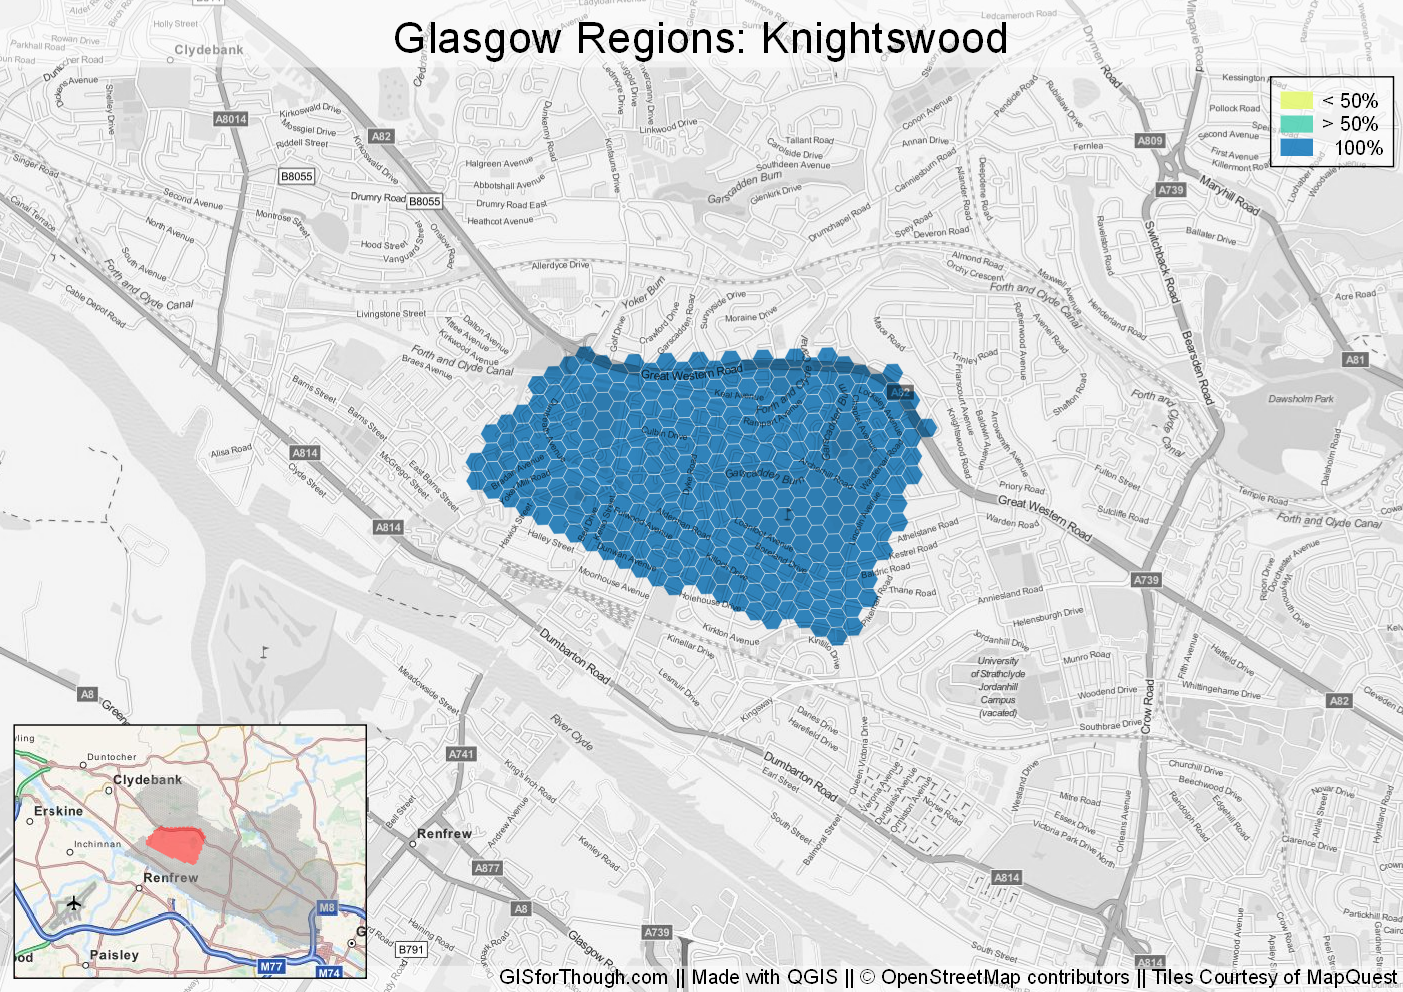
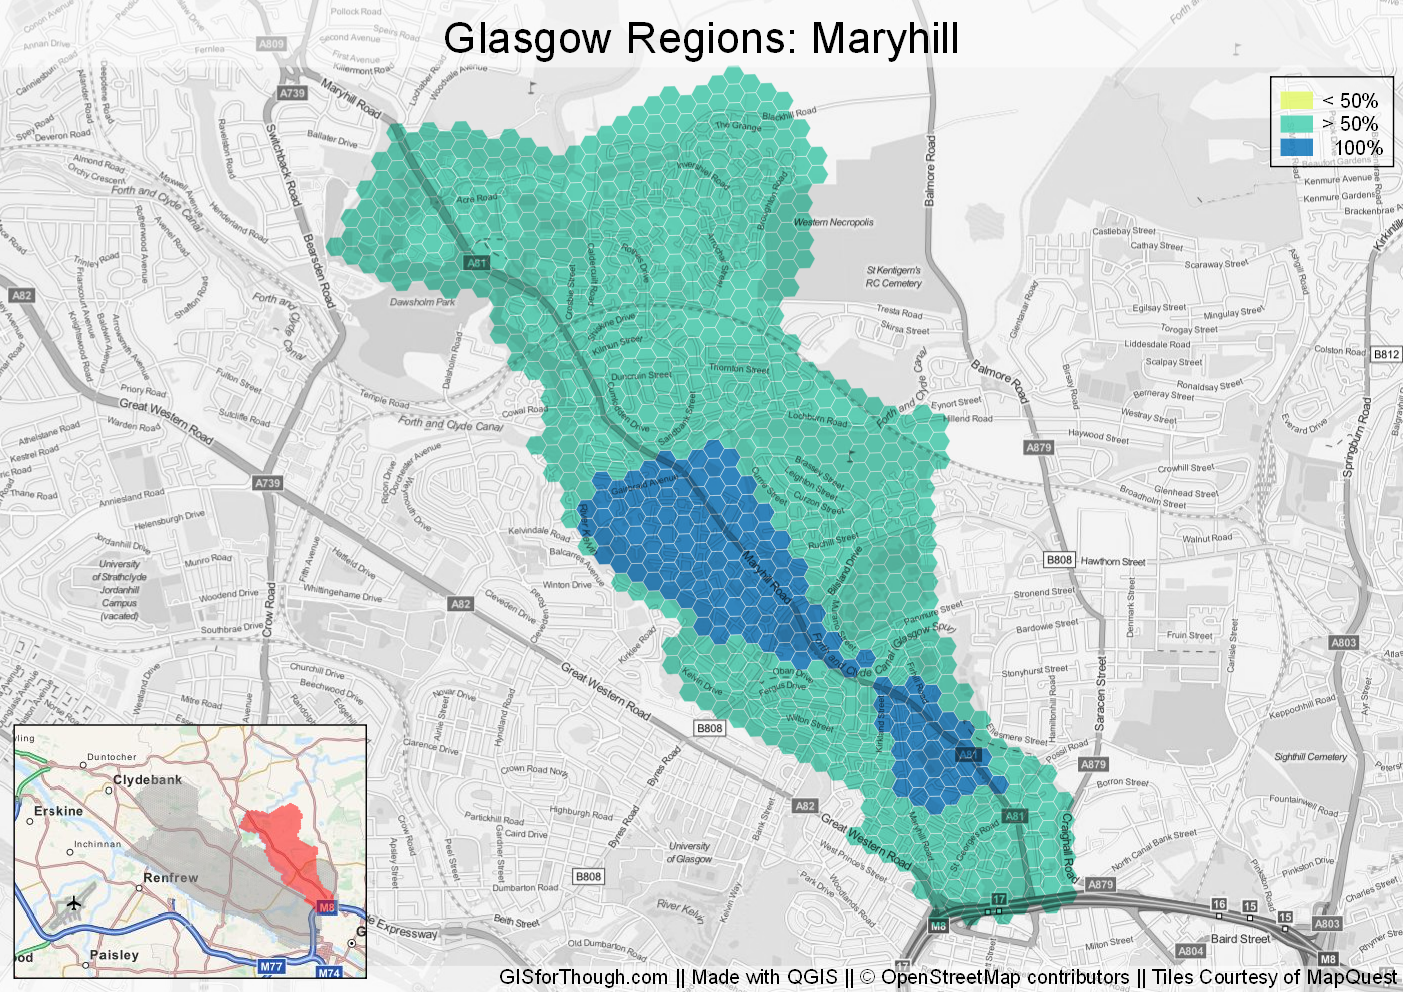
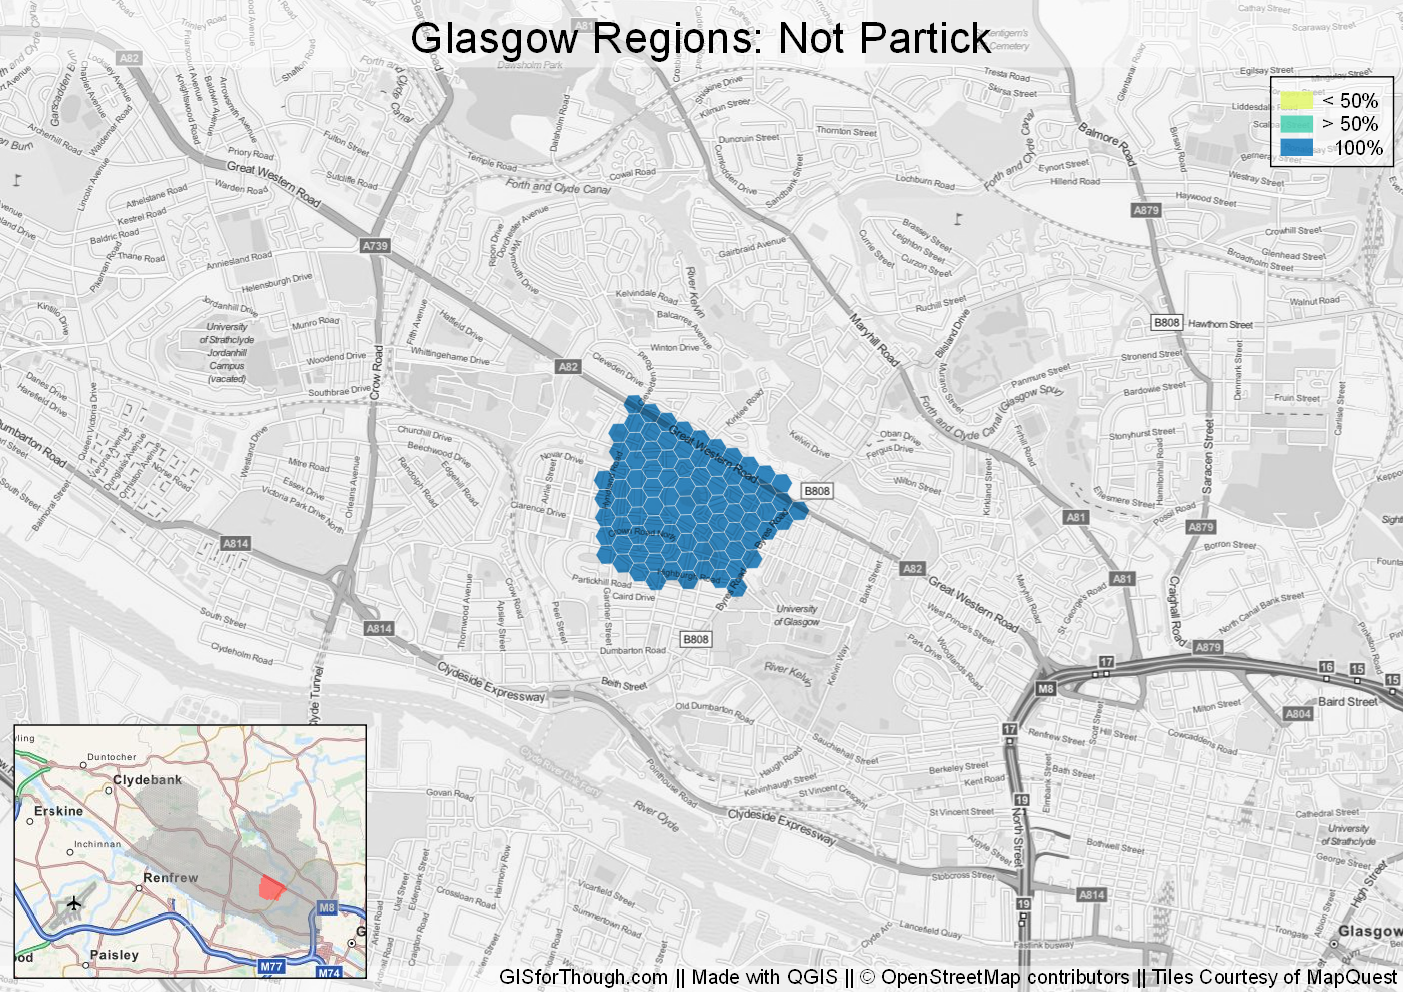
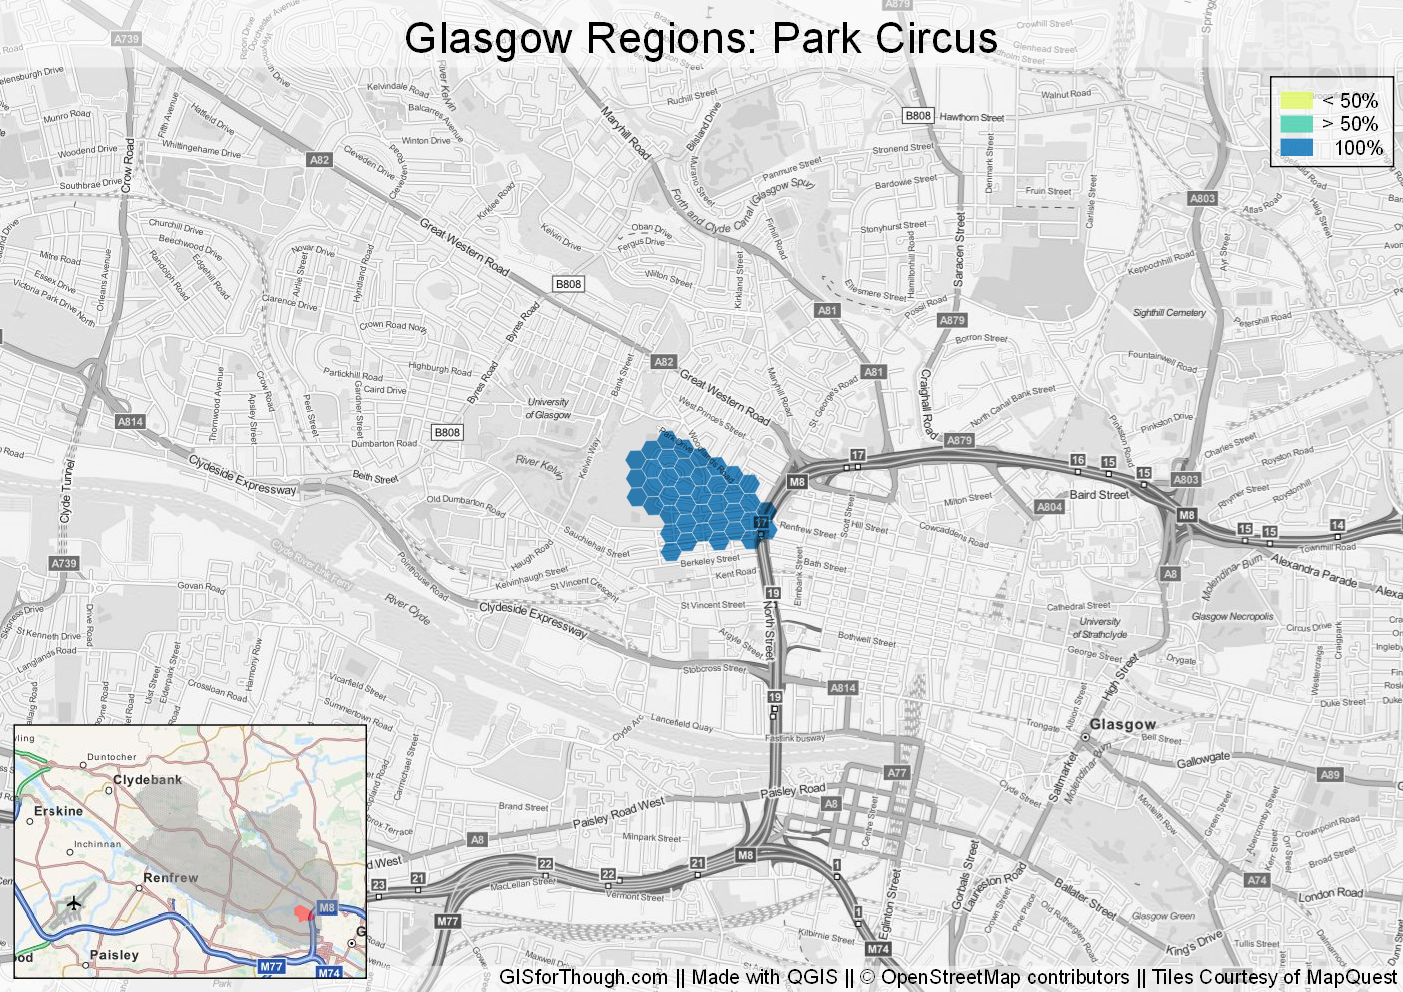
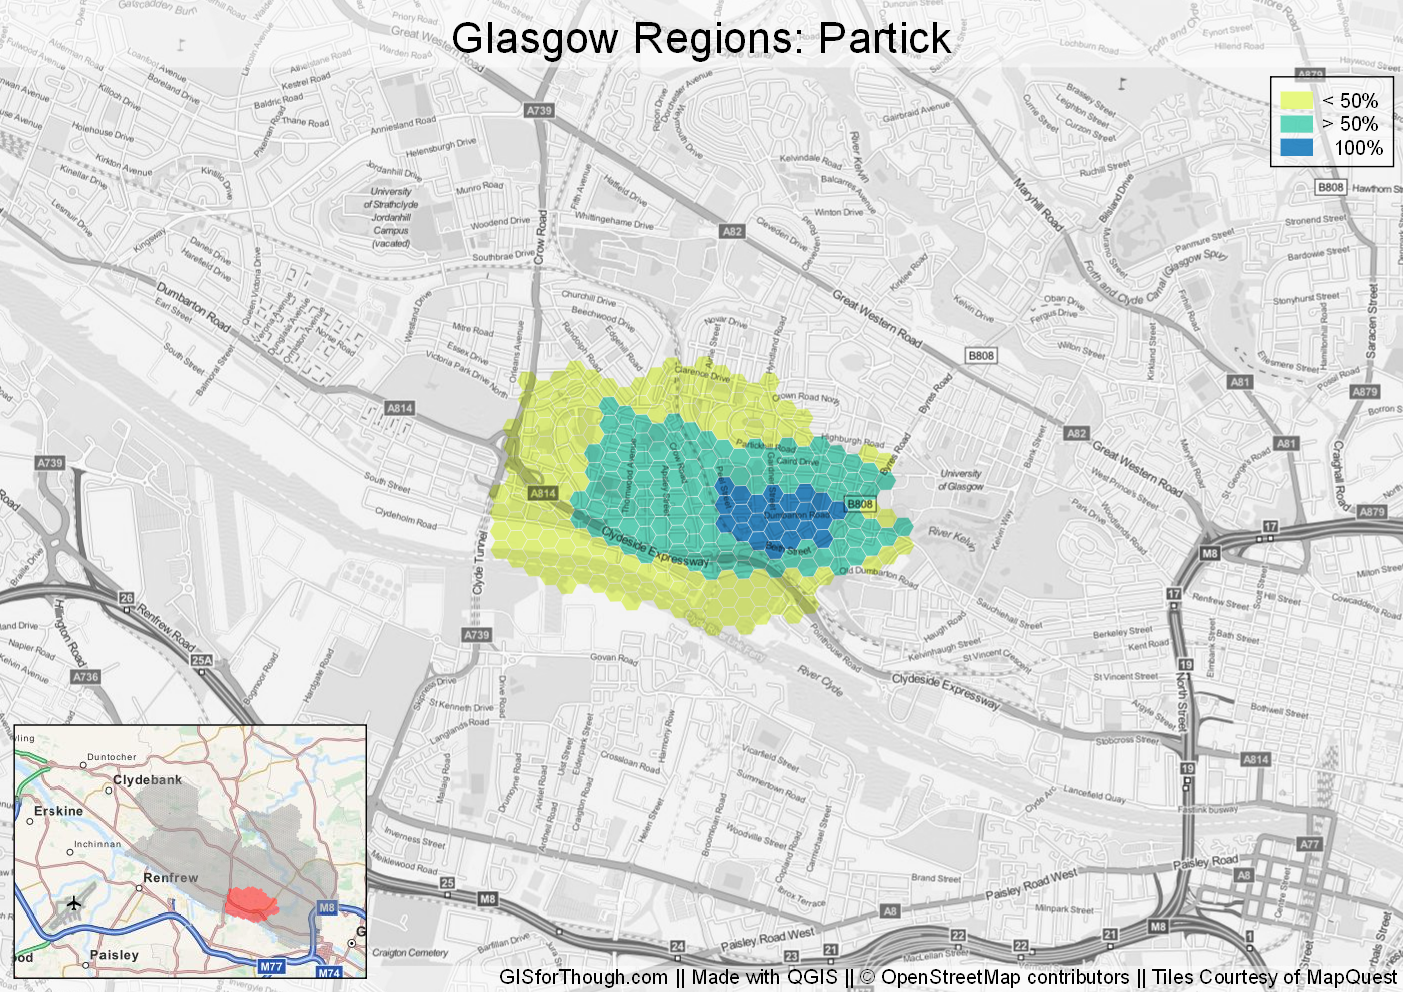
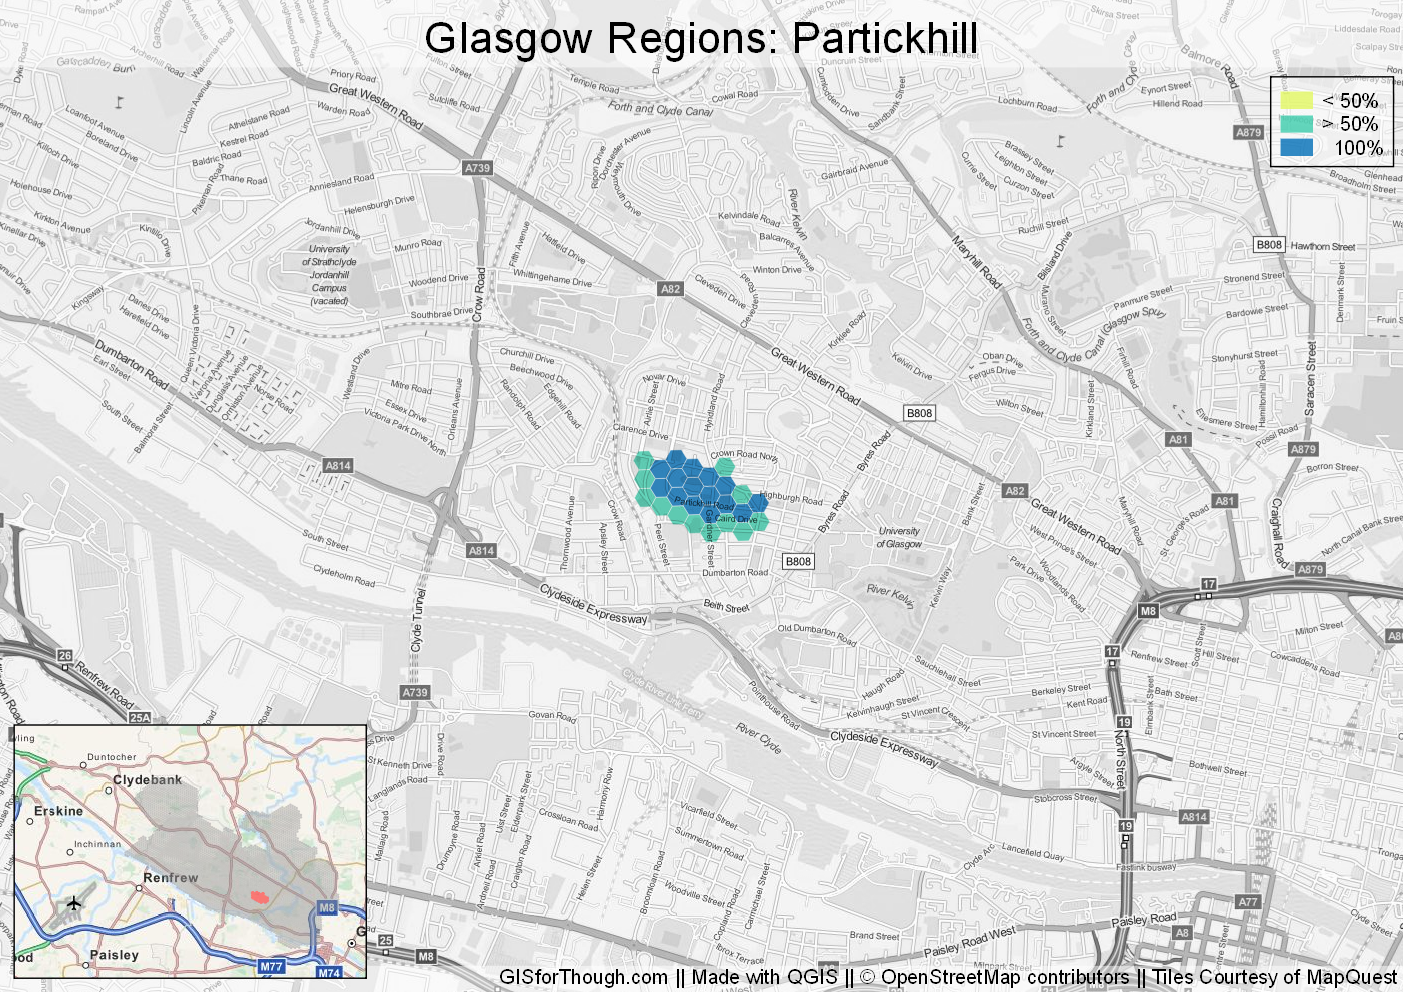
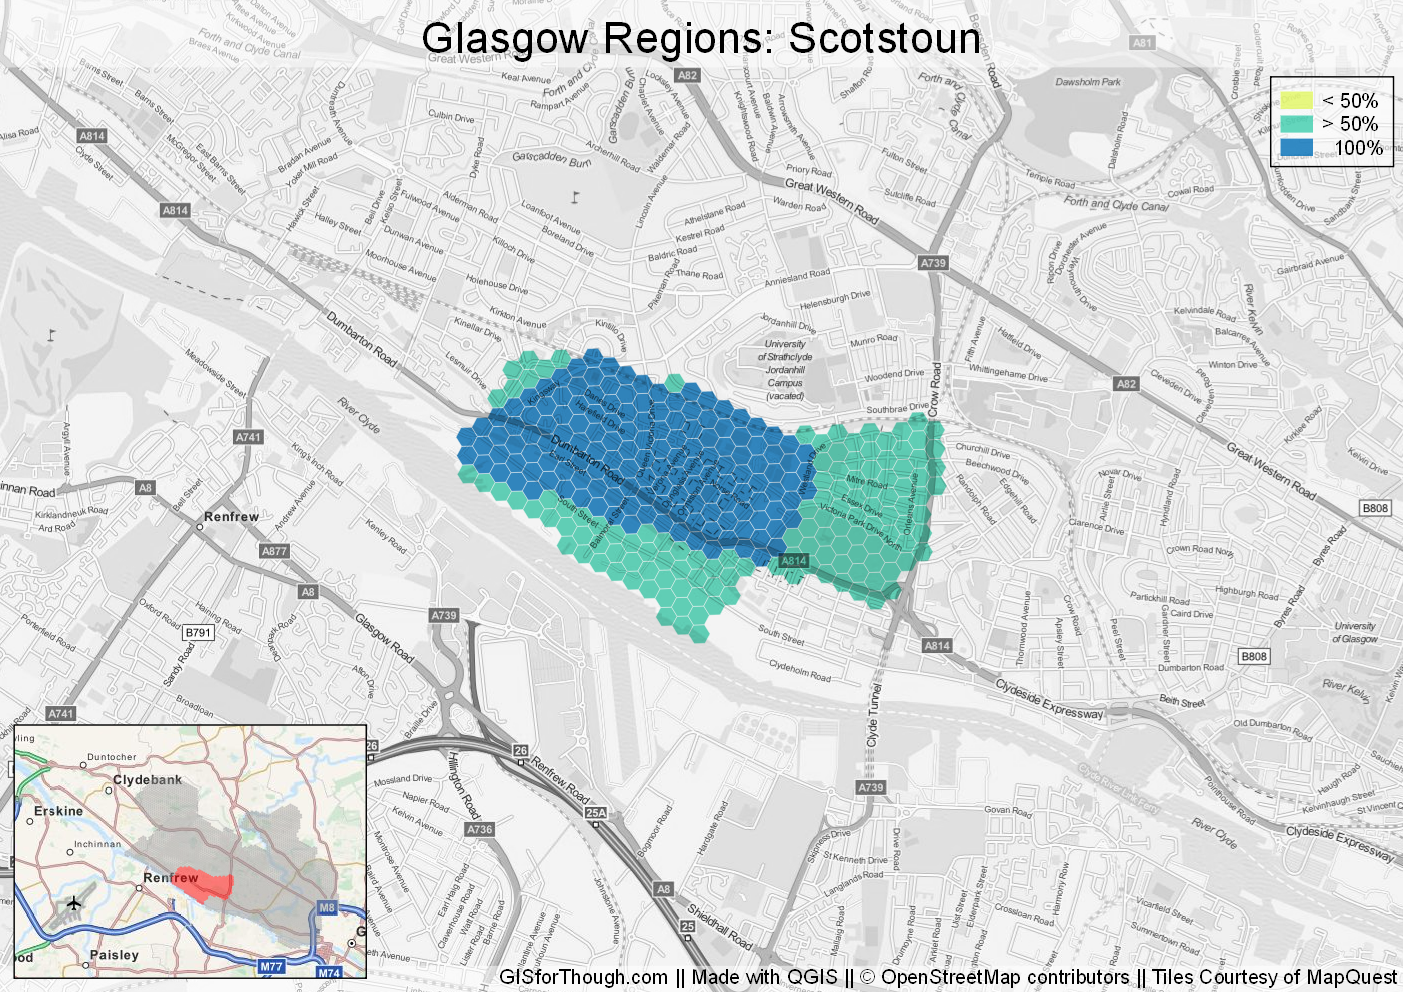
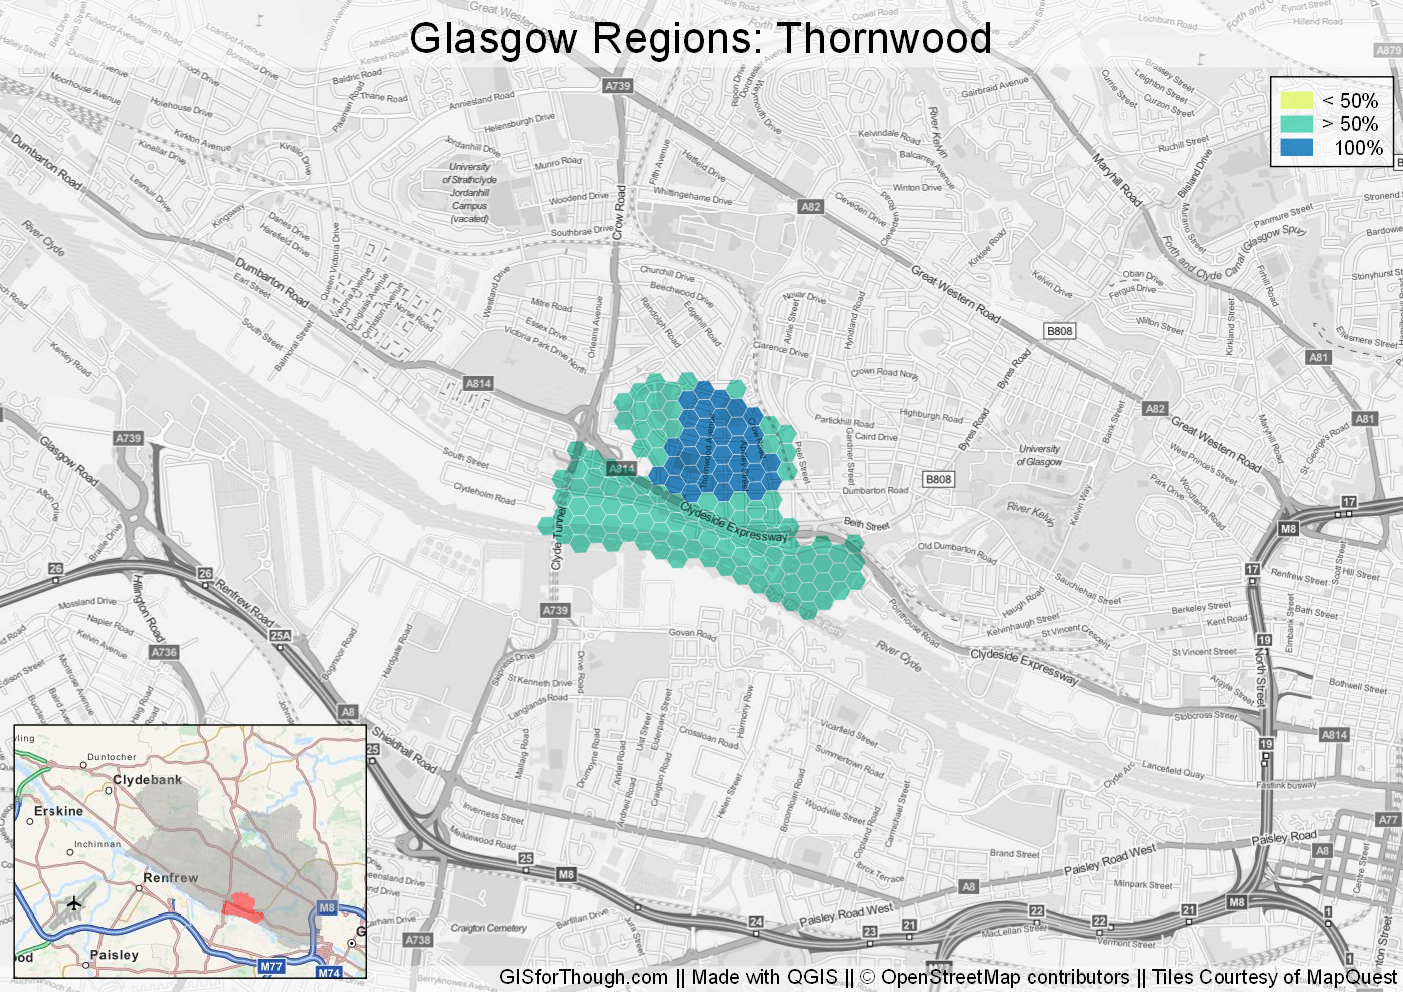
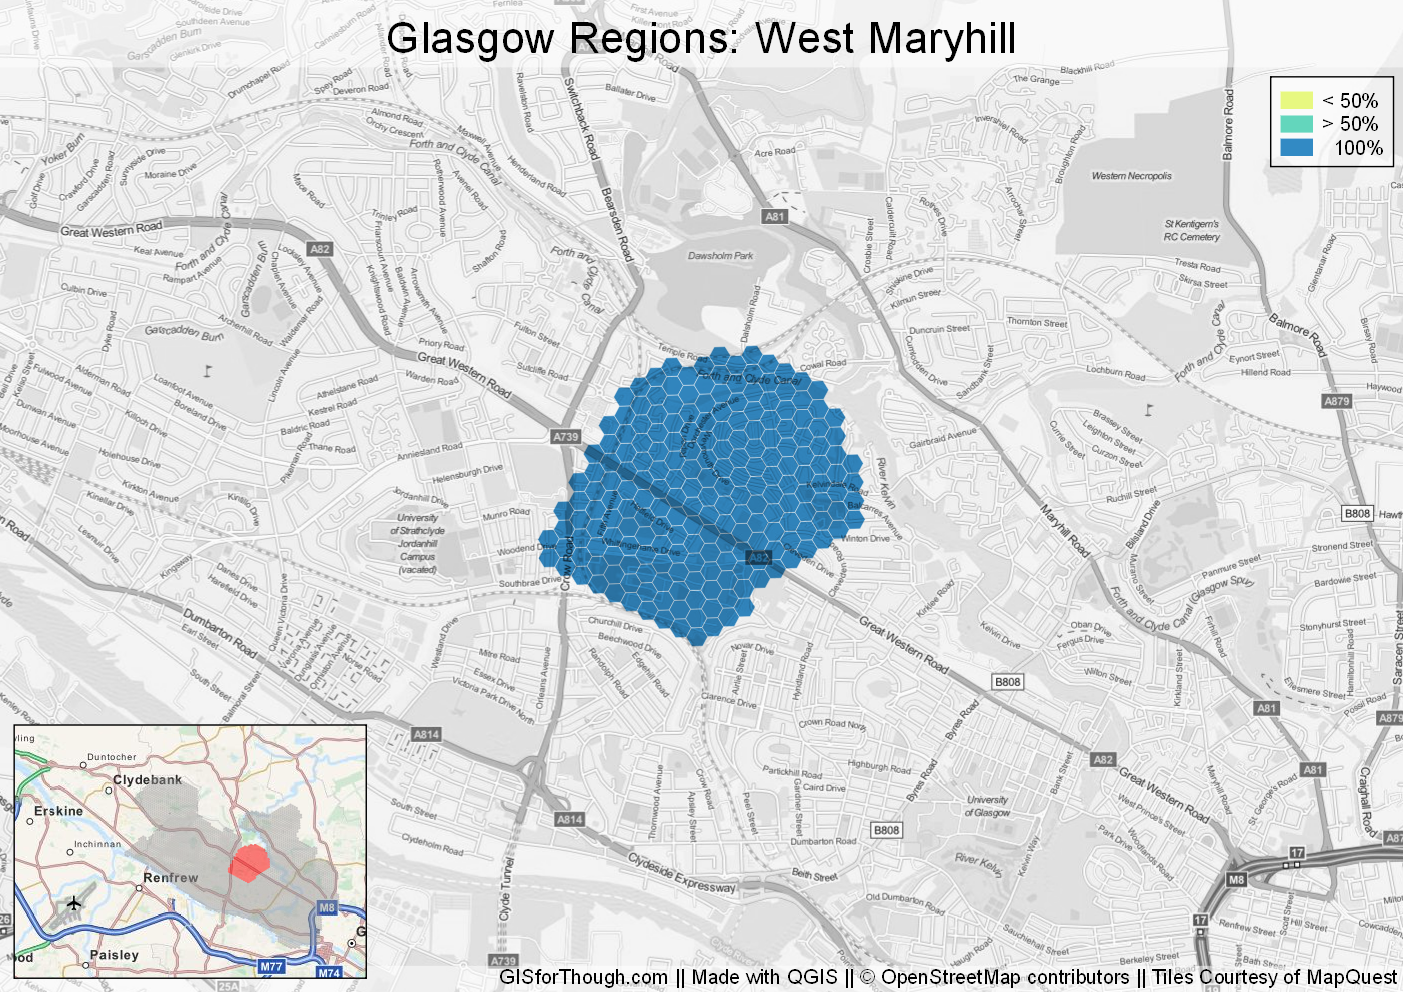
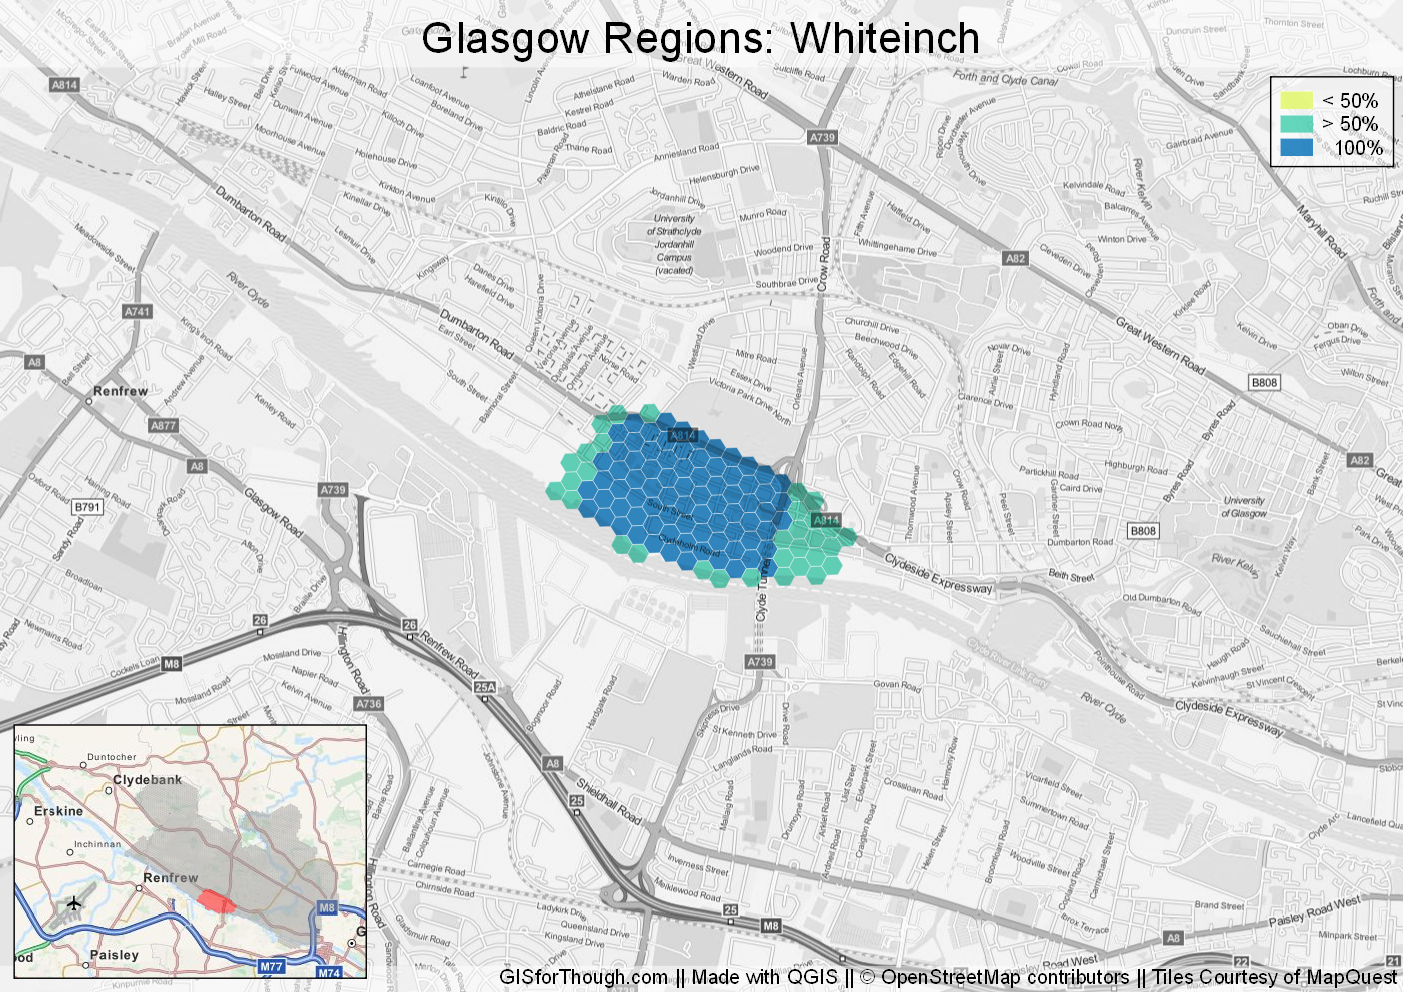
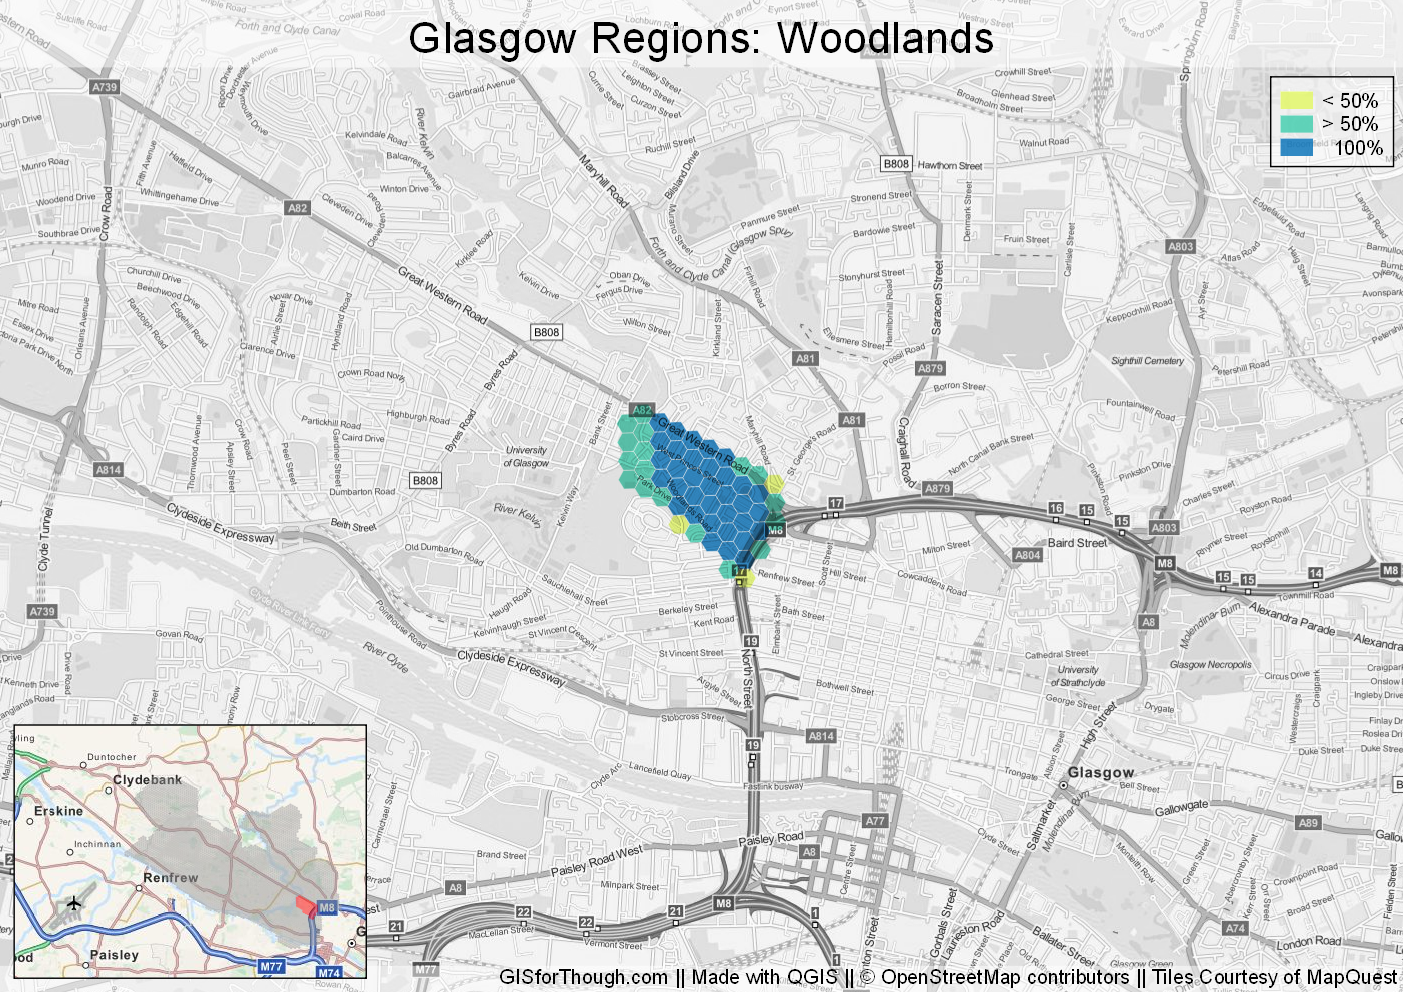
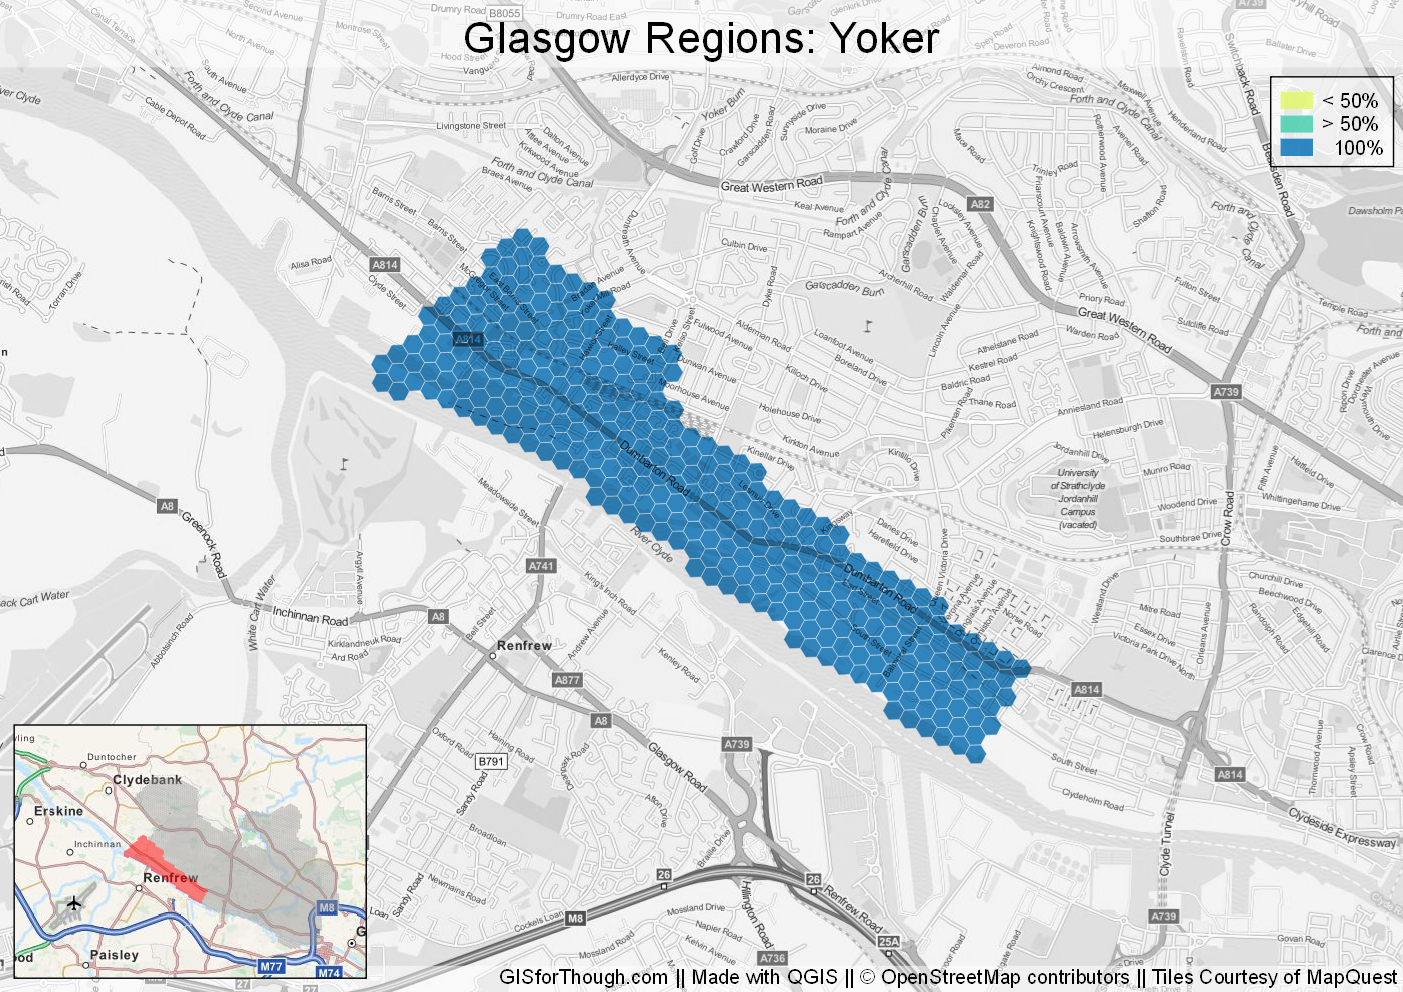
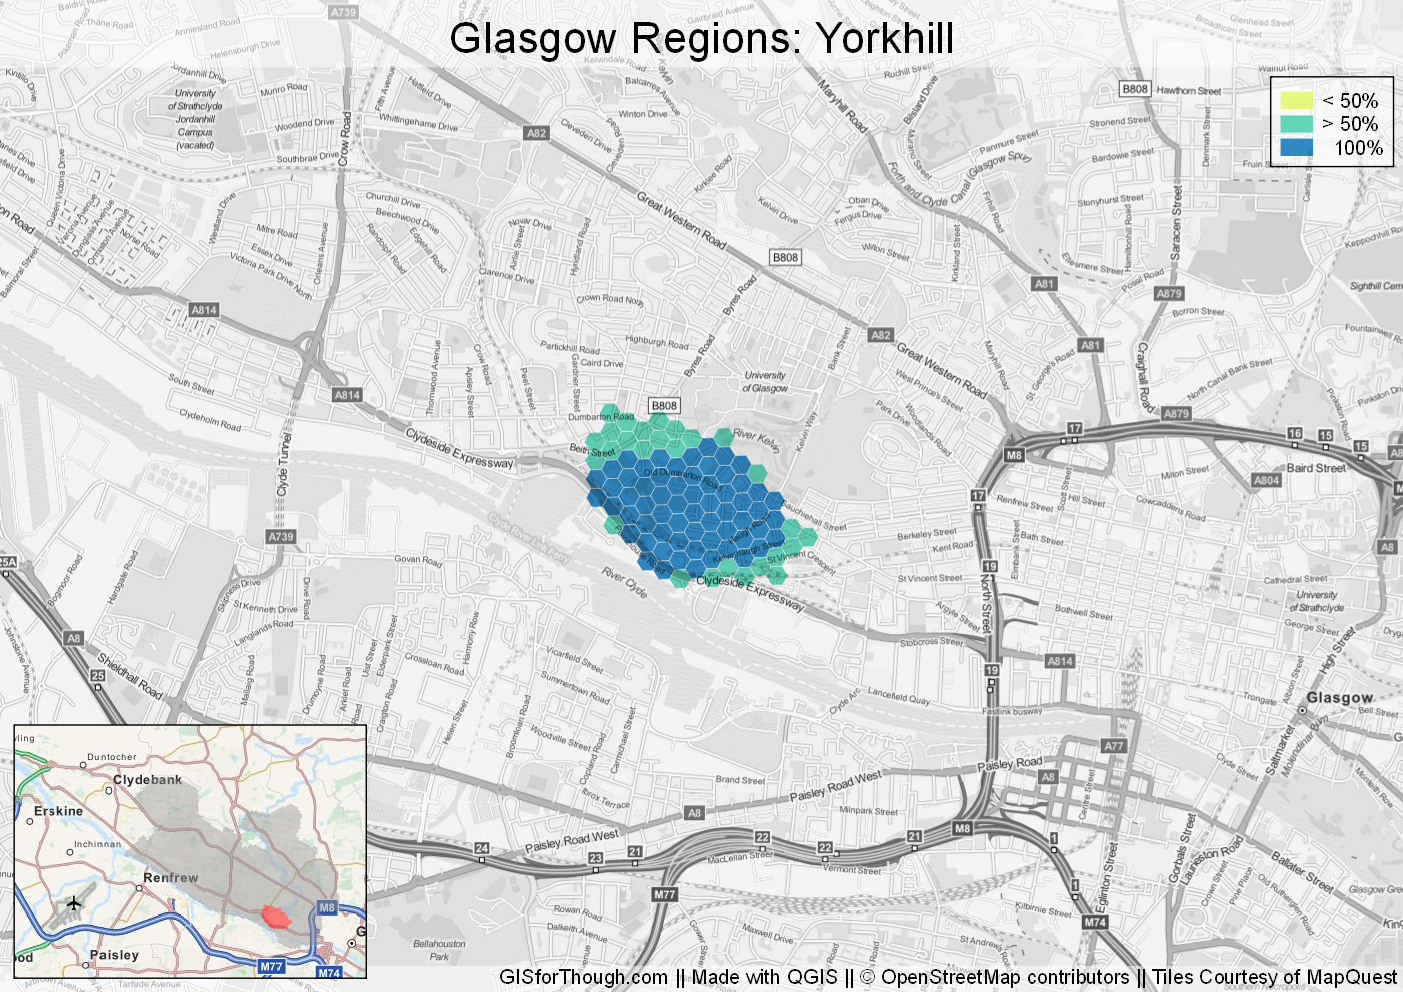
Glasgow
The west end is the true Glasgow.
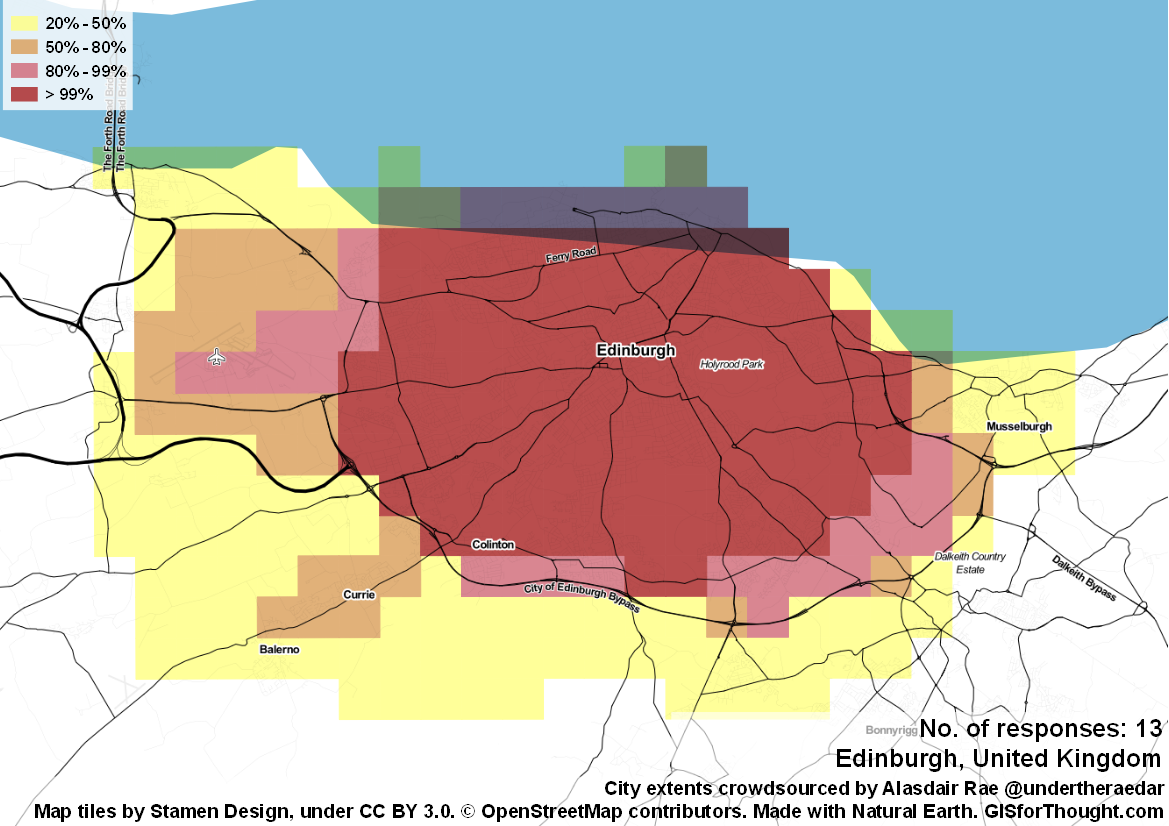
Edinburgh
Very inclusive.
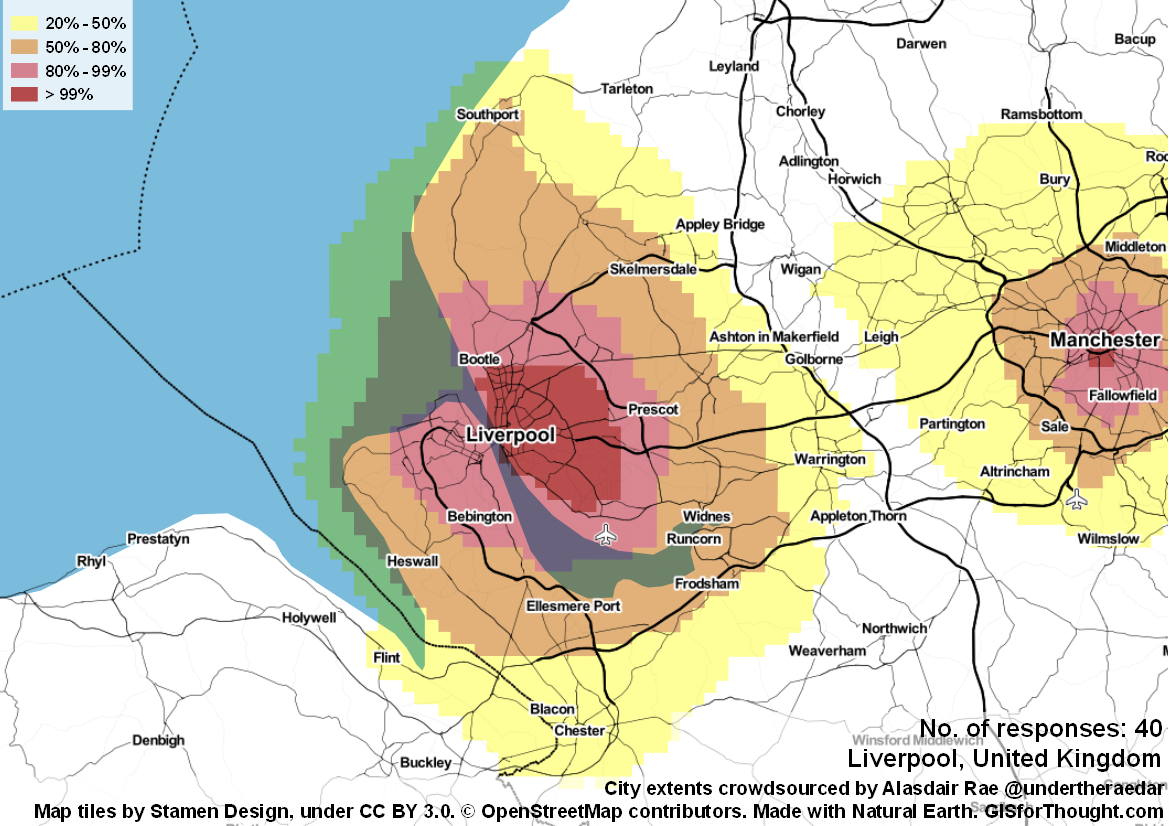
Liverpool
Much larger and inclusive than Manchester.
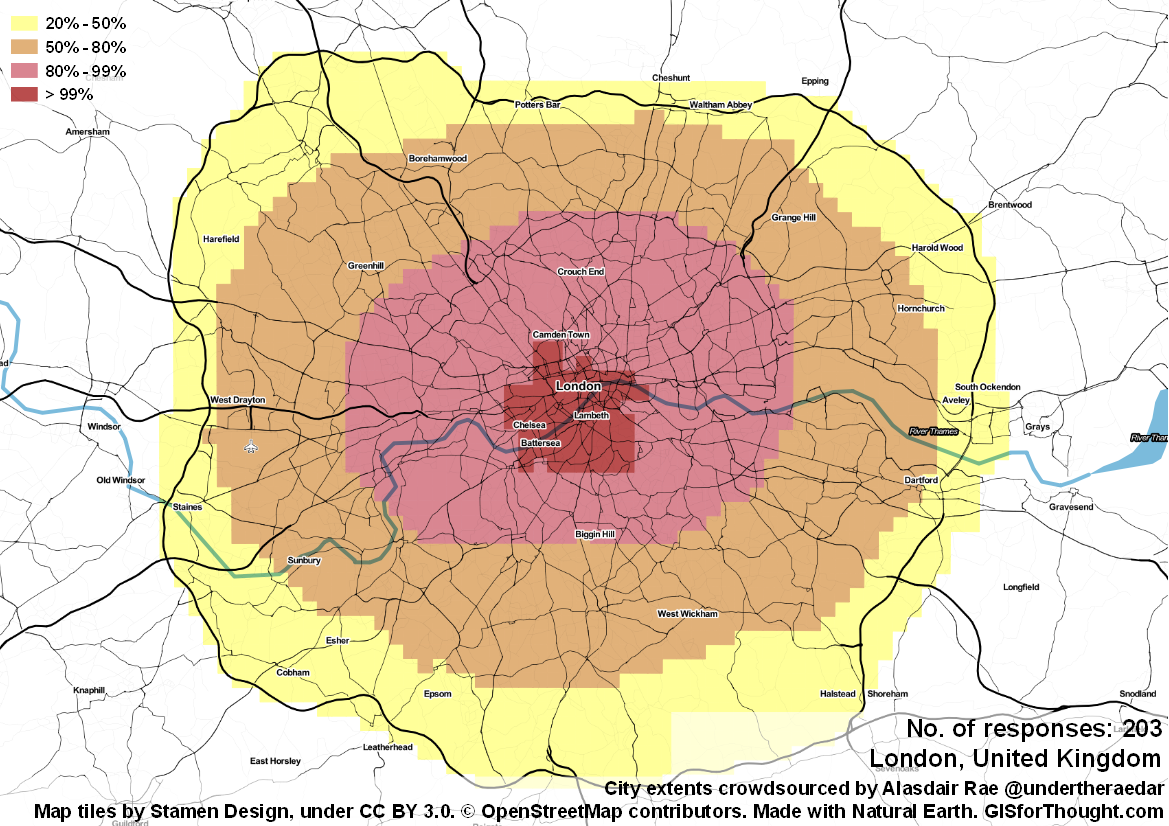
London
The M25 provides a very handy limiting barrier.
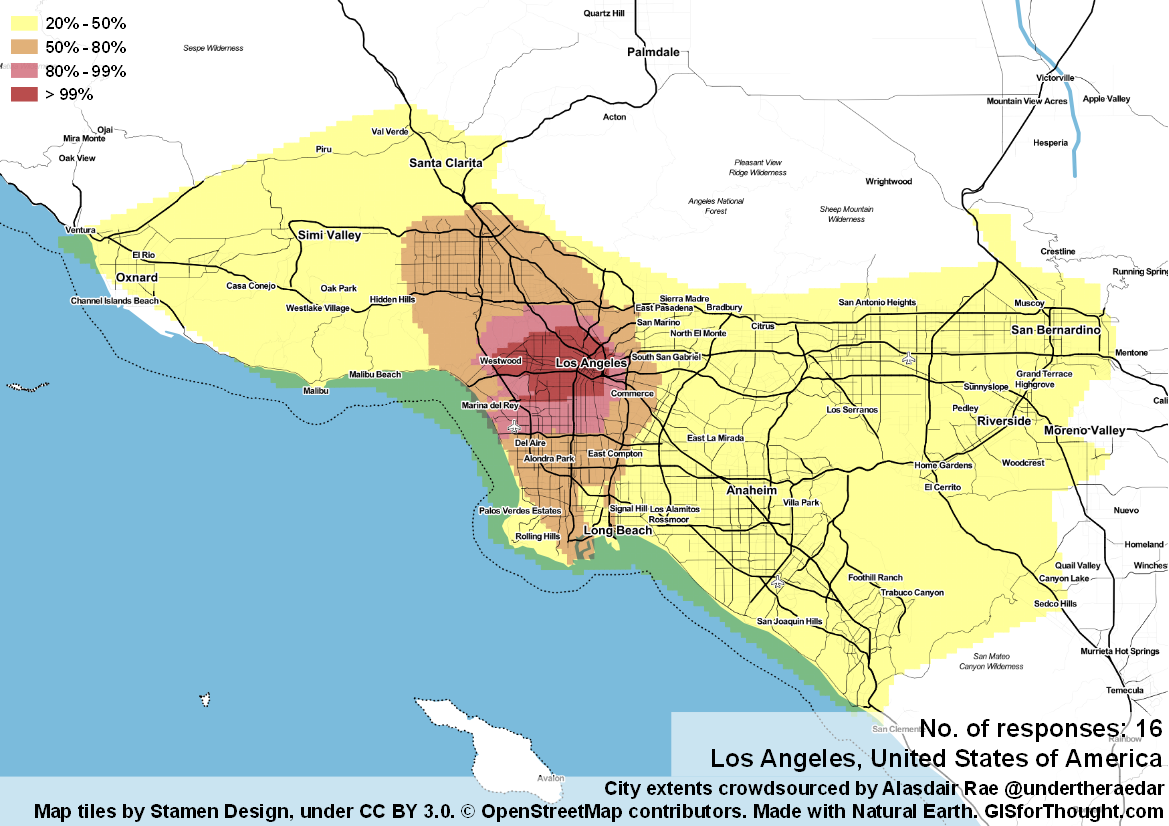
LA
Far reaching urban sprawl.
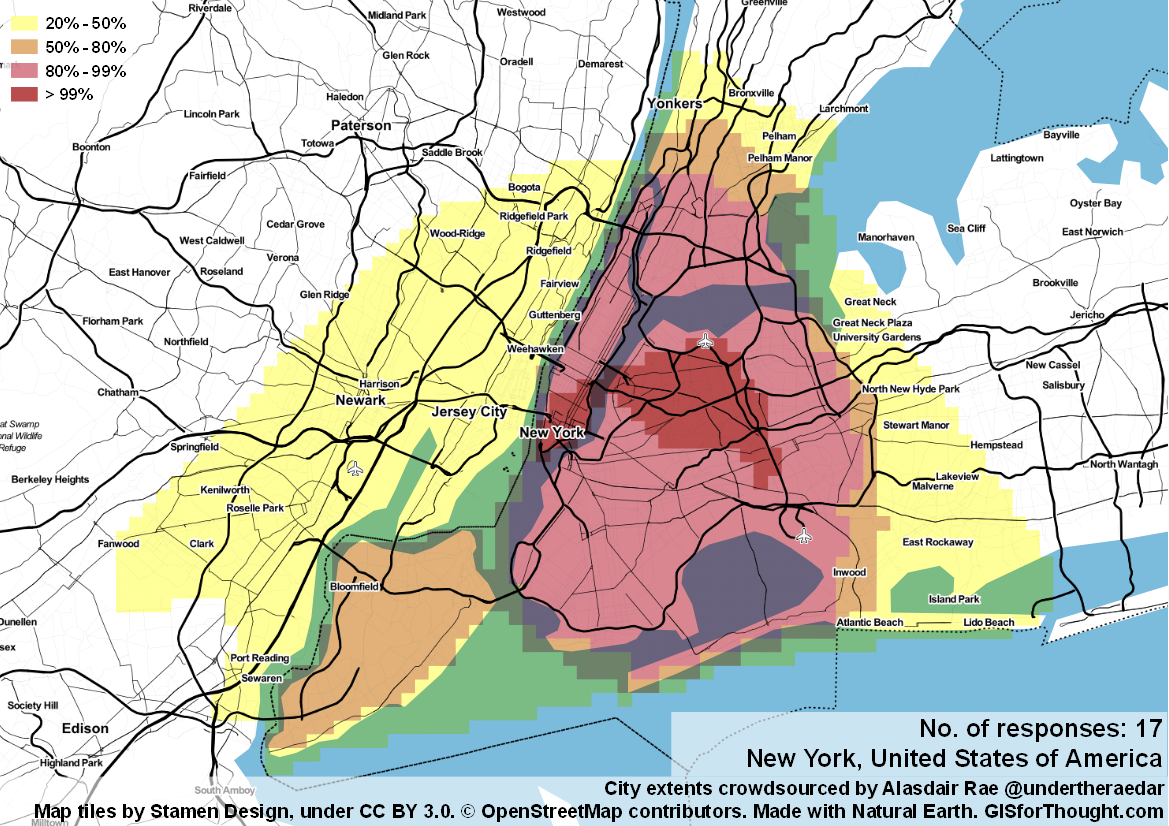
New York
Probably some selection bias, with crowd sourcing more popular in Brooklyn.
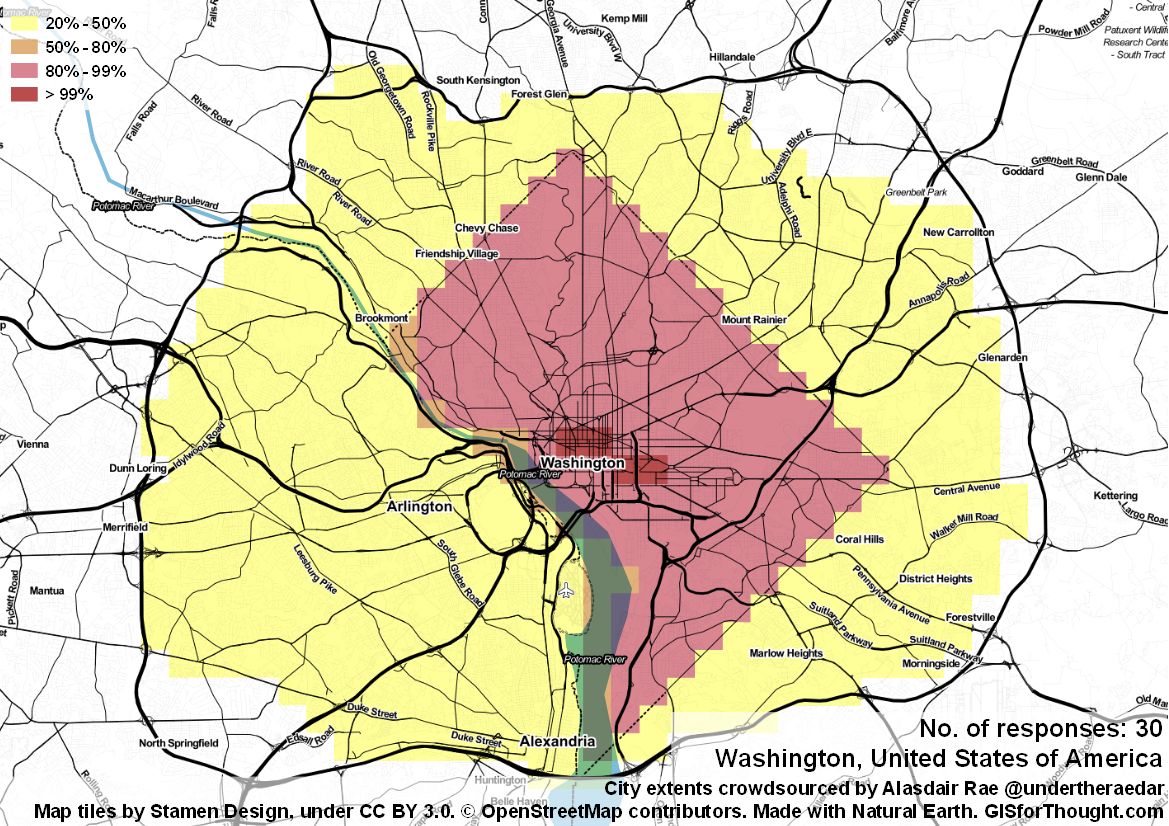
Washington
DC.