Scotland’s Cartographic Outline

This is a topic I have covered in the past as well: Scotland’s Changing Outline

But the 1654 Blaeu Atlas of Scotland was an influential cartographic masterpiece. The National Library of Scotland have covered it’s publication history very well: The history behind the publication of the Blaeu Atlas of Scotland.

When the sixth volume of Joannis Blaeu’s Atlas Novus was released in 1655, the maps of Scotland formed one eighth of the total maps in his world atlas. Making Scotland one of the best mapped countries of the seventeenth-century world.

The animations include the following maps from the National Library of Scotland:

Blaeu Compared to Modern Day Outline from OpenStreetMap

Cycling Through the Maps by Publication Date

Blaeu – 1654
Sanson – 1665
Morden – 1687
Moll – 1714
Elphinstone – 1745
Dorret – 1751
Modern
Blaeu – 1654

Comparison to Modern Day In Between

Blaeu – 1654
Modern
Sanson – 1665
Modern
Morden – 1687
Modern
Moll – 1714
Modern
Elphinstone – 1745
Modern
Dorret – 1751
Modern
Blaeu – 1654

Comparison to Blaeu

Blaeu – 1654
Sanson – 1665
Blaeu – 1654
Morden – 1687
Blaeu – 1654
Moll – 1714
Blaeu – 1654
Elphinstone – 1745
Blaeu – 1654
Dorret – 1751
Blaeu – 1654

Overlaid

From: Scotland’s Changing Outline

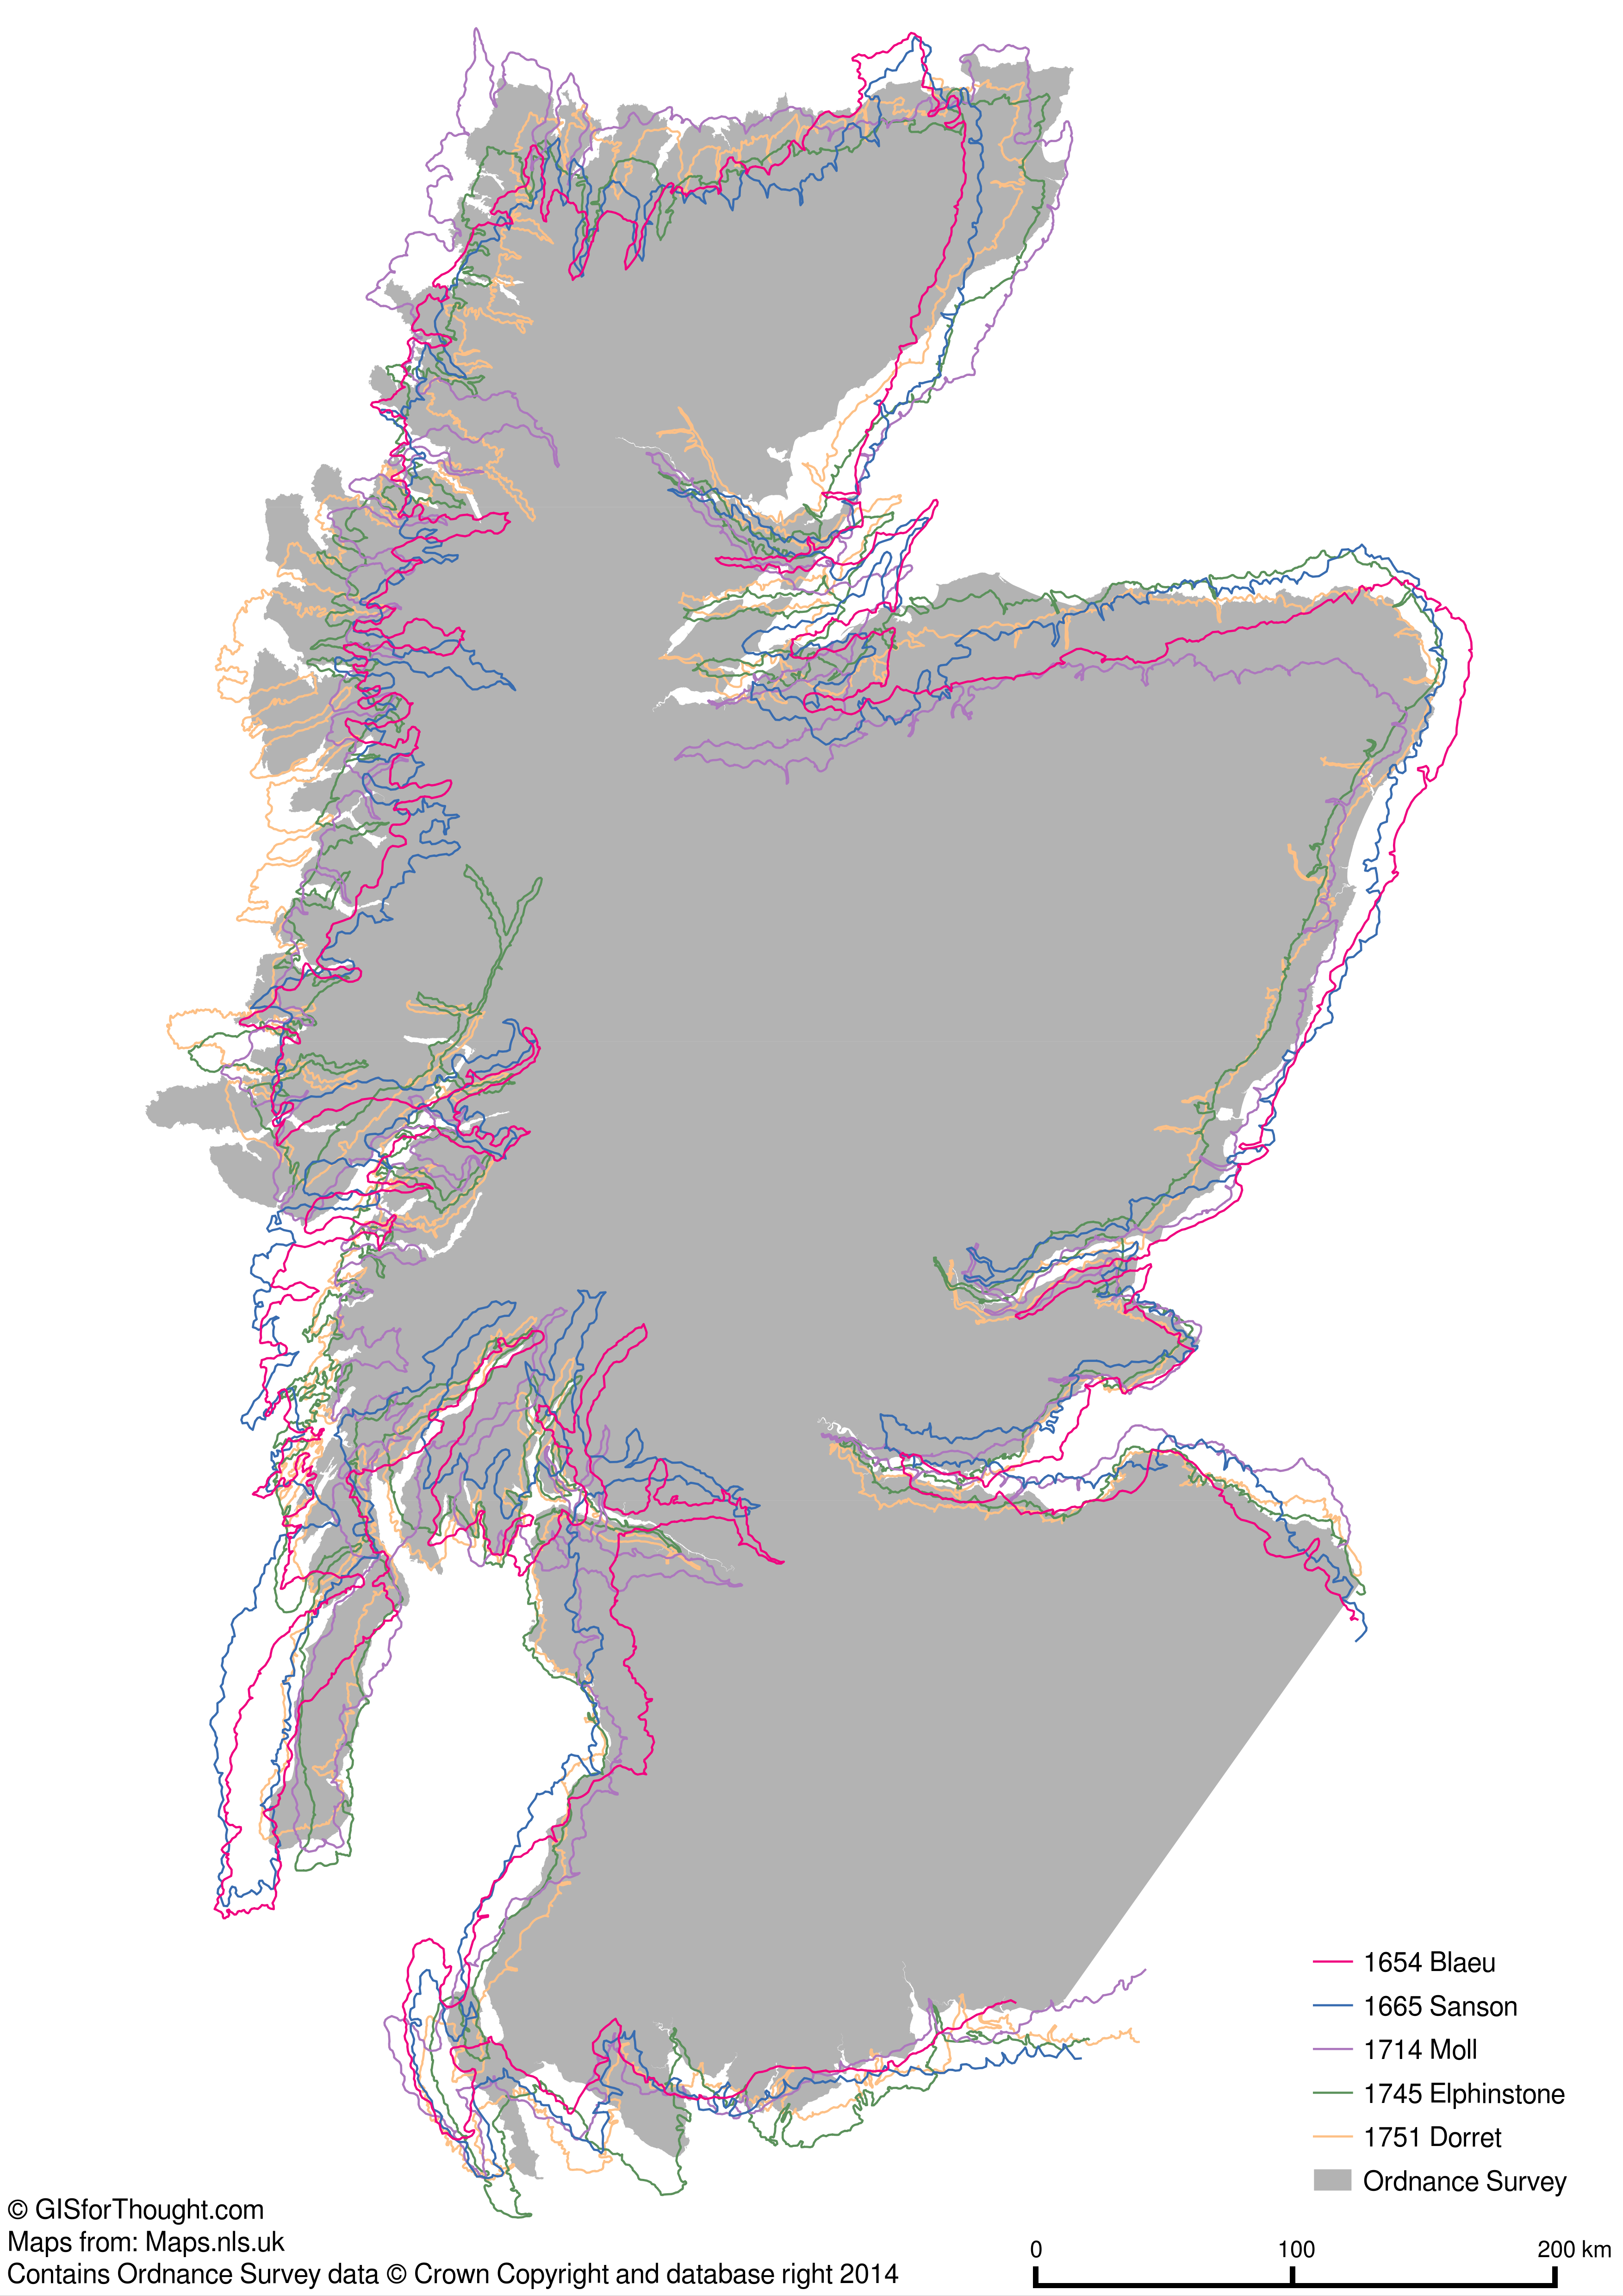
Read about the maps here: Historic Maps of Scotland from Blaeu to Dorret (1600-1700)

Merch

There is also a t-shirt with all of the outlines overlaid, if you are a fan of Scottish cartographic history.

30 Day Map Challenge 2021

This November I once again took part in the 30 Day Map Challenge started by Topi Tjukanov.

Categories

I had done it the first year (30 Day Map Challenge 2019), and had made a few maps for 2020 as well.

This year I wasn’t really sure I would take part, as I had no plans and nothing prepared. But it is a great challenge. It challenges your creativity, problem solving, and map making skills. It also sets a time limit so you don’t have to worry about being perfect. And making maps is good fun.

There were a few datasets that I had come across that I thought would be good subjects, and I got a lot of mileage out of them.

Dublin neighbourhoods

These included the Dublin Inquirer neighbourhood survey.

Will You Draw Your Dublin Neighbourhood for Us?

neighbourhoods.dublininquirer.com

I think this is a great initiative, and hopefully they get a real large set of responses. They are at over 2000 already so a great start.

I did something similar for Glasgow (here) but only got 367 responses in total. So the power of having a well read paper behind the initiative is great. They are also reaching out to areas that have not had many responses, which is really great work.

OpenStreetMap

I also wanted to do some maps around OpenStreetMap in Ireland. The community here has had a large push to map all of the buildings in Ireland, which has progressed well.

But it is very much a work in progress.

OSM Ireland Buildings poster from State Of The Map 2021

Selected Maps

Hexagons:

Hex

First of the Dublin boundaries series.

Final interactive version: Here

OpenStreetMap:

OpenStreetMap

For OSM day I wanted to try and make the data a bit easier to use for #QGIS novices.

I created styles that can be applied to the GEOFABRIK Shapefile extracts, from here.

The styles are available: https://github.com/HeikkiVesanto/QGIS_OSM_Styles

Red:

Red

Mac vs Mc.

Supermac’s is an Irish fast food restaurant chain, who have had a few trademark disputes over the years with McDonald’s over the use of Mc and Mac in burger names.

3D:

3D

This turned out a lot better than I expected.

Was pure QGIS. Create grid (5km x 5km), zonal statistics on CORINE (Majority) and DEM (Median). New field for height rounded up to the nearest 40:

to_int(ceil((“_h_median” / 40))) * 40

Set colors. Create centroids with same colors. These become the Lego nubs.

Rendered in QGIS2threejs plugin. The grid is extruded, with a height of height * 50. The centroids are cylinder rendered height * 50 + 30 * 50, so they come a bit higher, radius of 1800.

The “rayshader” export makes it look realistic.

Interactive: https://maps.gisforthought.com/LegoIreland/

Might be better to not use landuse, but elevation for the colours.

No Computer:

No Computer

Nice to get away from the computer. Definitely promotes some creativity. But I just took it as an opportunity to walk on the beach.

Land:

Land

My favourite of my maps.

Land use vineyard across Europe from CORINE 2020, with the major regions labelled.

GHSL:

GHSL

Seasonal population of the Balearic Islands.

Data clipping in QGIS/GDAL, rendered in Aerialod, with labels with GIMP afterwards.

This was my second favourite of my maps. I think the topic is interesting and the execution is pretty good. Was however quite manual and probably needed more exaggeration to see the differences.

Historical:

Historical

A time lapse of 1,831,044 buildings in Ireland being added to OpenStreetMap.

If you want to get involved see: OpenStreetMap Ireland Buildings

Globe:

Globe

Simple spinning globe in QGIS, but I was happy that I was able to automate the export: Gist

All maps:

See here