Neighborhood boundaries are a fascinating topic. Where do people see their neighborhood extending to, how clear are those boundaries, and how do they shift with time.
This is a topic that has been tackled a number of times around the world, and with different types of locations (like cities). With the general public asked to draw their own neighborhood, or the ones they are familiar with, on a map. But there are challenges.
Sometimes the results are successful, like in Boston. Boston only has around 60 neighborhoods, which are relatively clearly defined based on the mapping results. And Bostonography clearly had a great readership, with over 2300 responses.
Older cities, like Glasgow are much more complex. In 2016 I did a similar survey, and from 367 responses I received 241 unique neighborhoods. You would need a much bigger set of responses to come to any real conclusions. But I still mapped the results for the West End of Glasgow, where most neighborhoods had multiple responses: Glasgow Regions Mapped
The challenges for Dublin neighborhoods is similar to Glasgow, although not as complex. But anything worth doing would require a lot of responses.
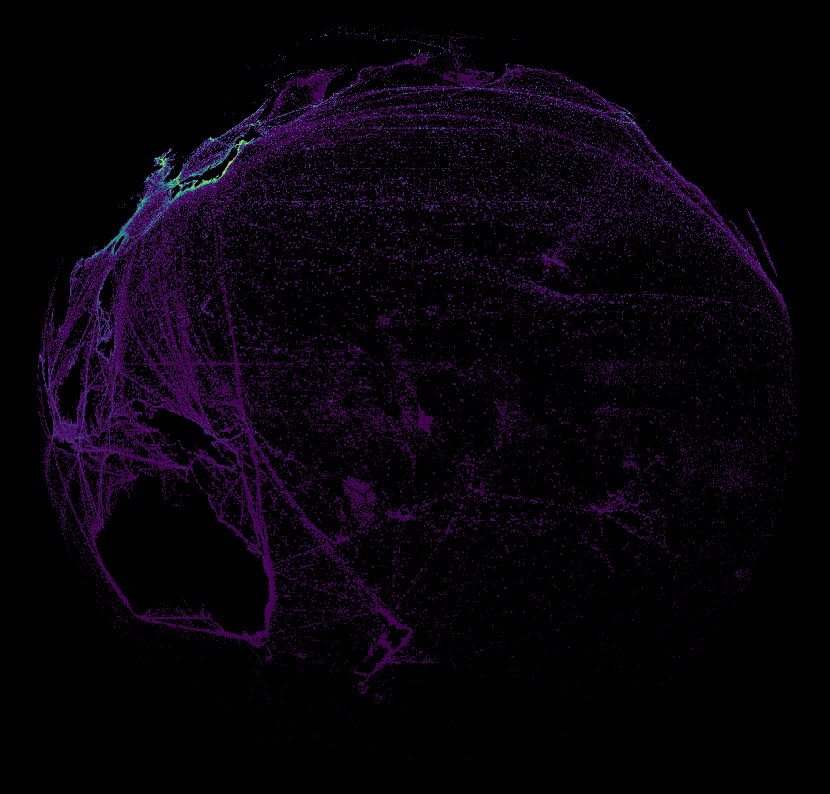
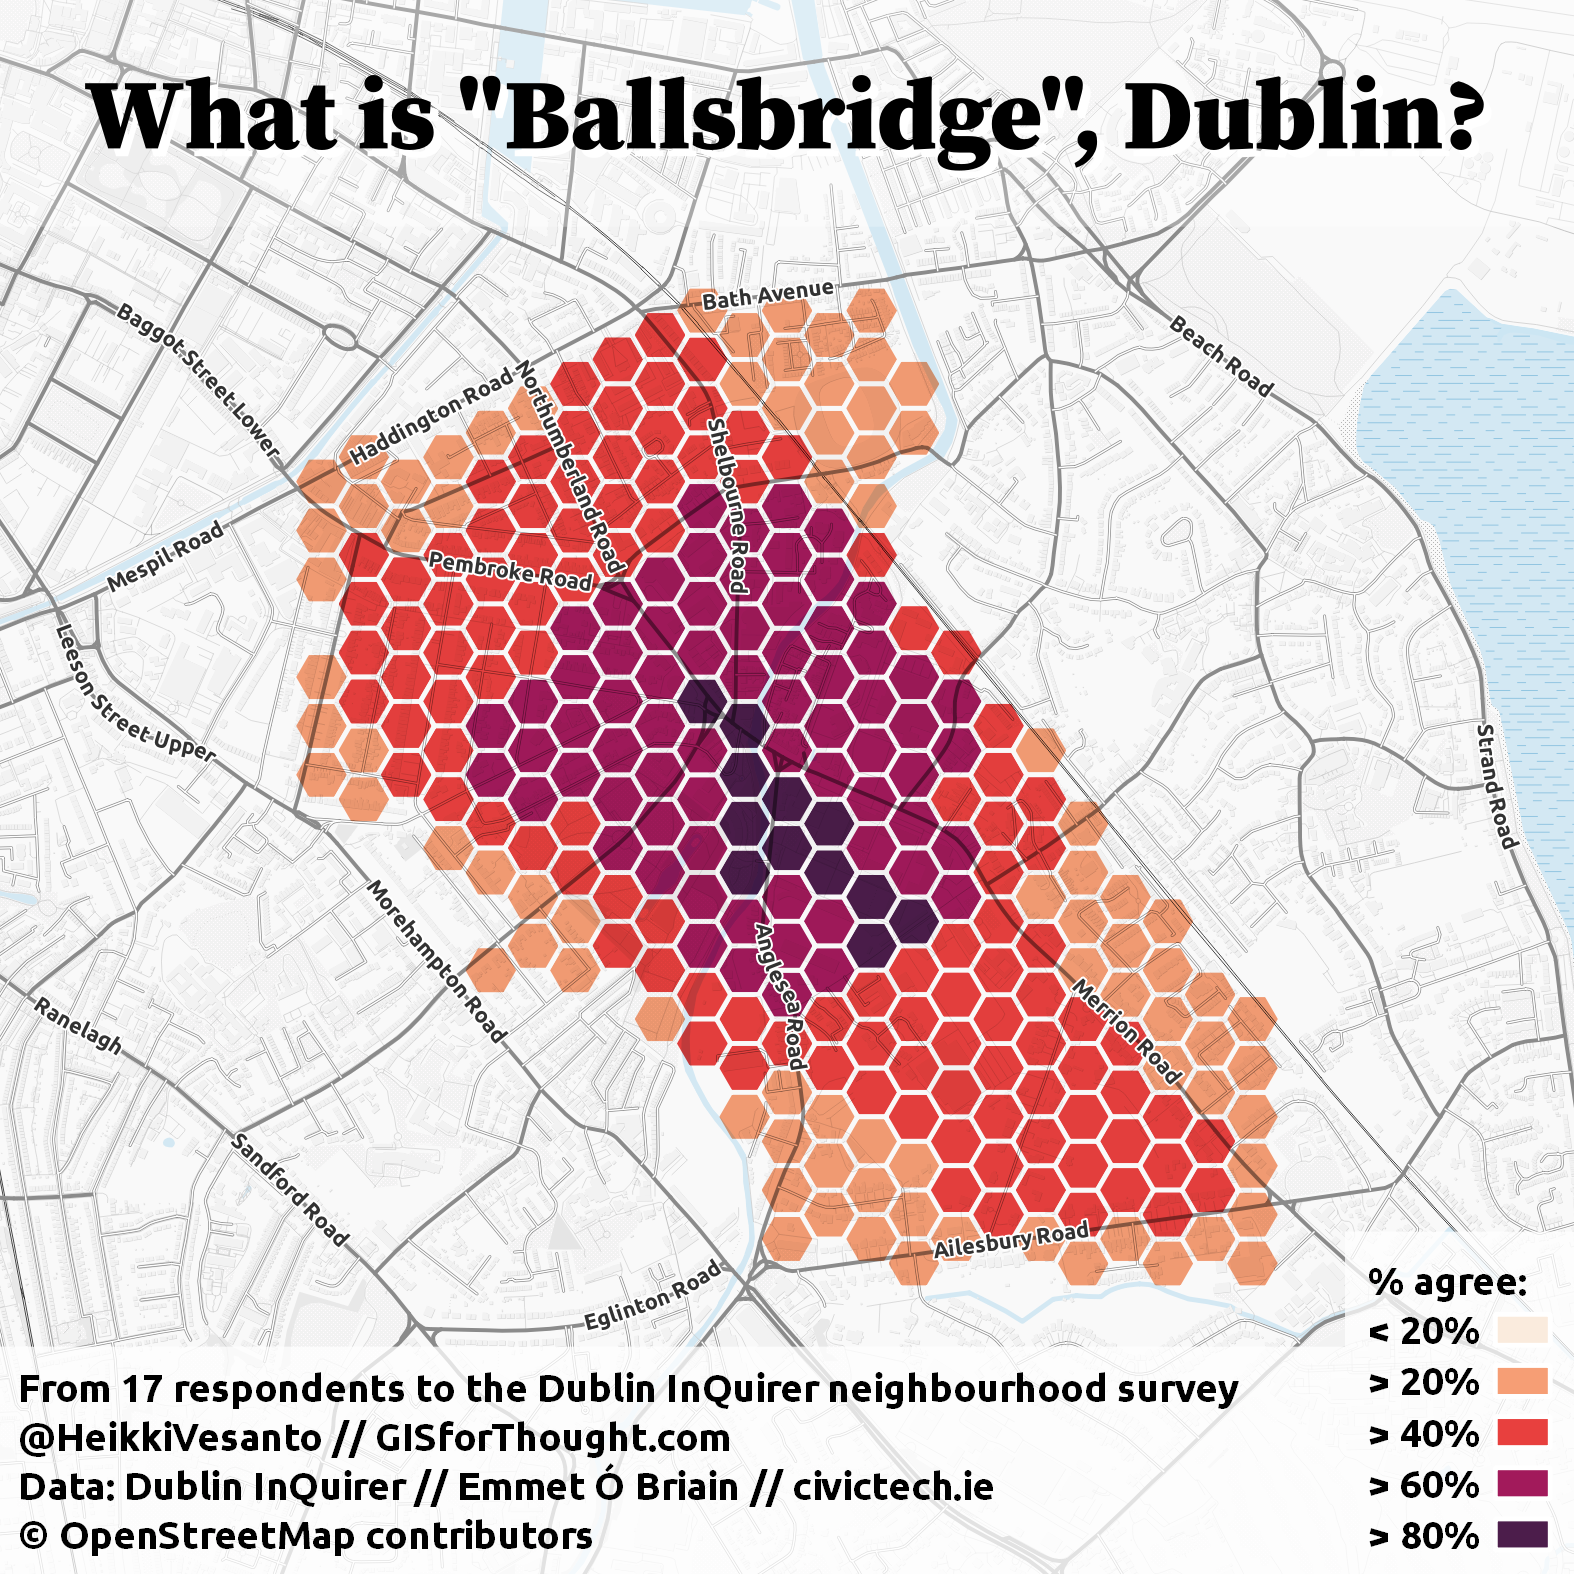
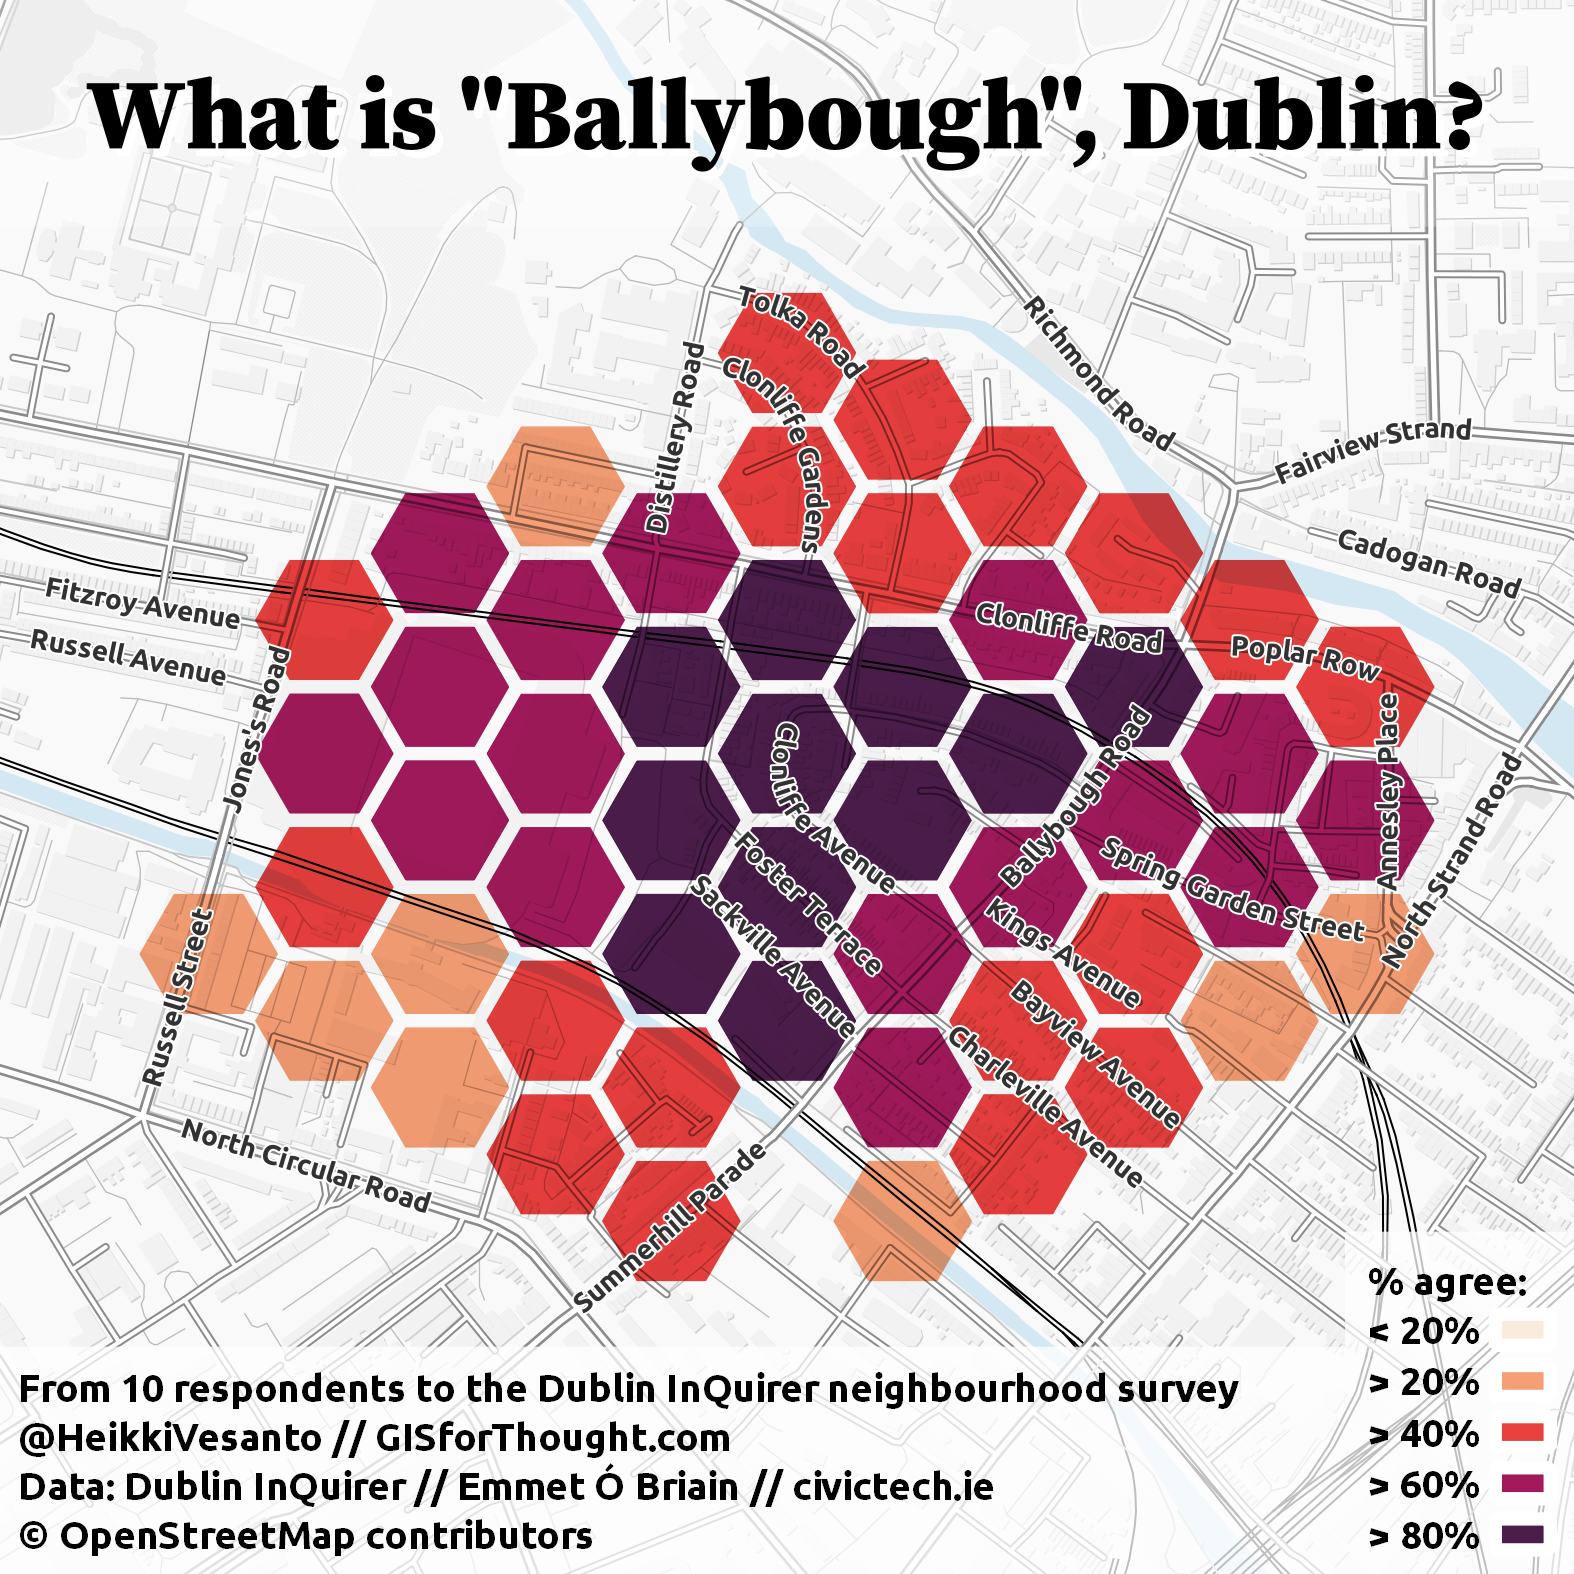
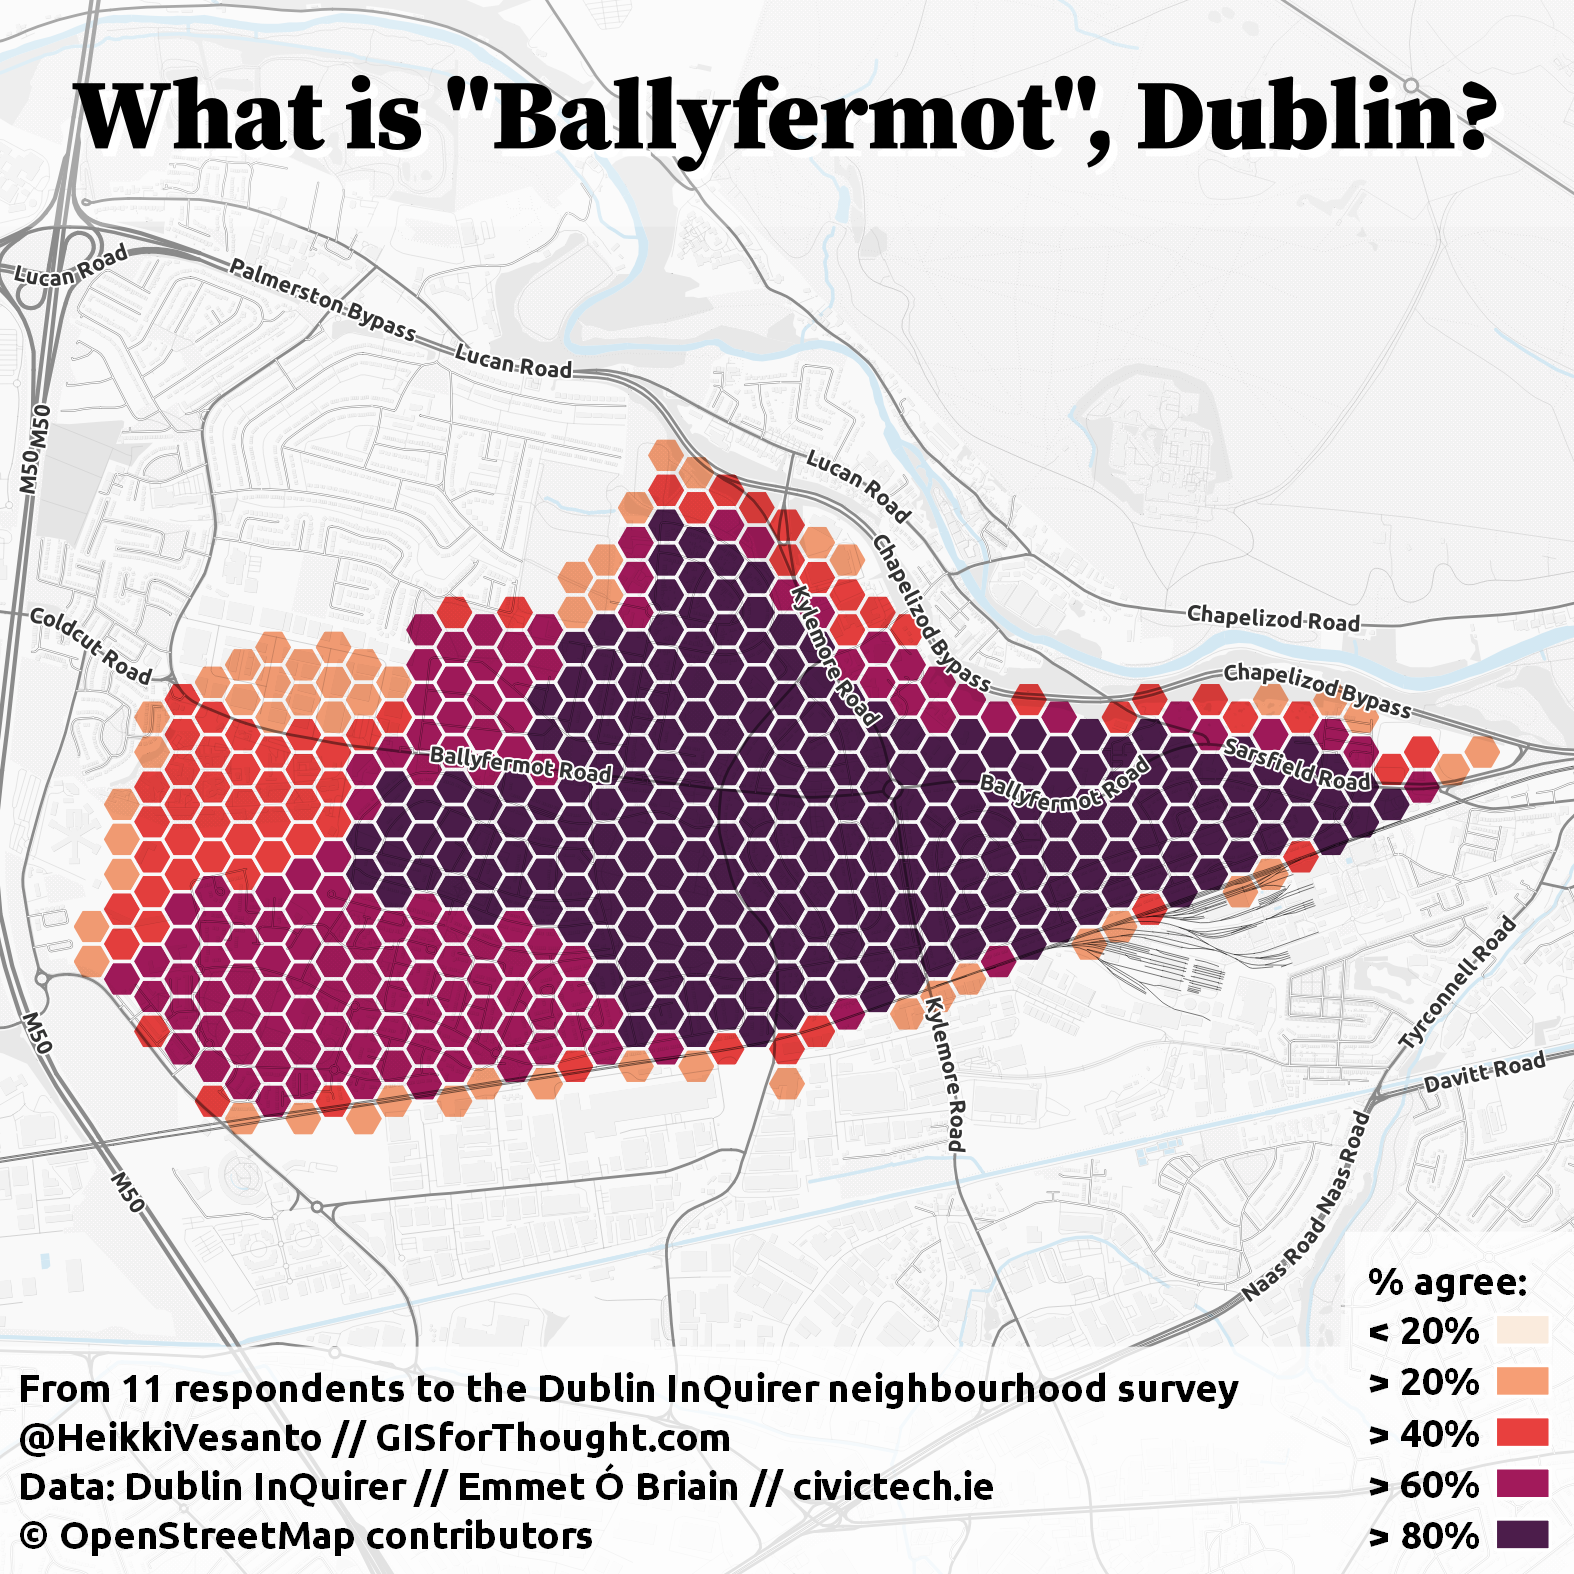
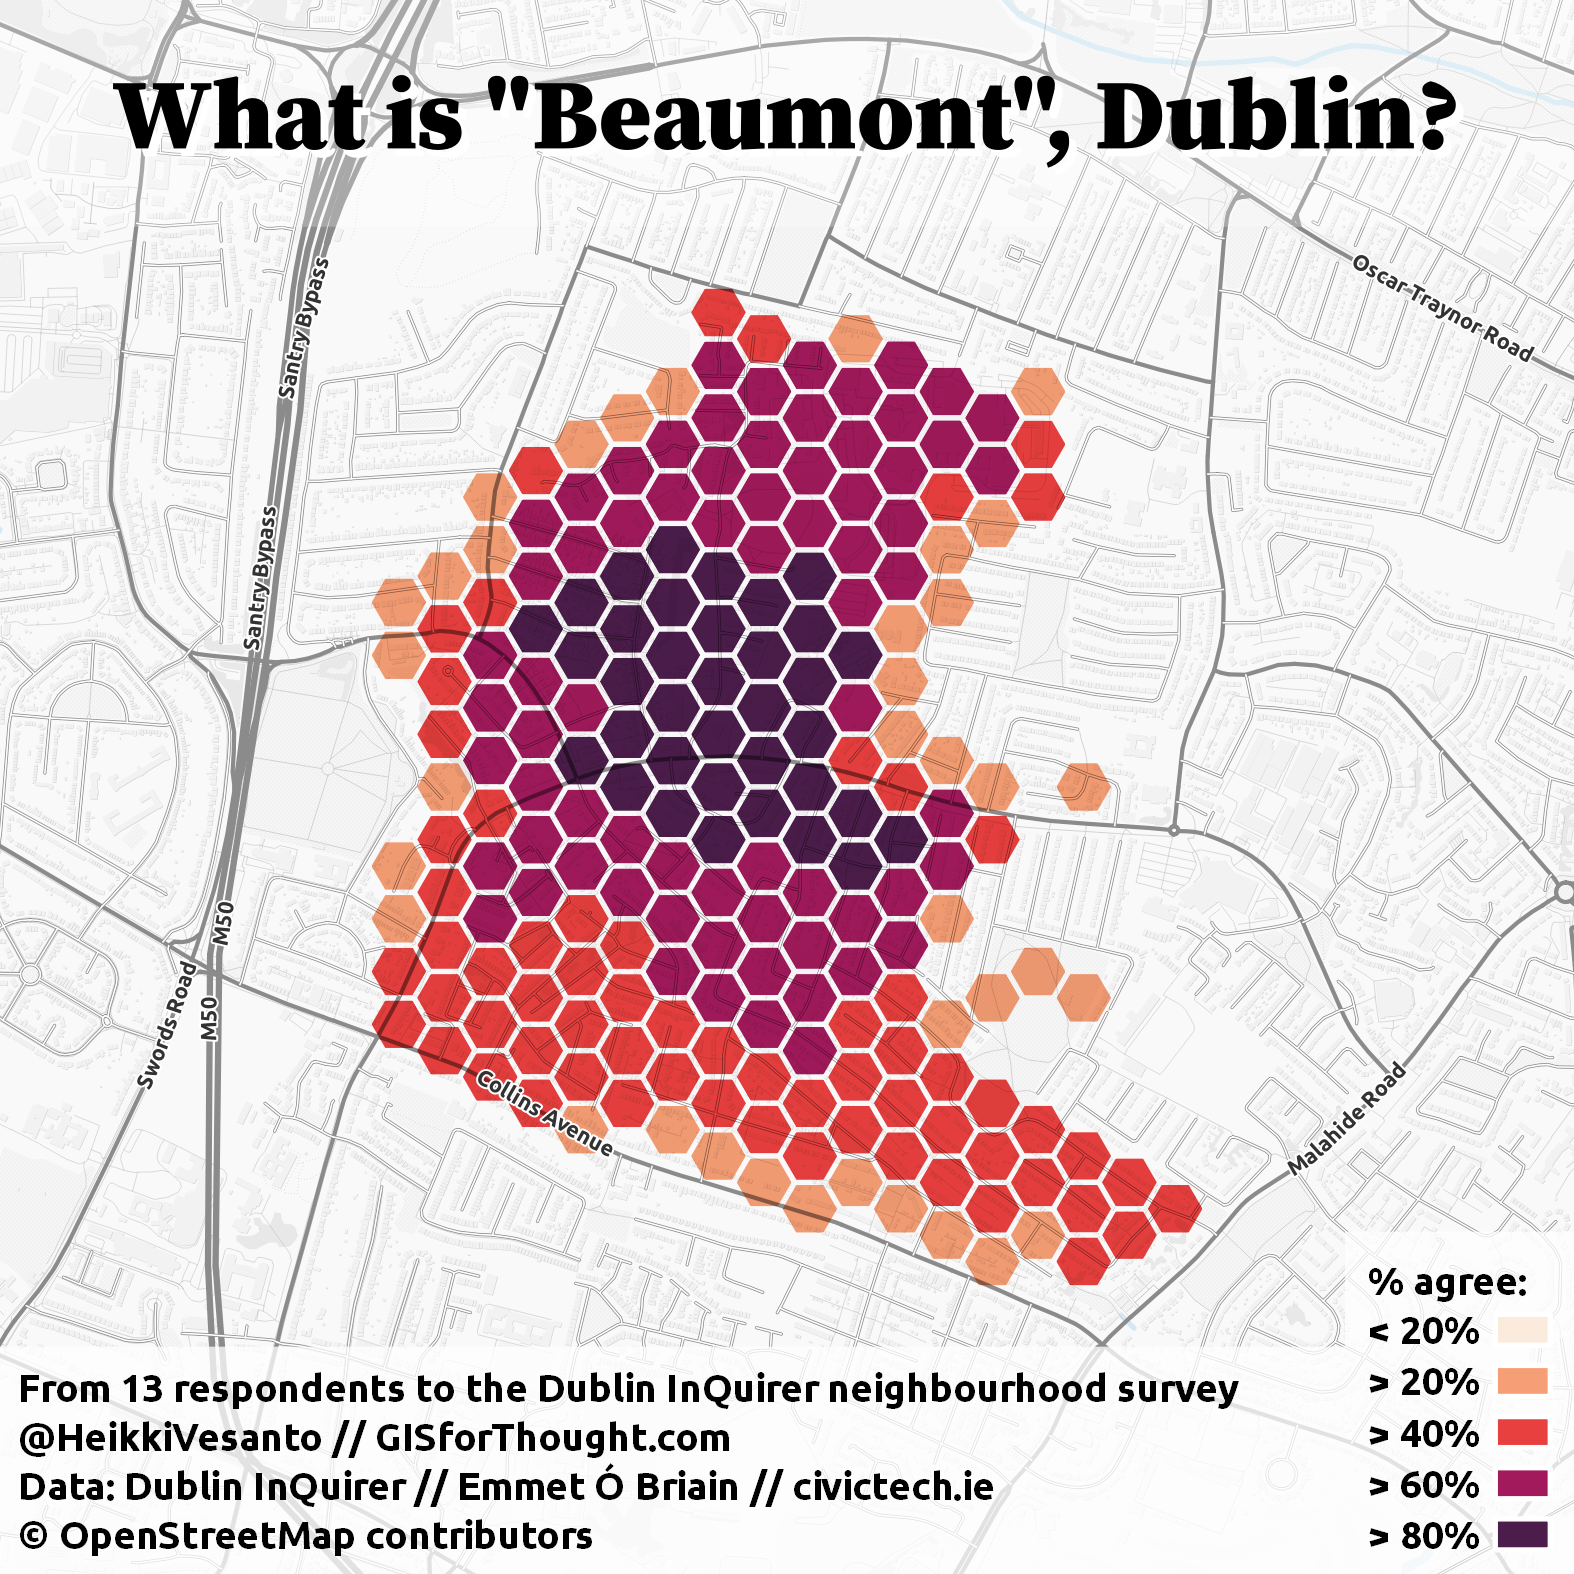
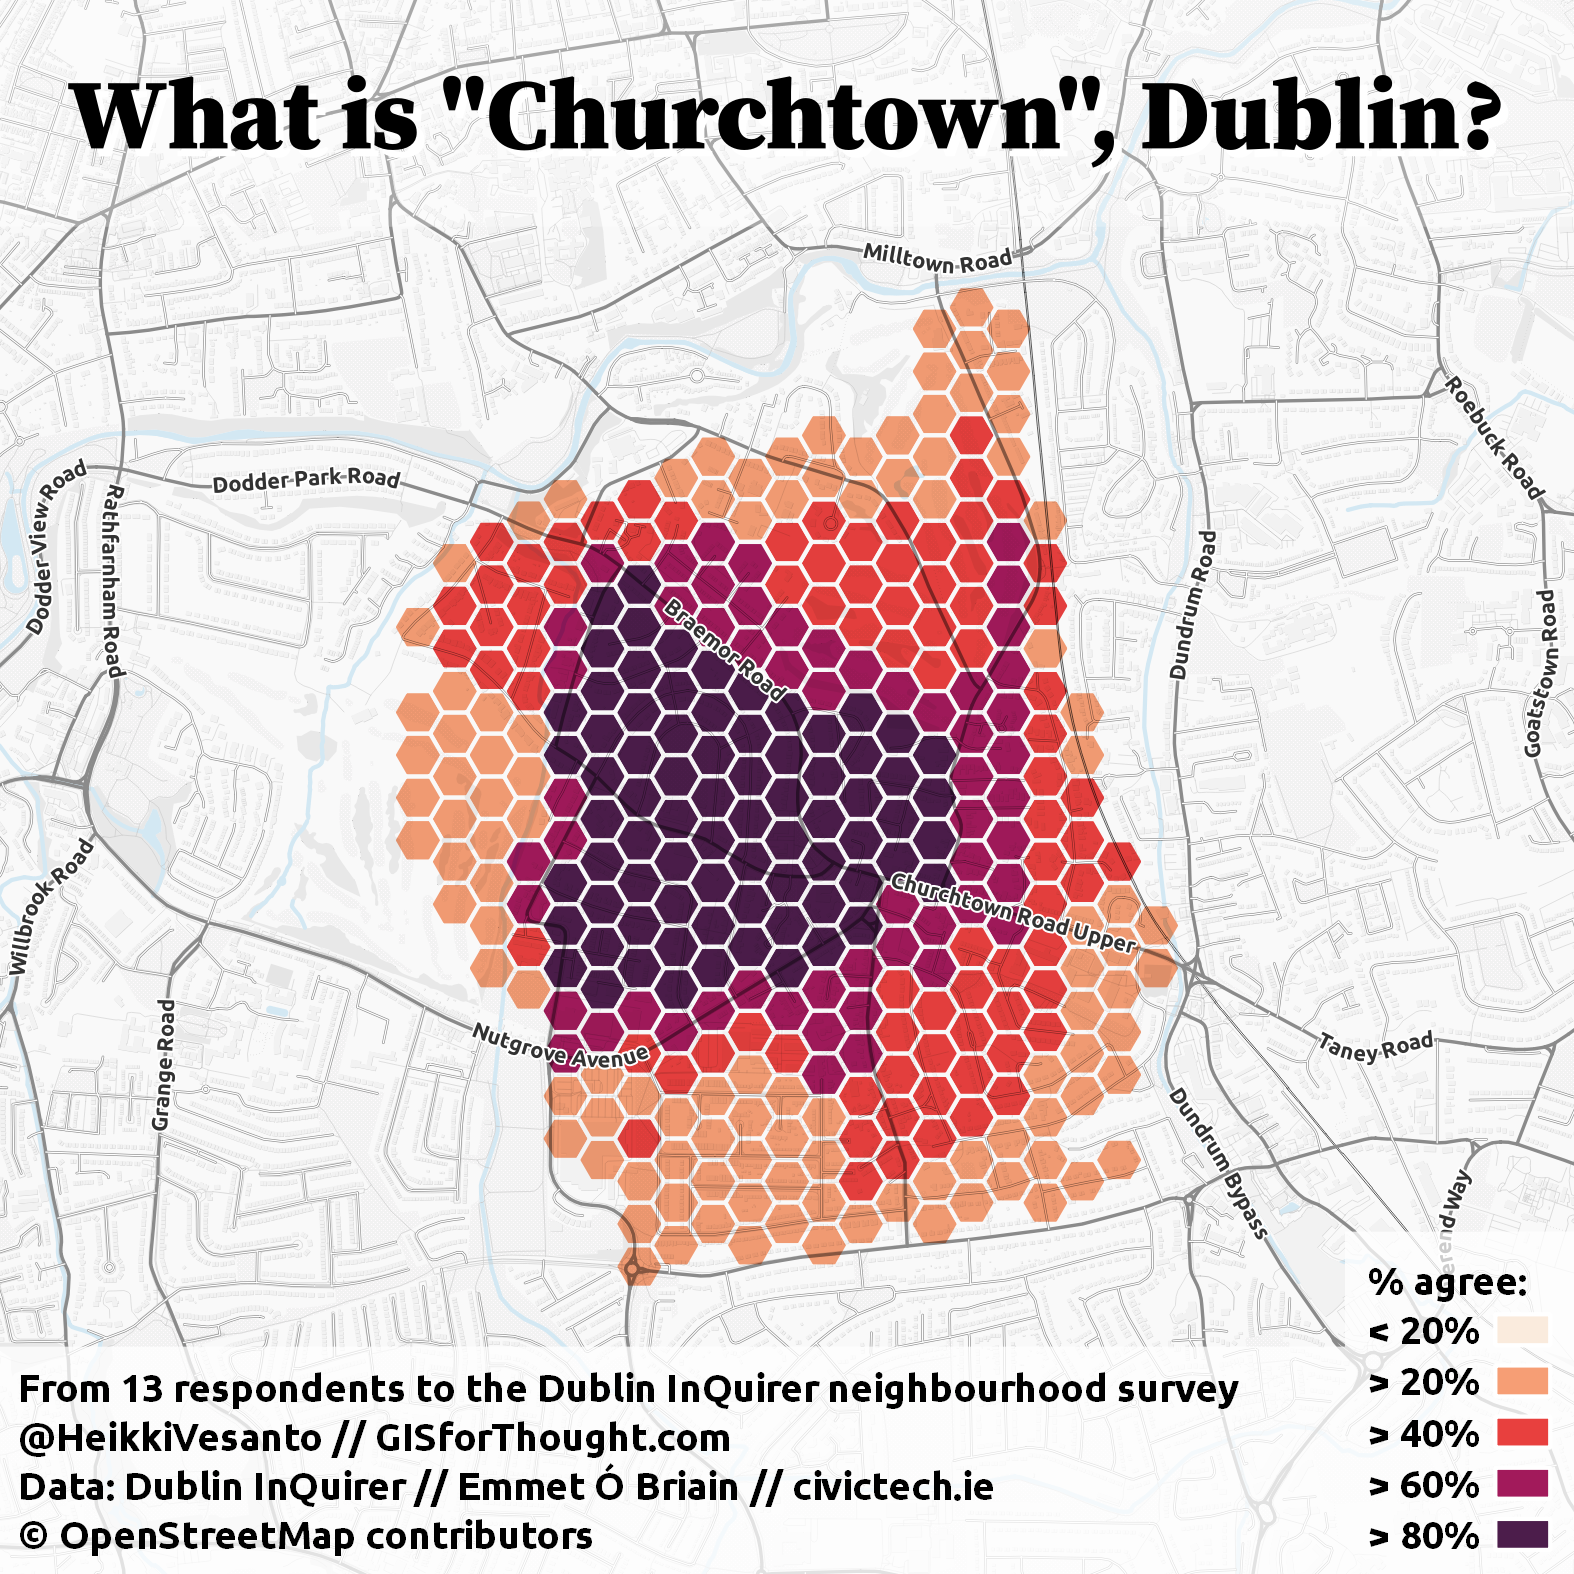
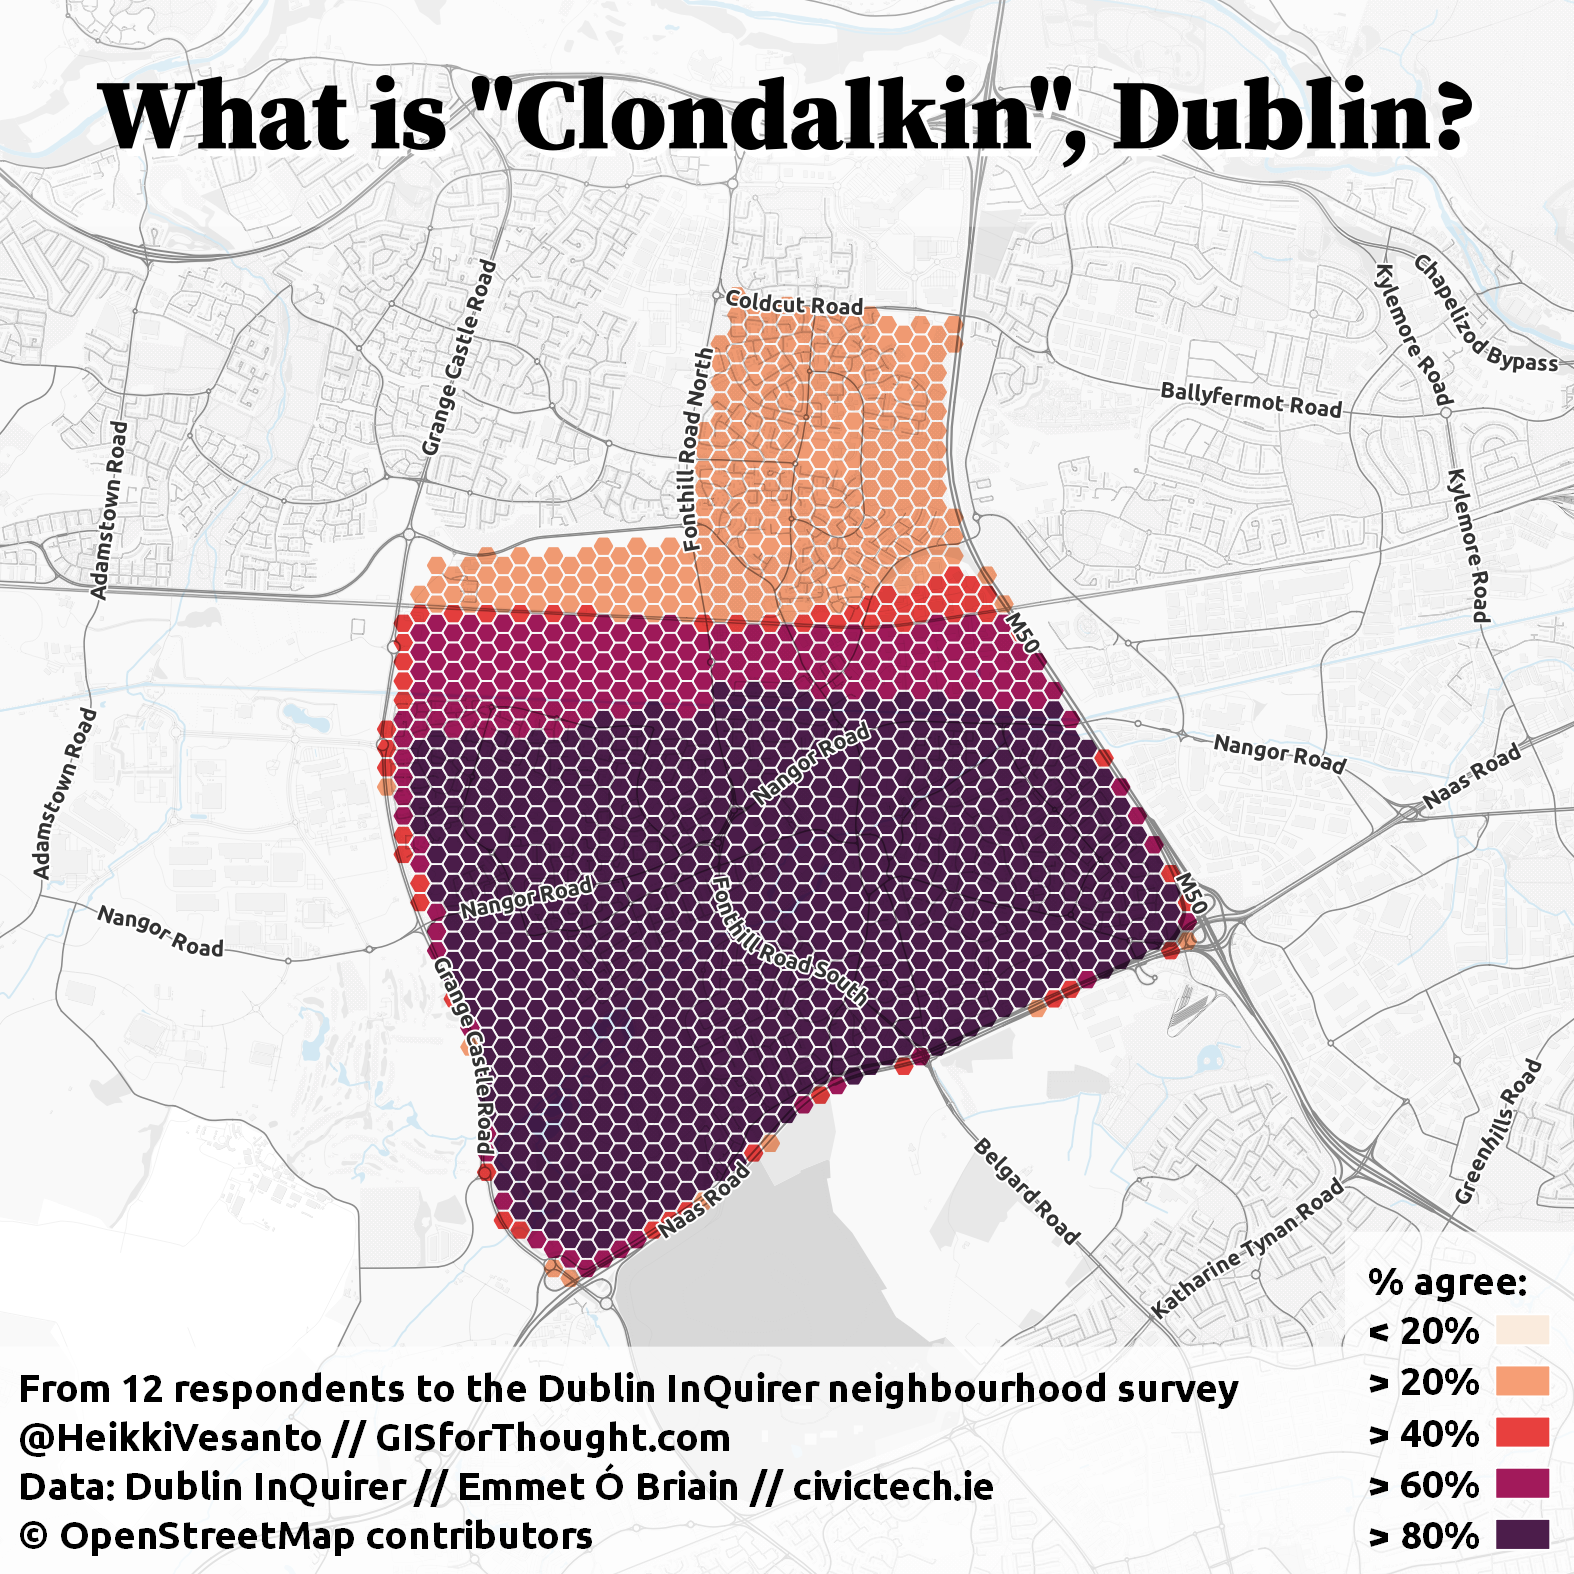
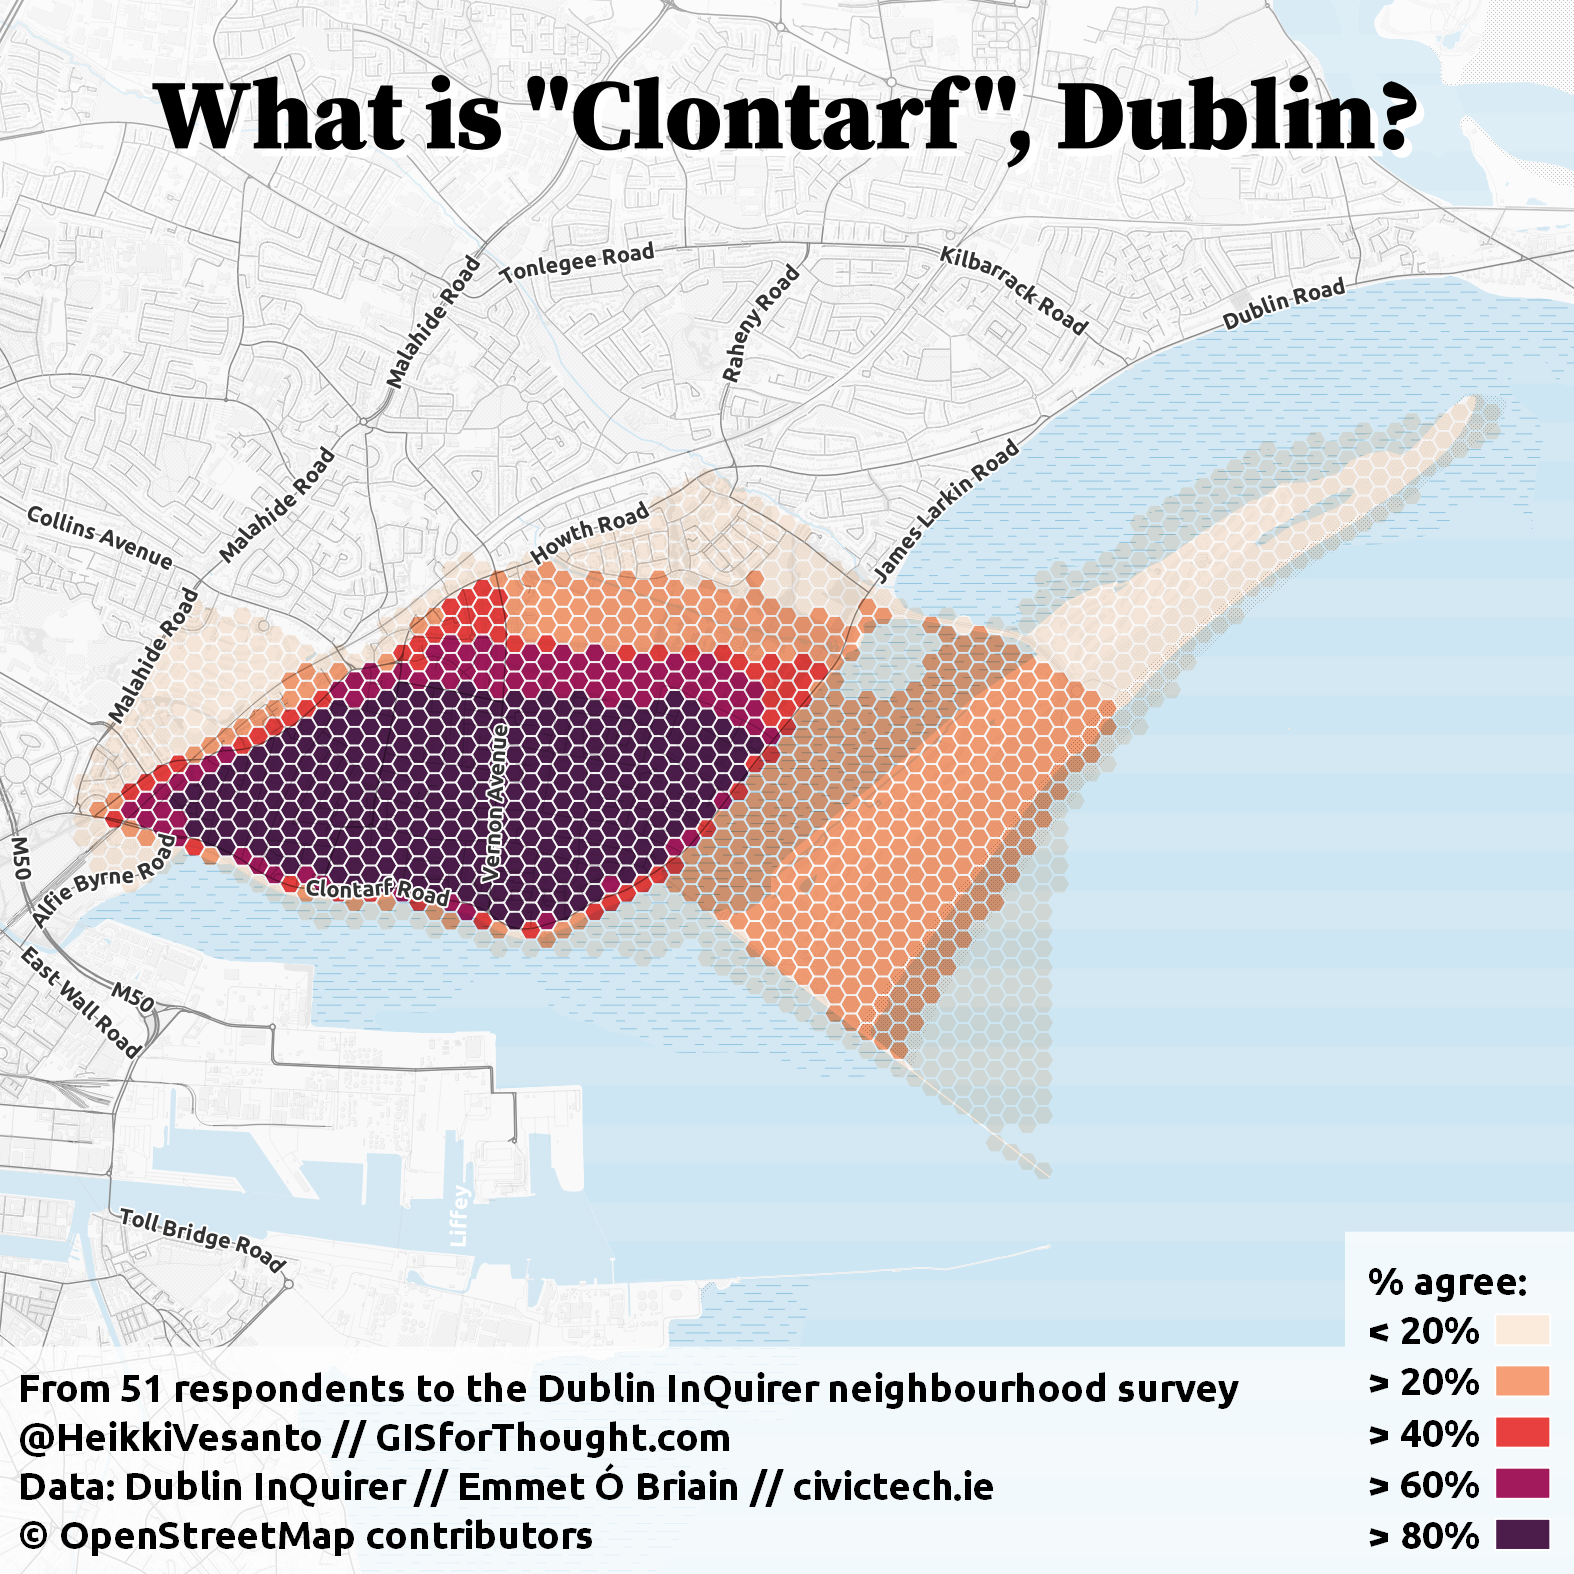
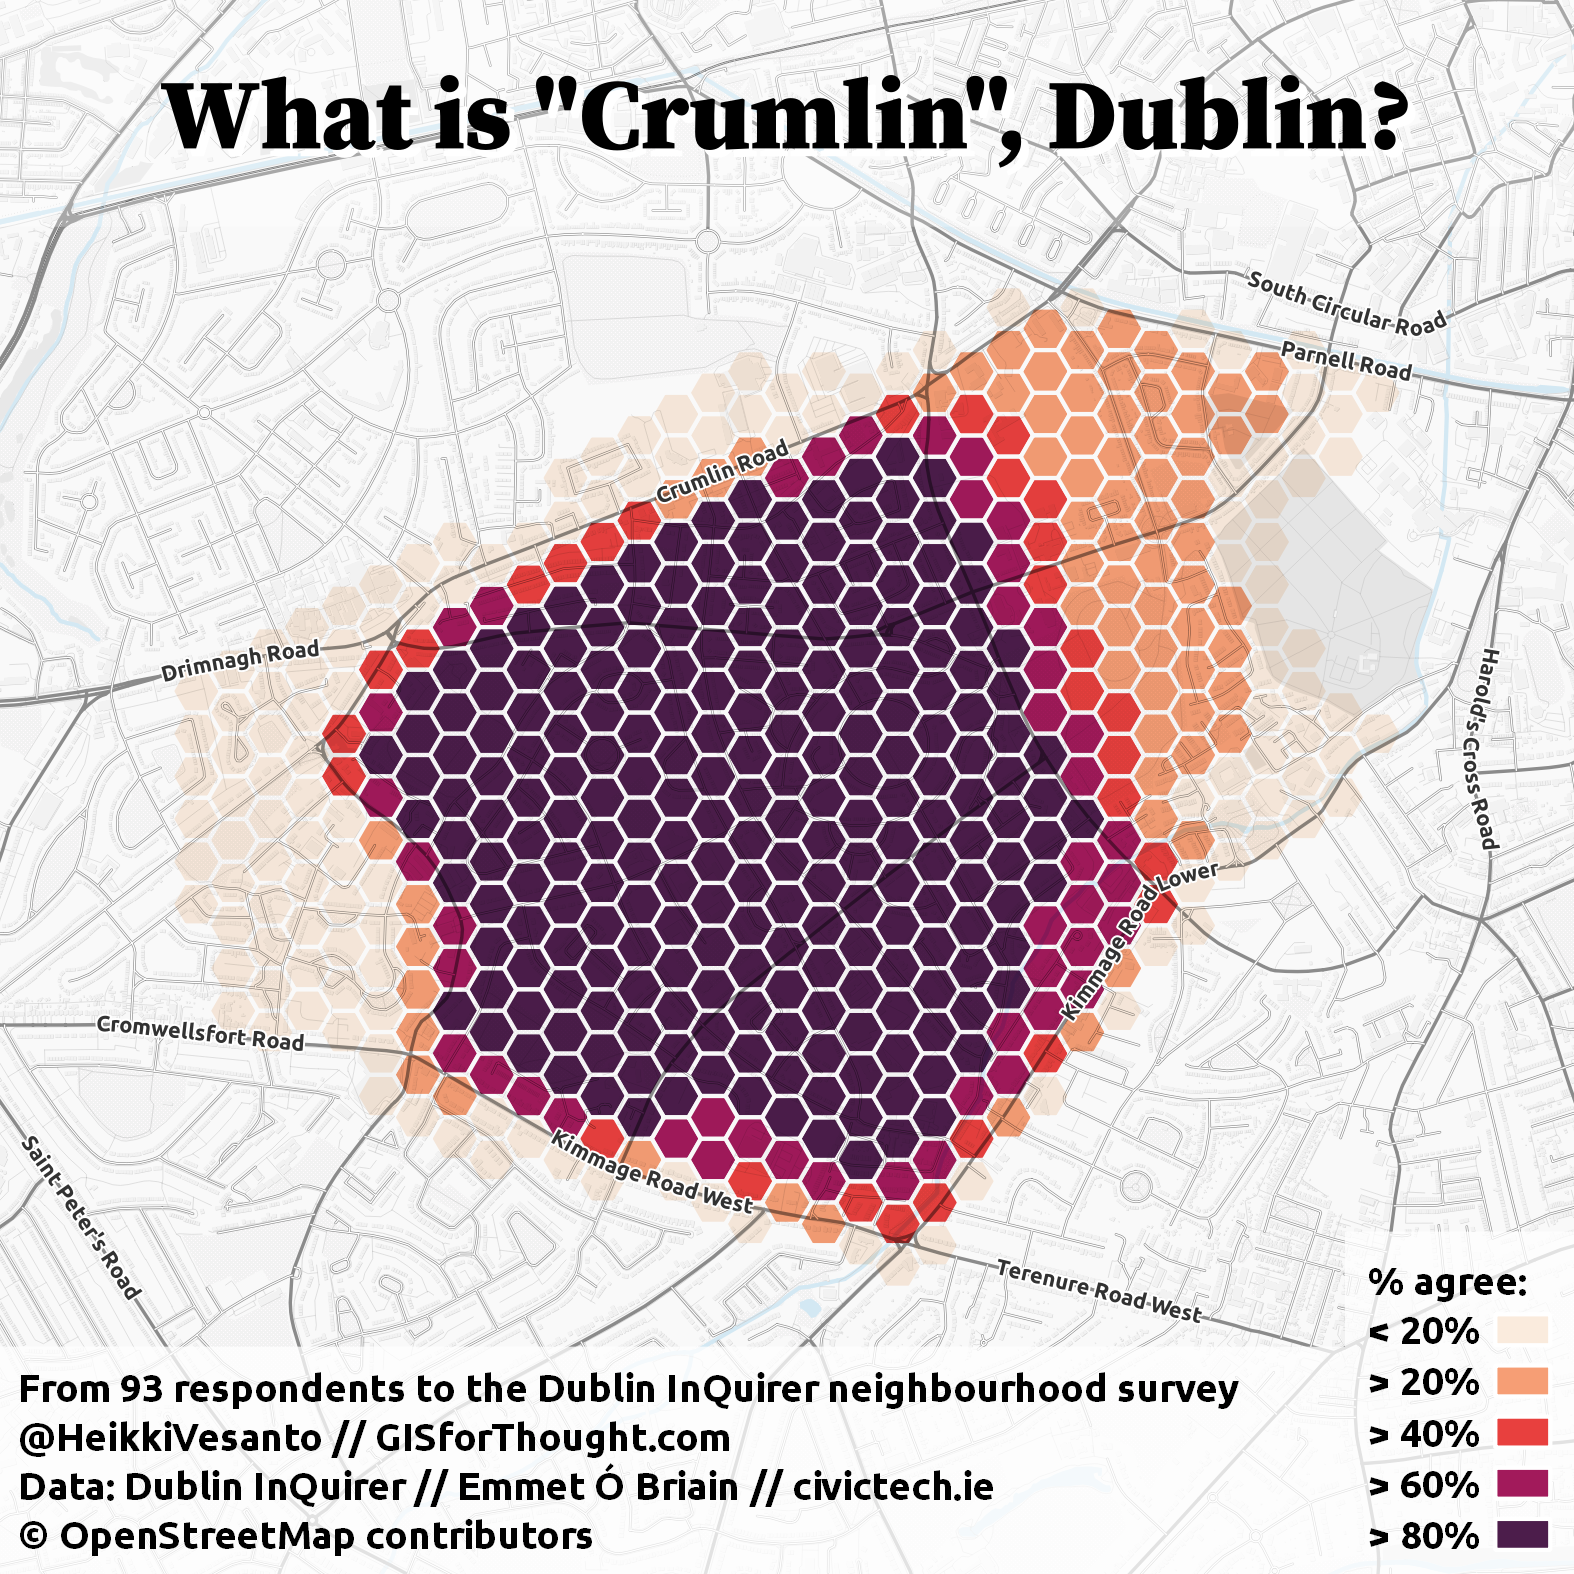
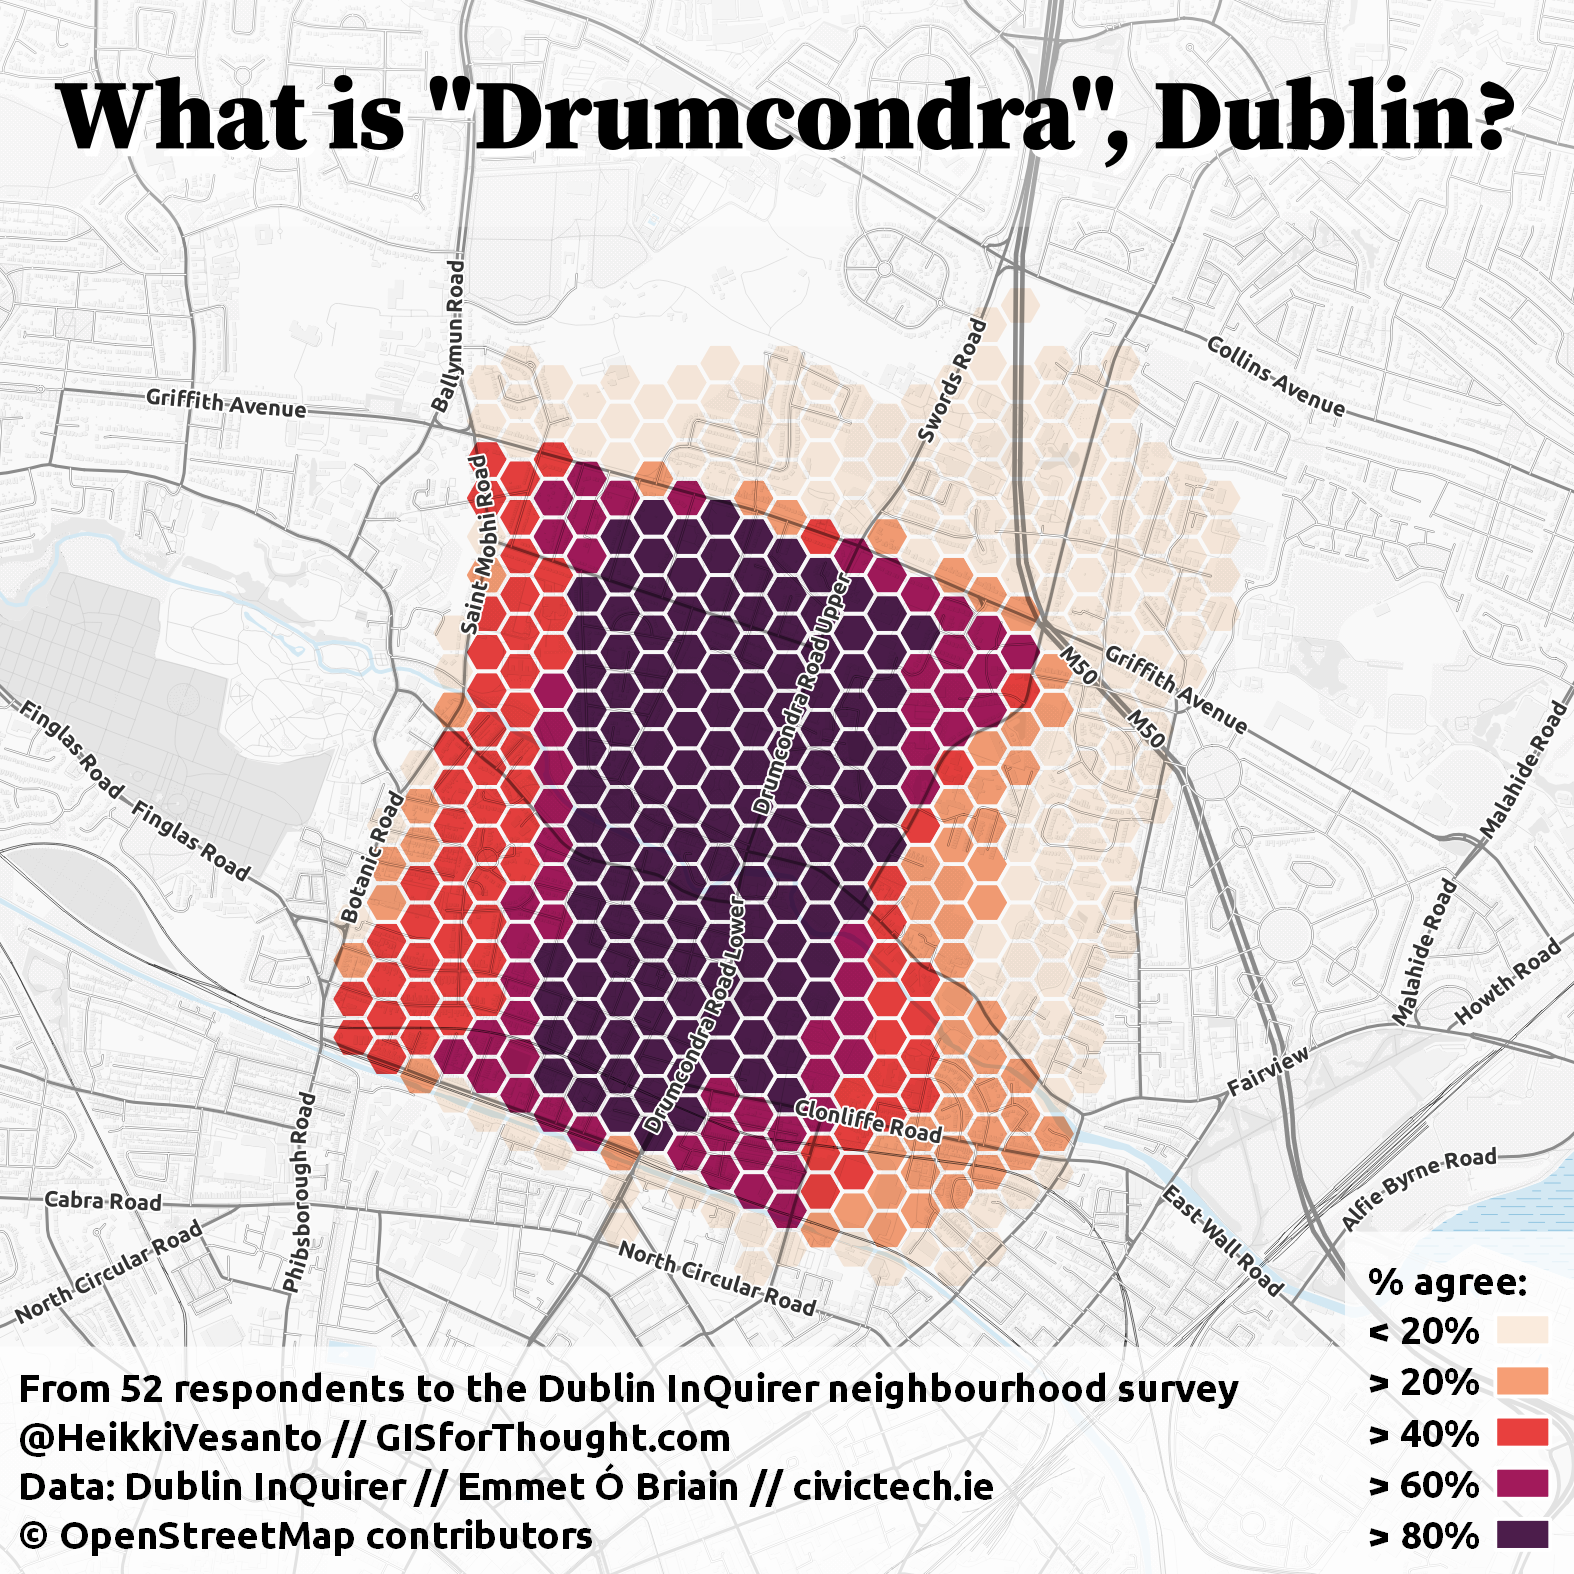
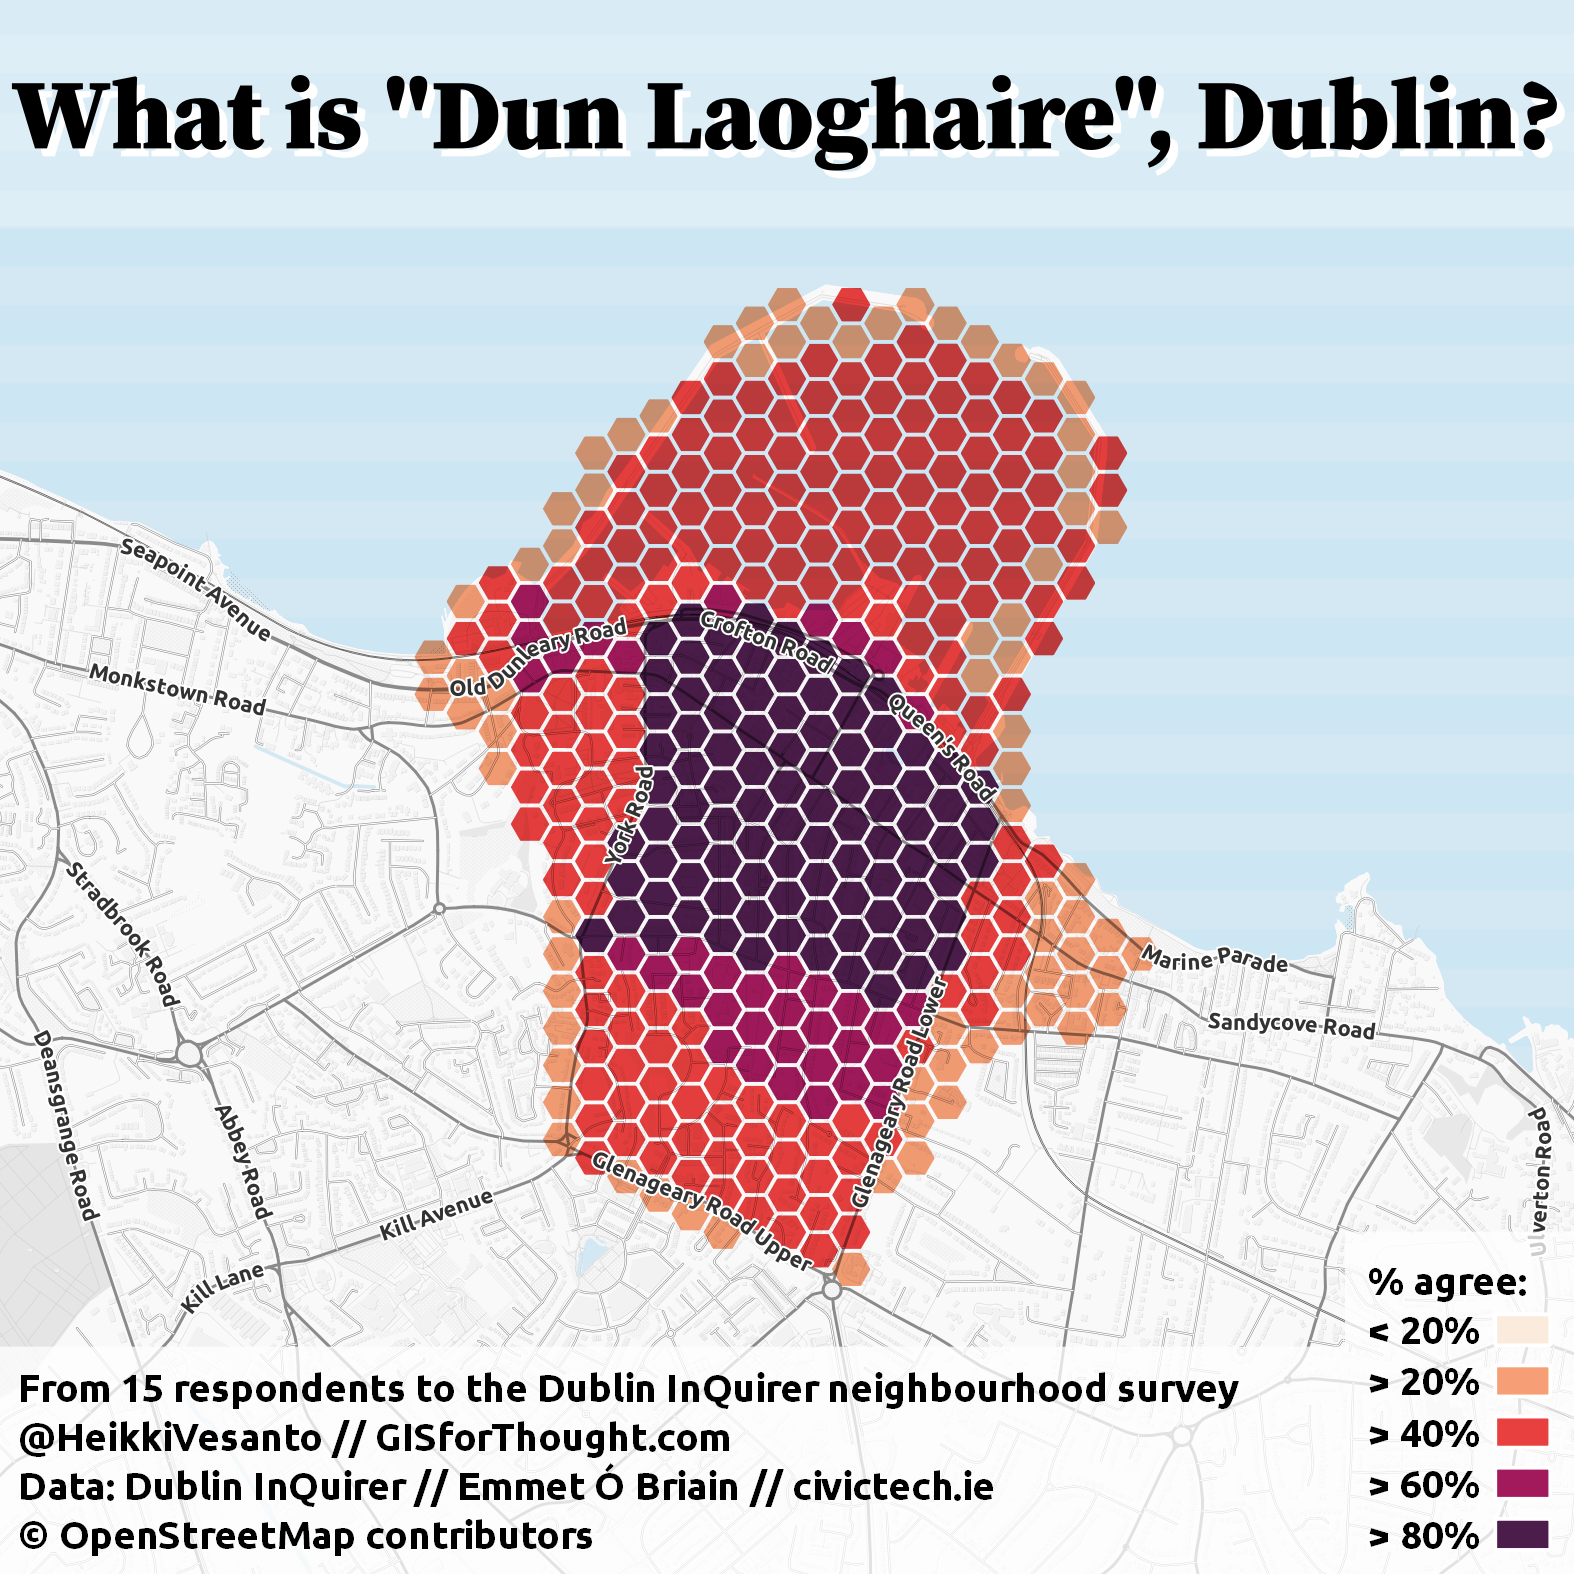
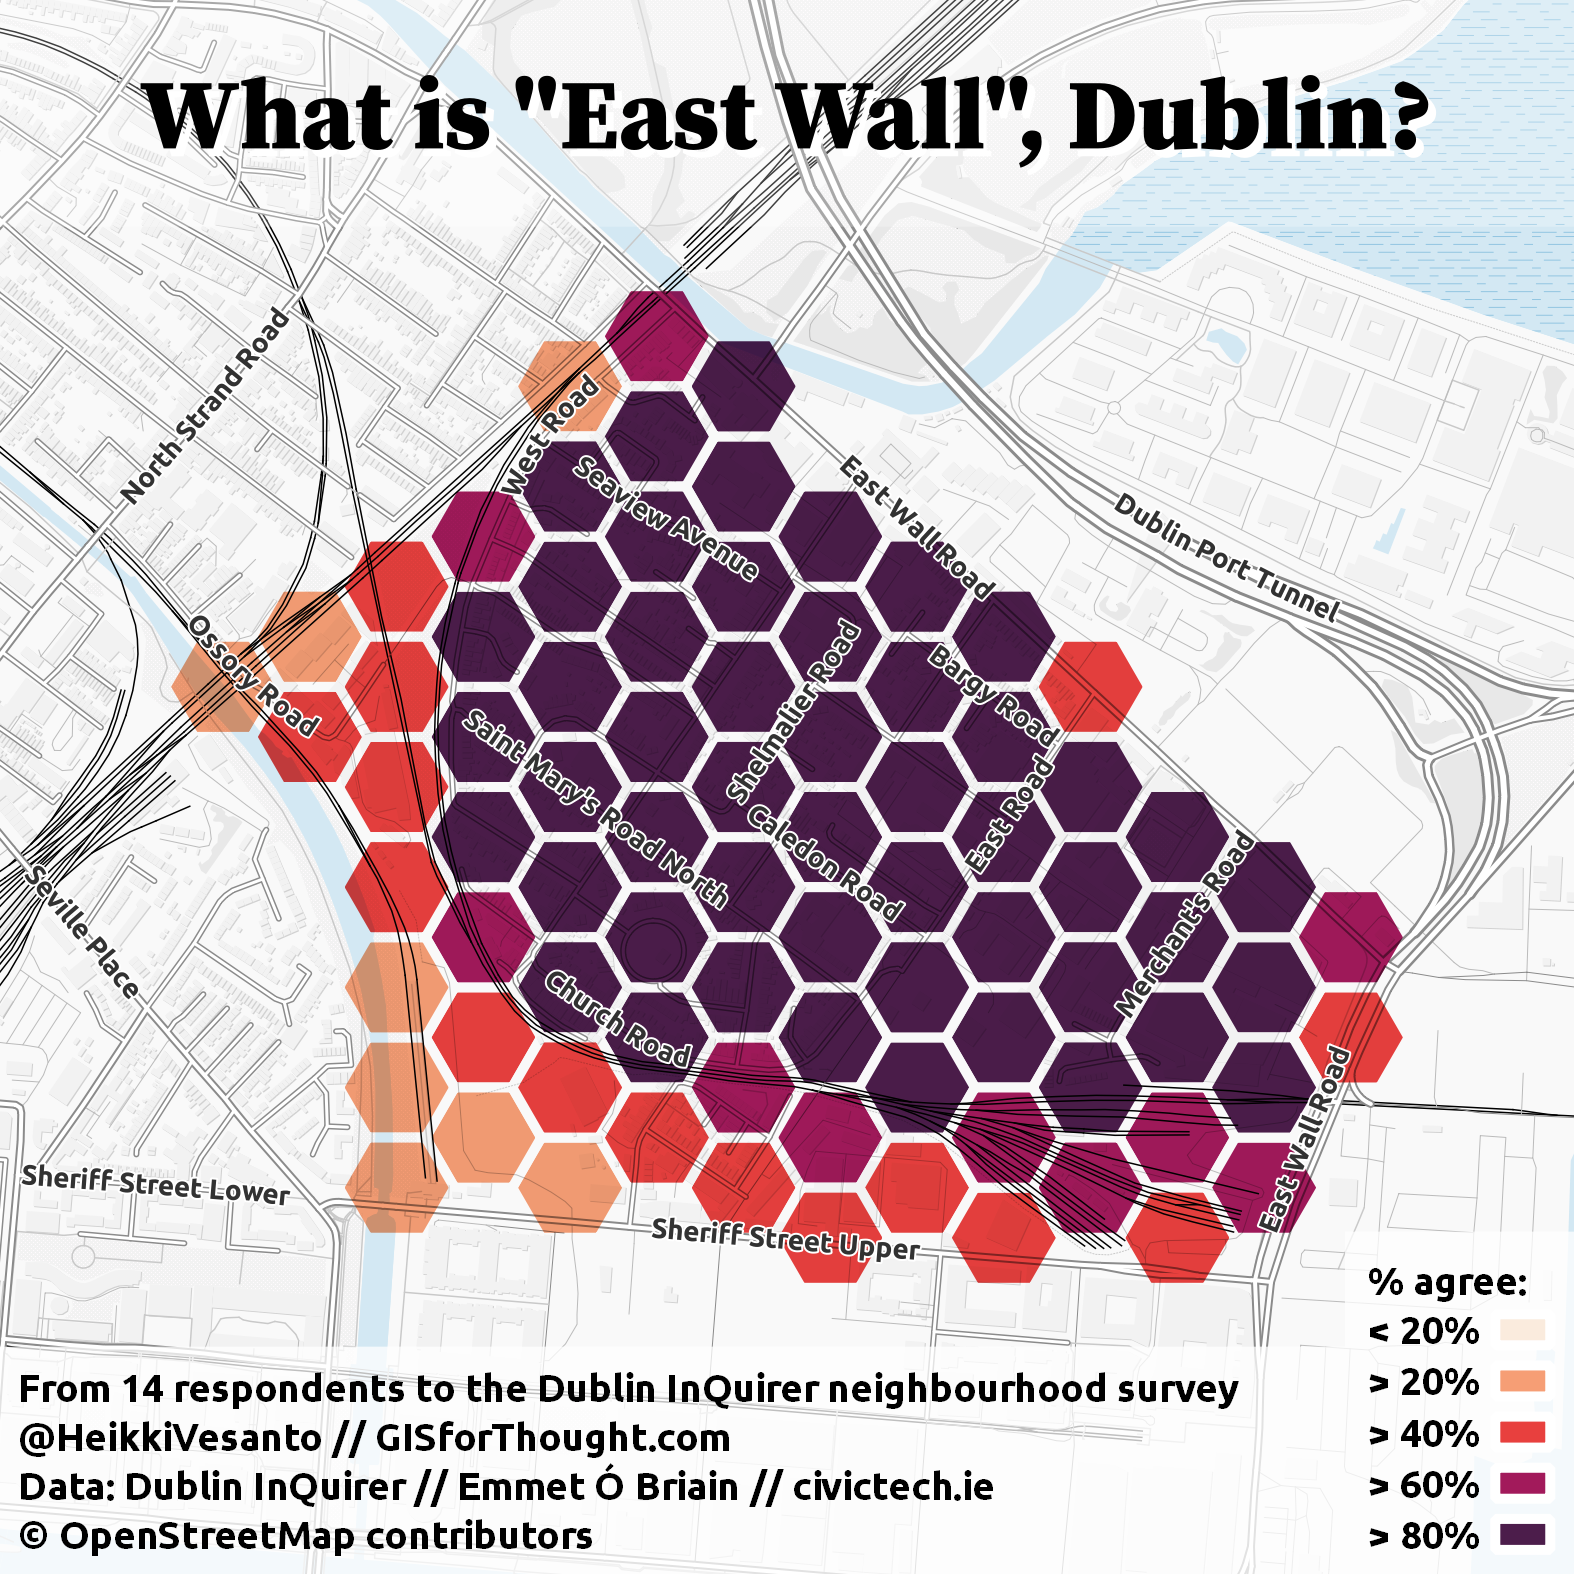
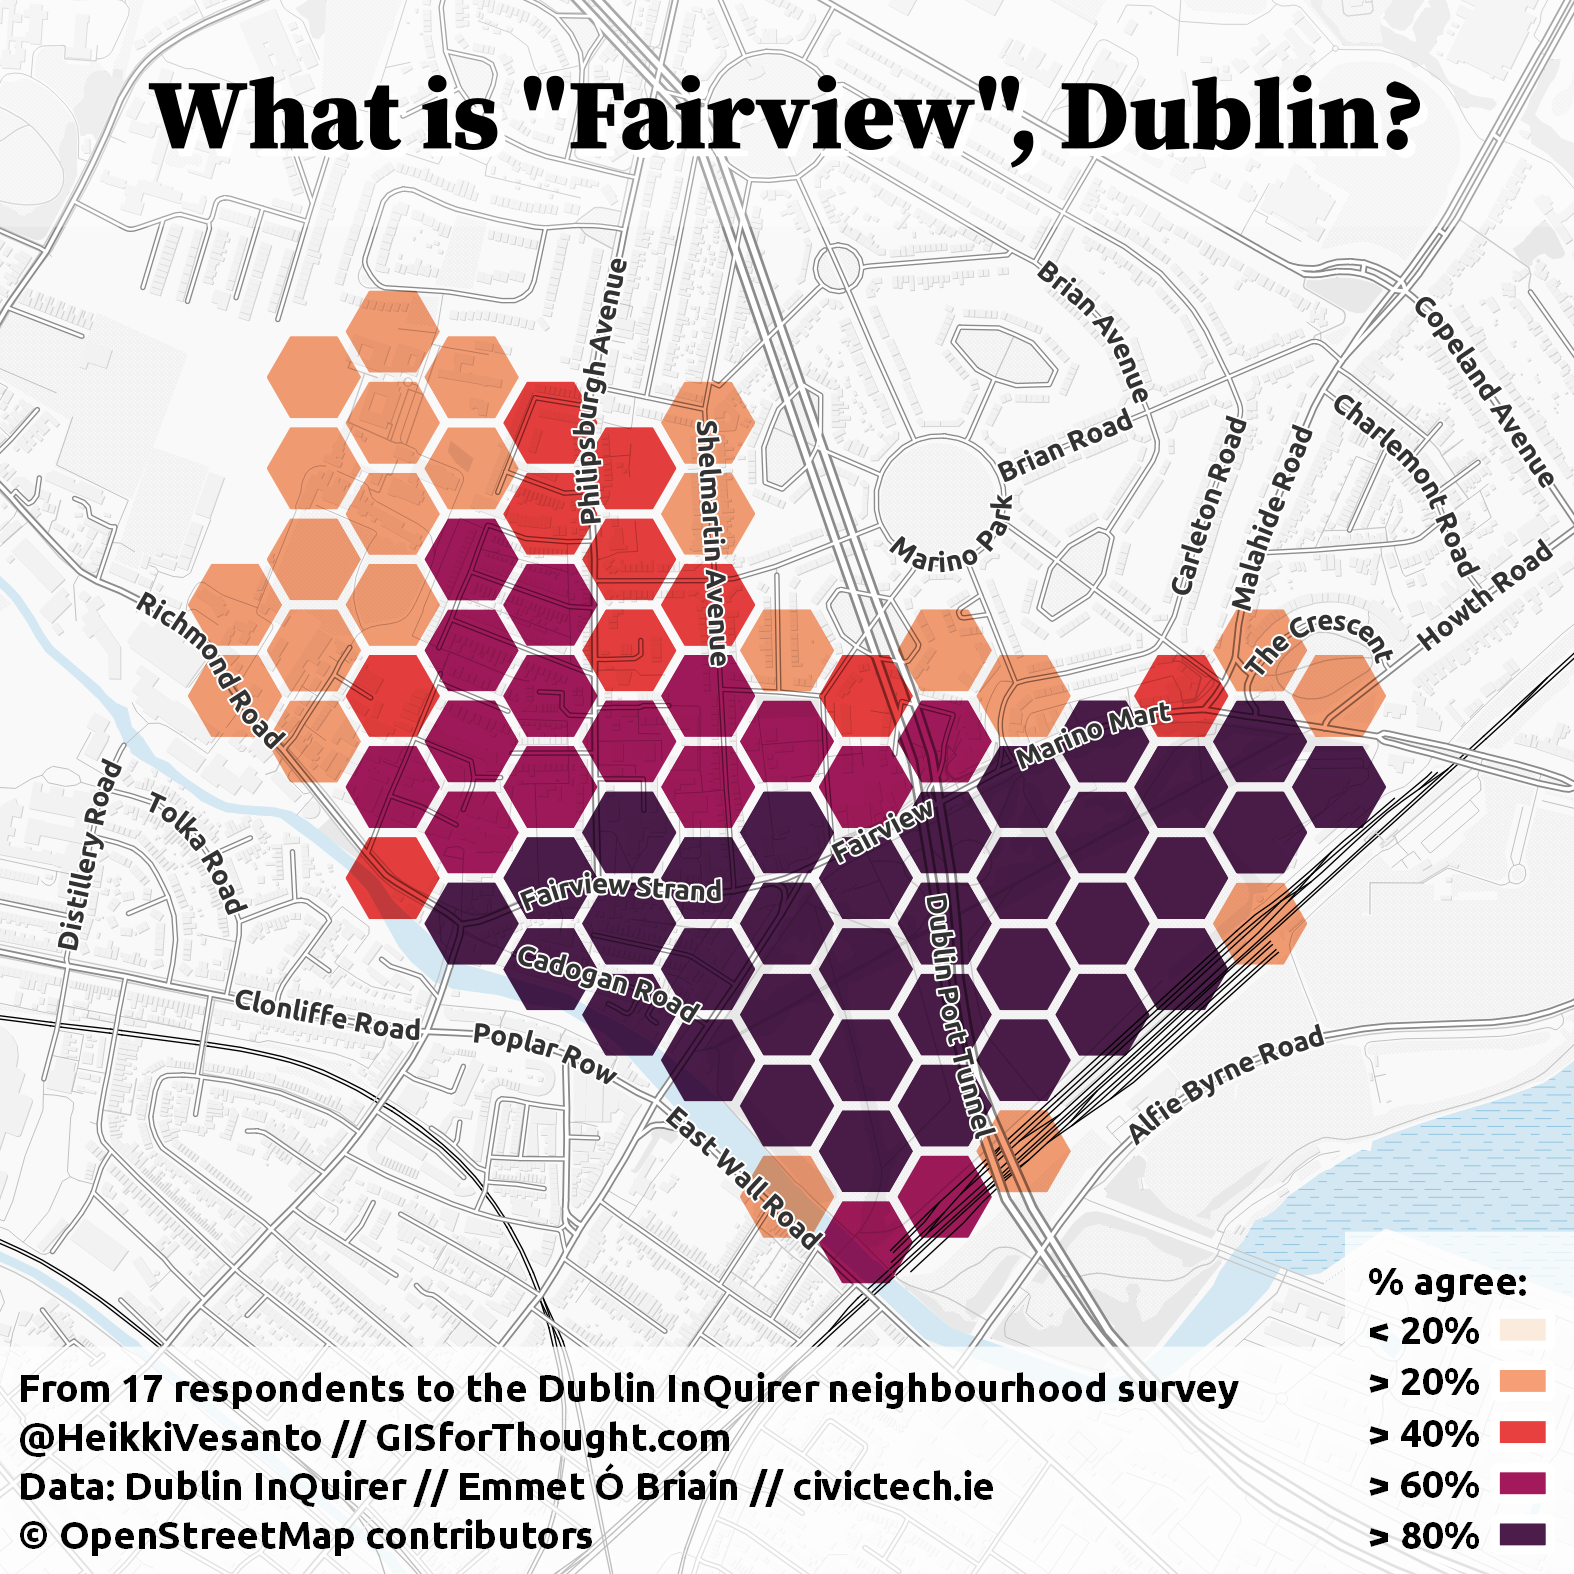
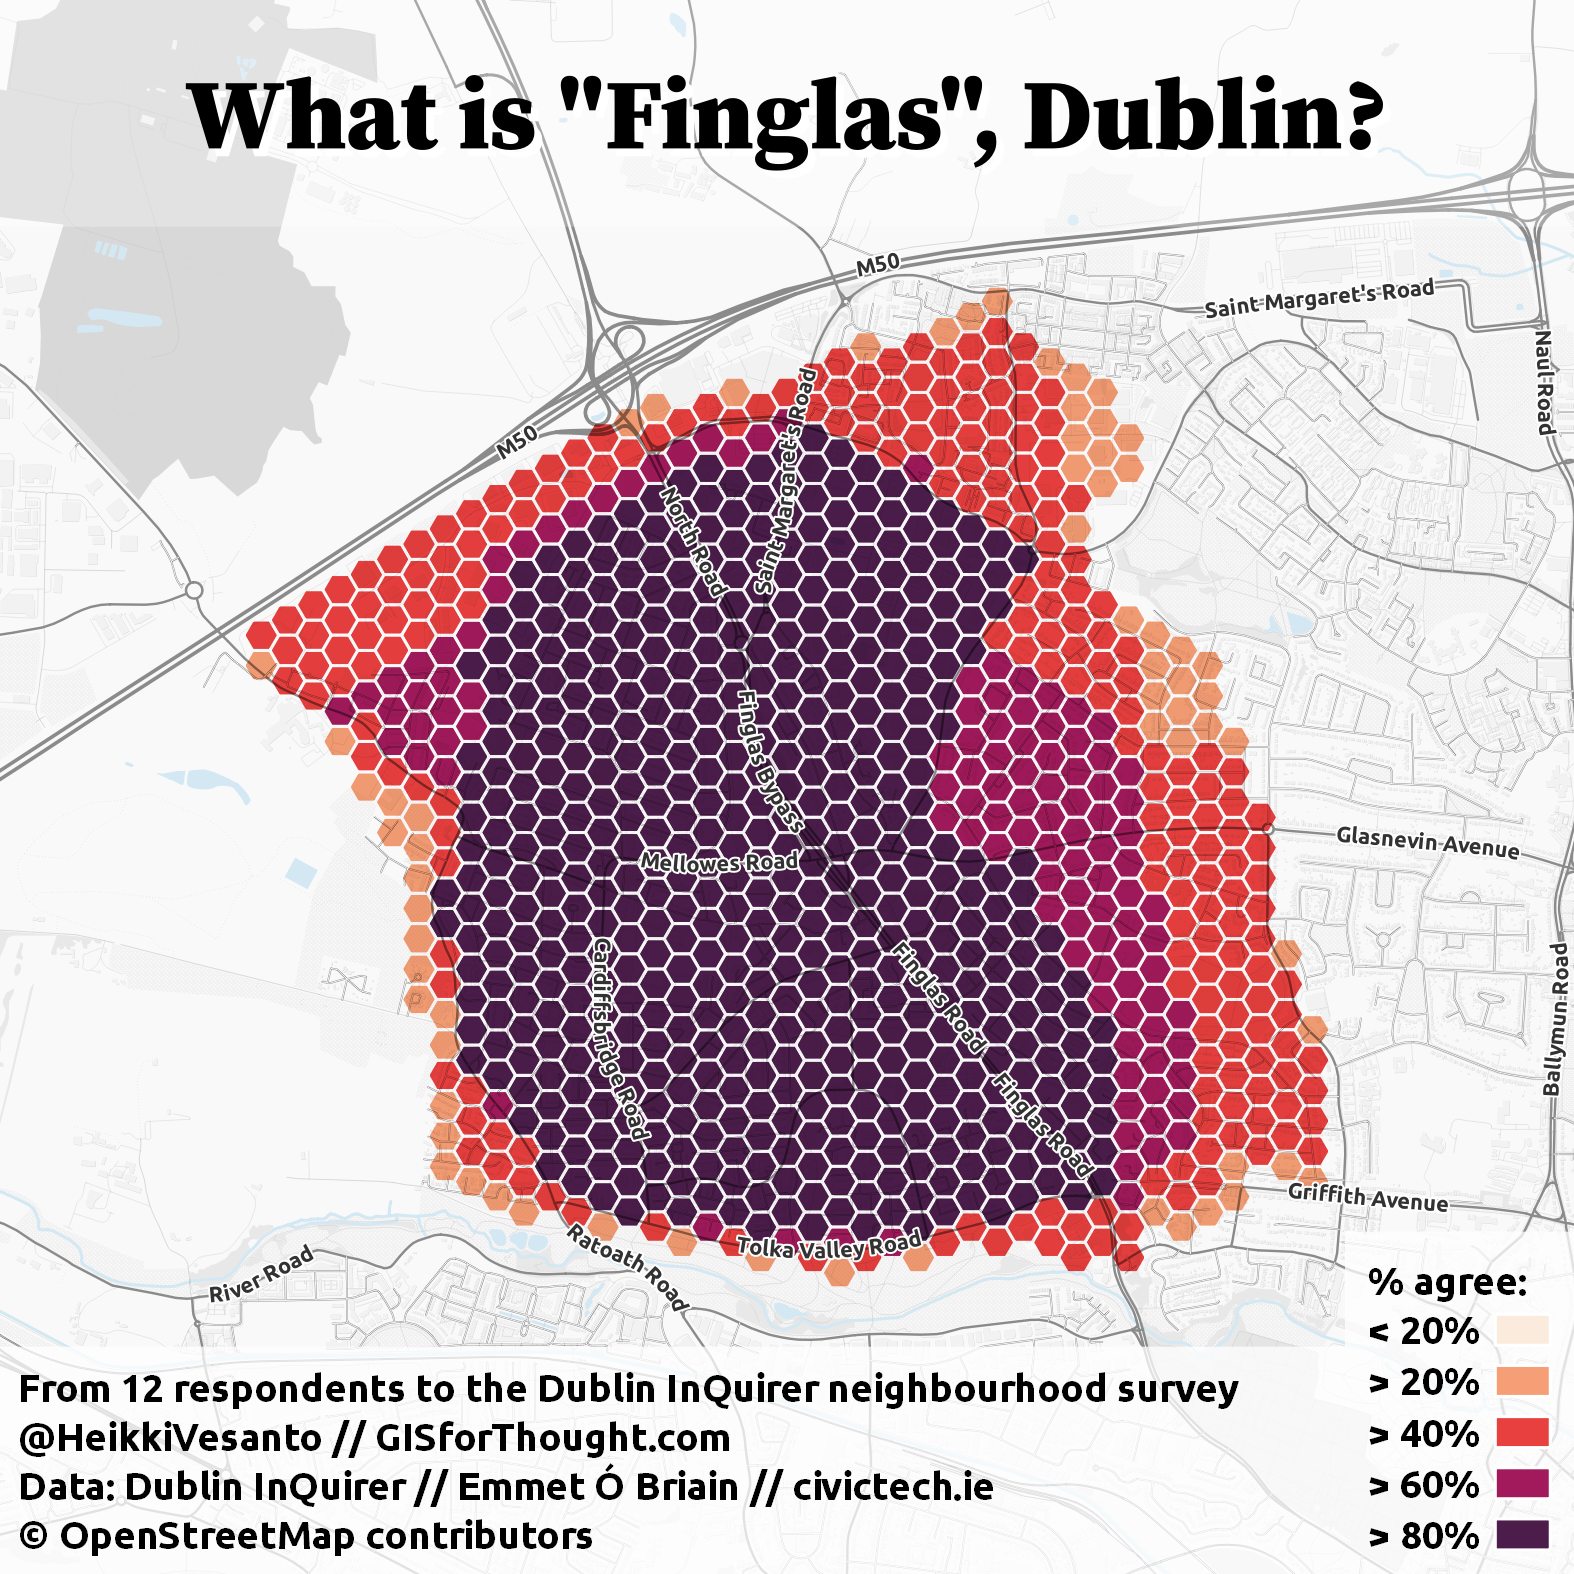
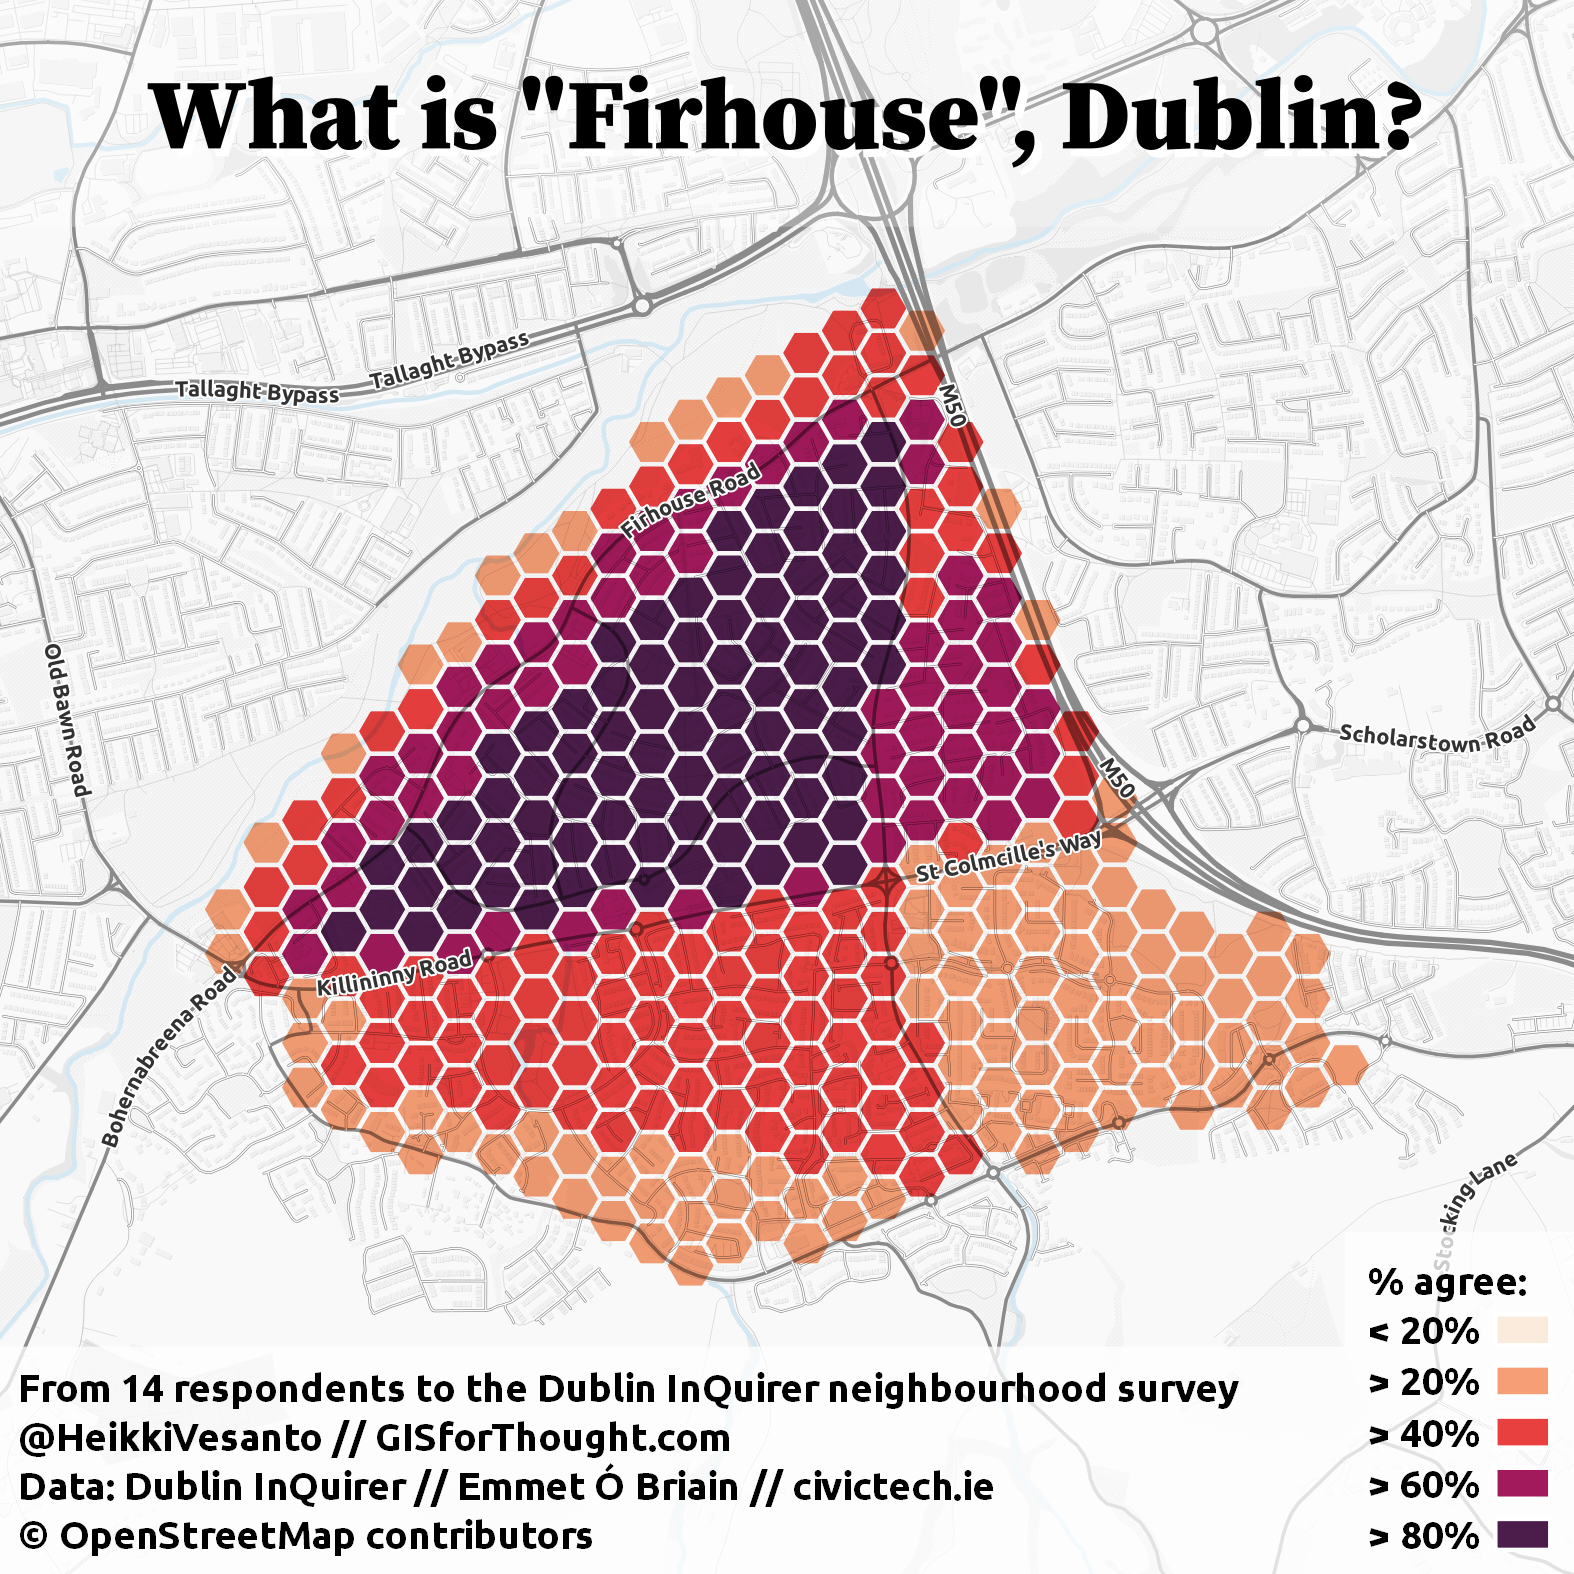
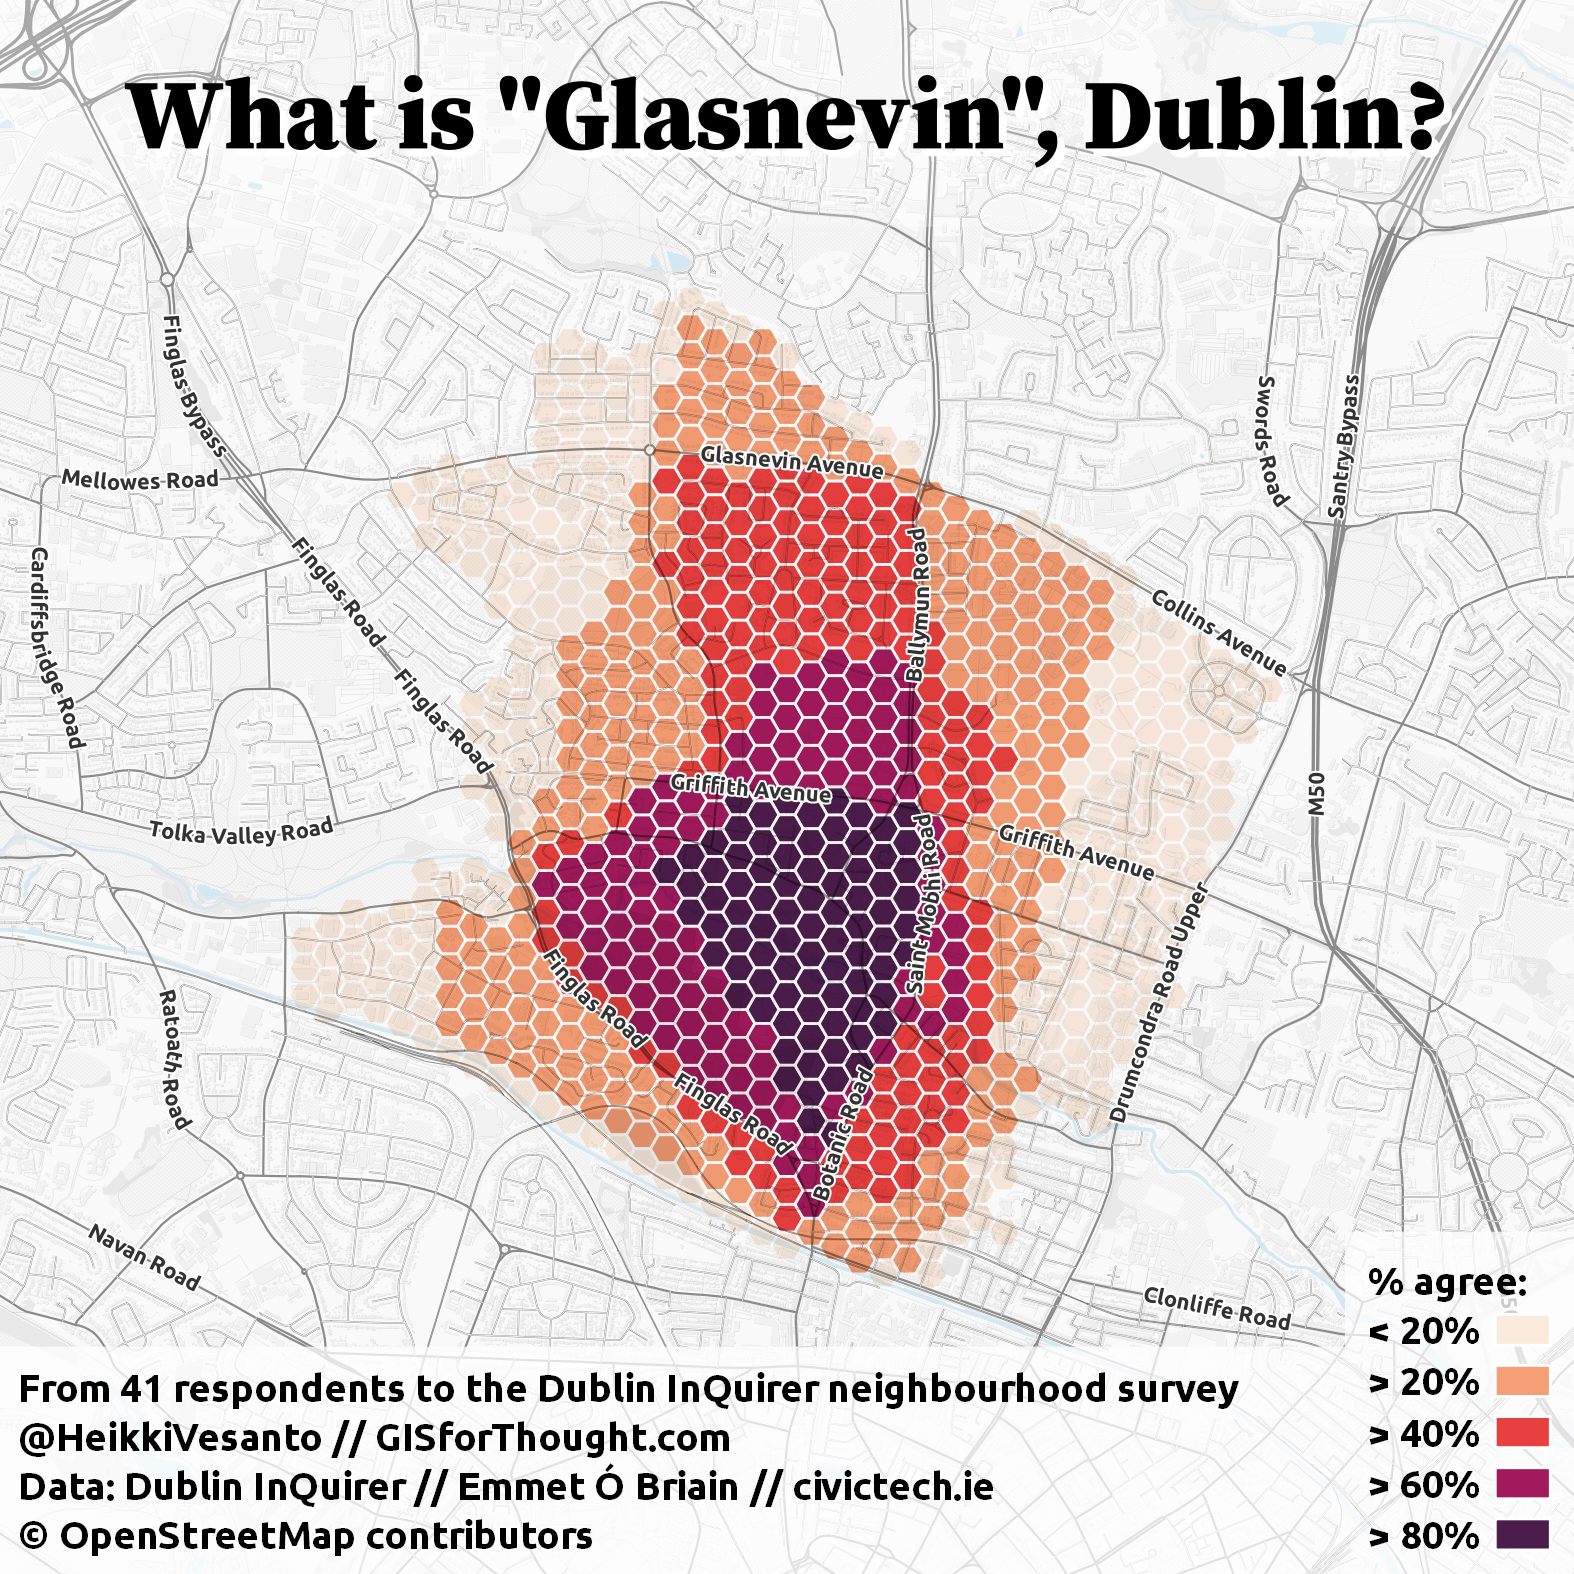
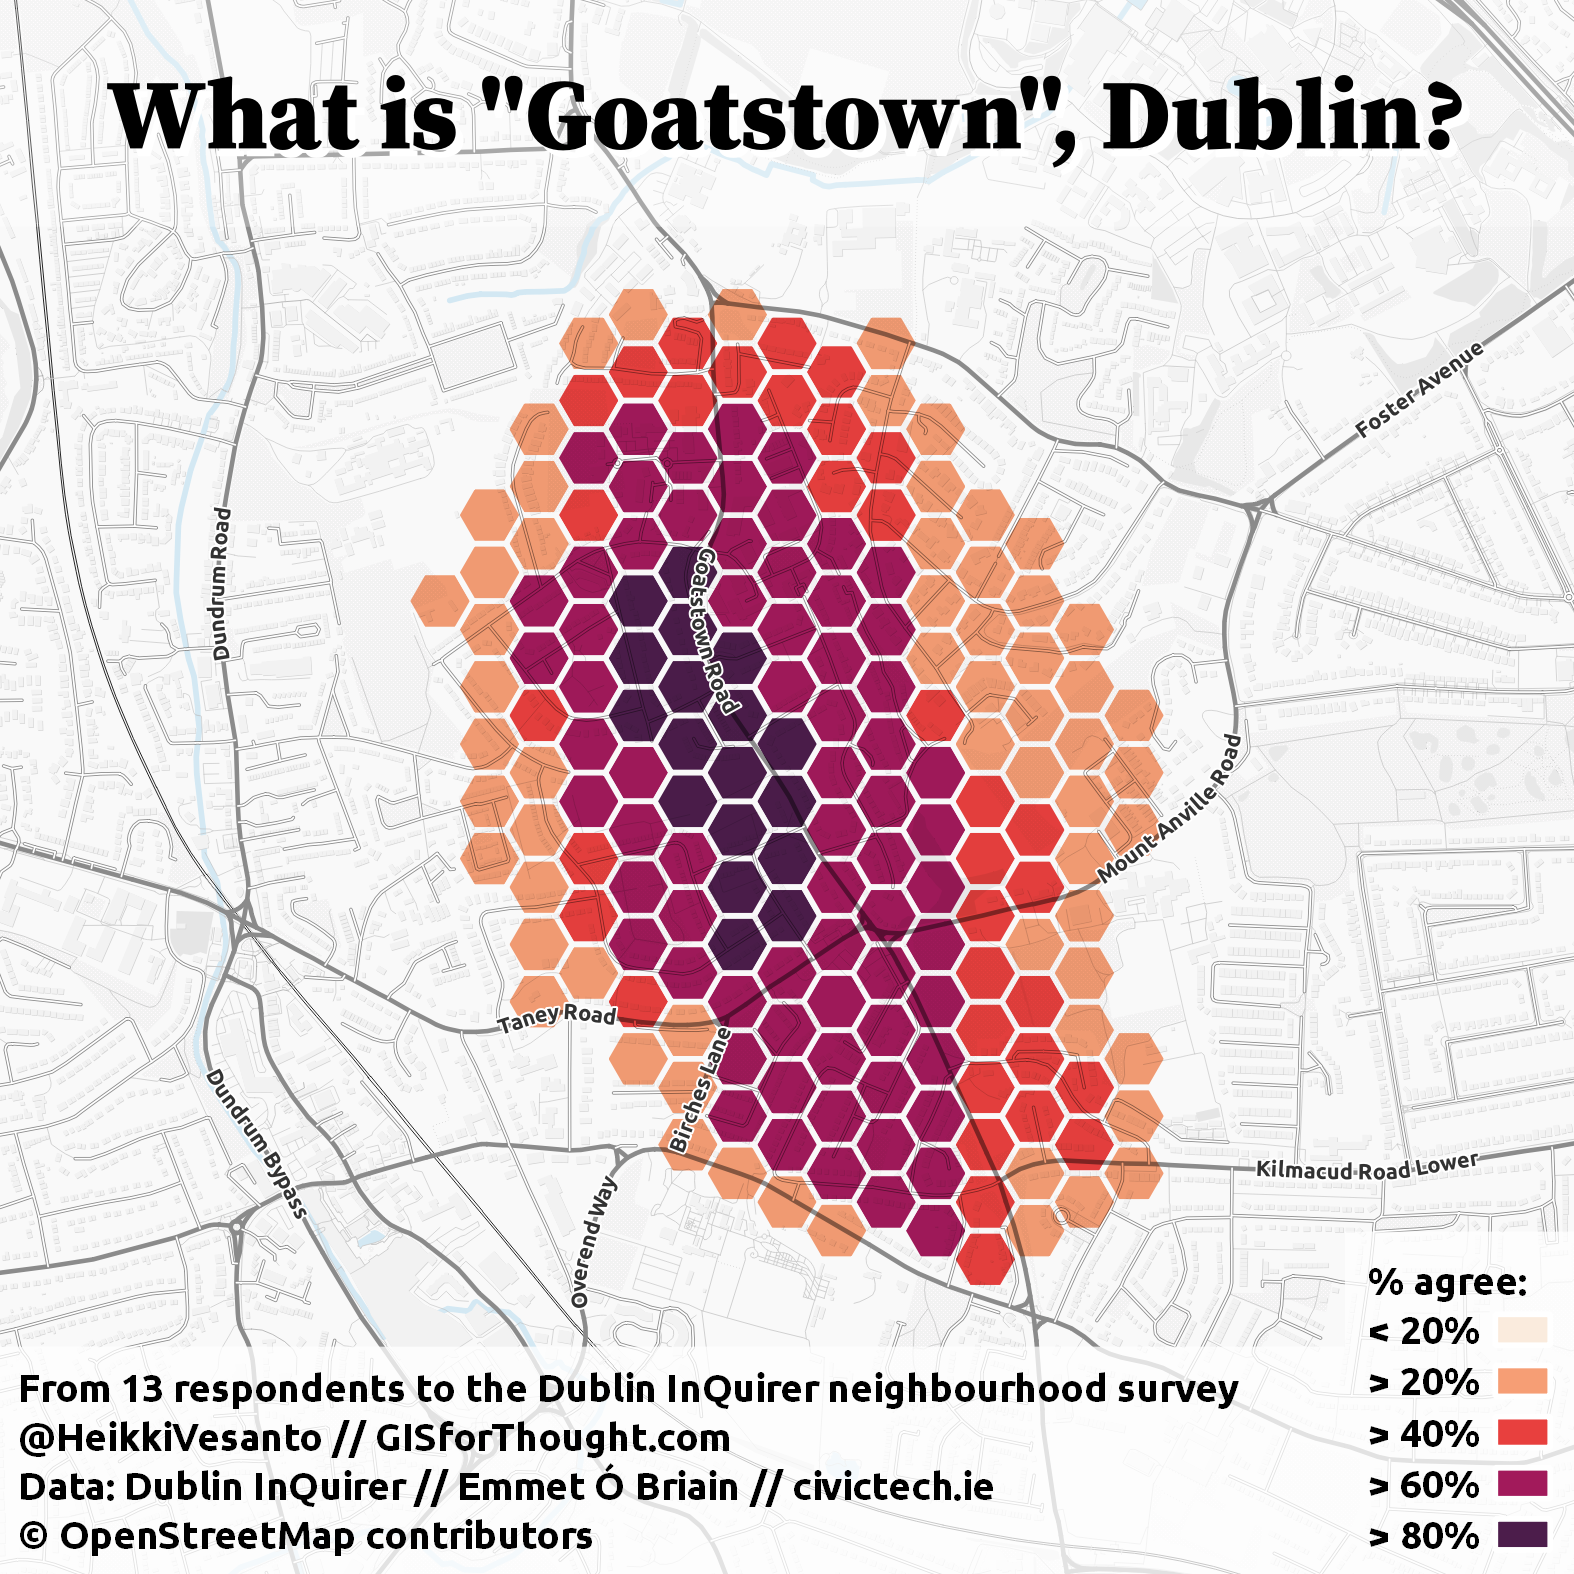
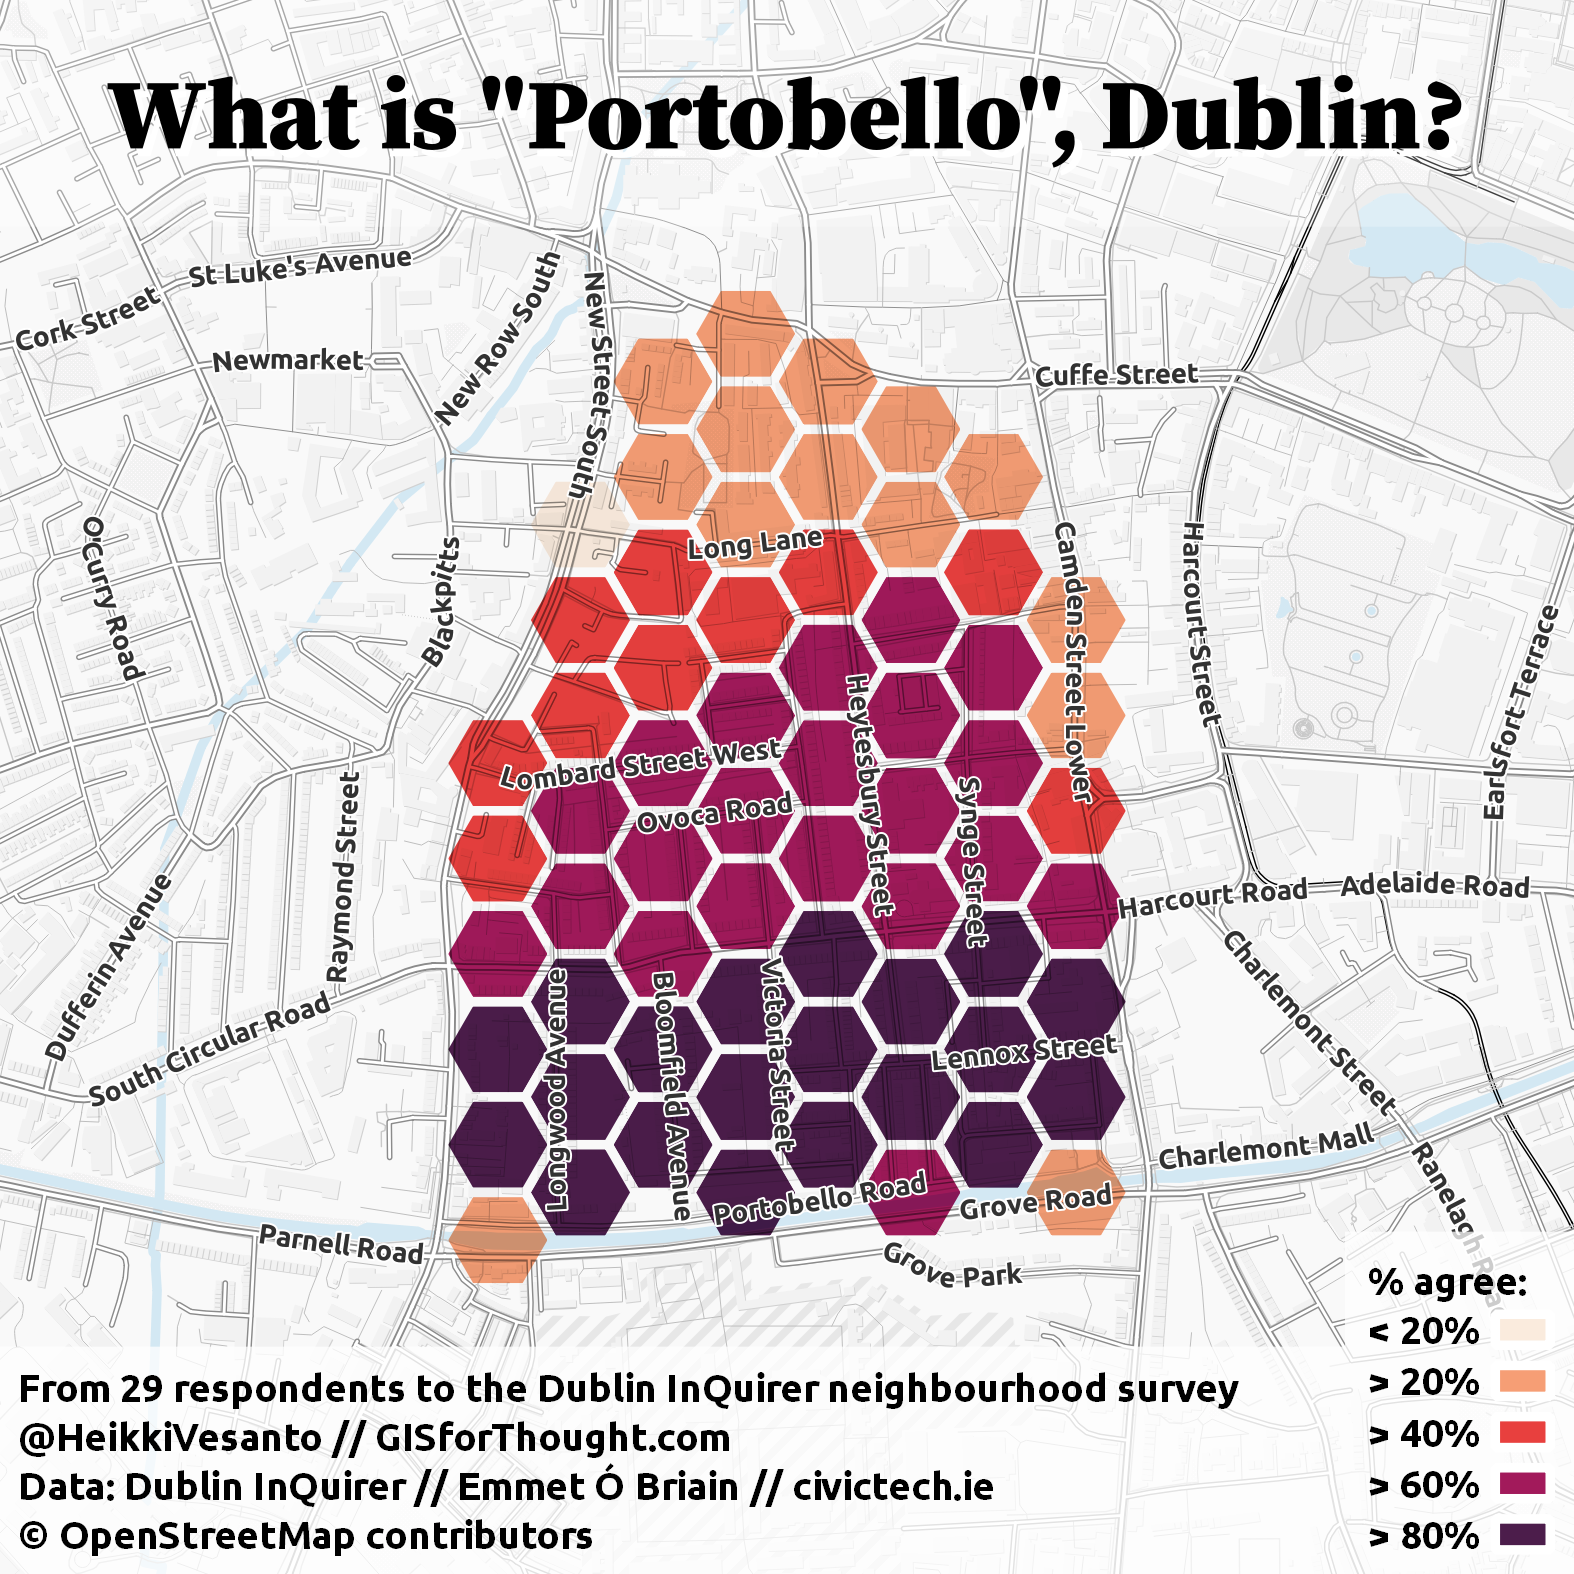
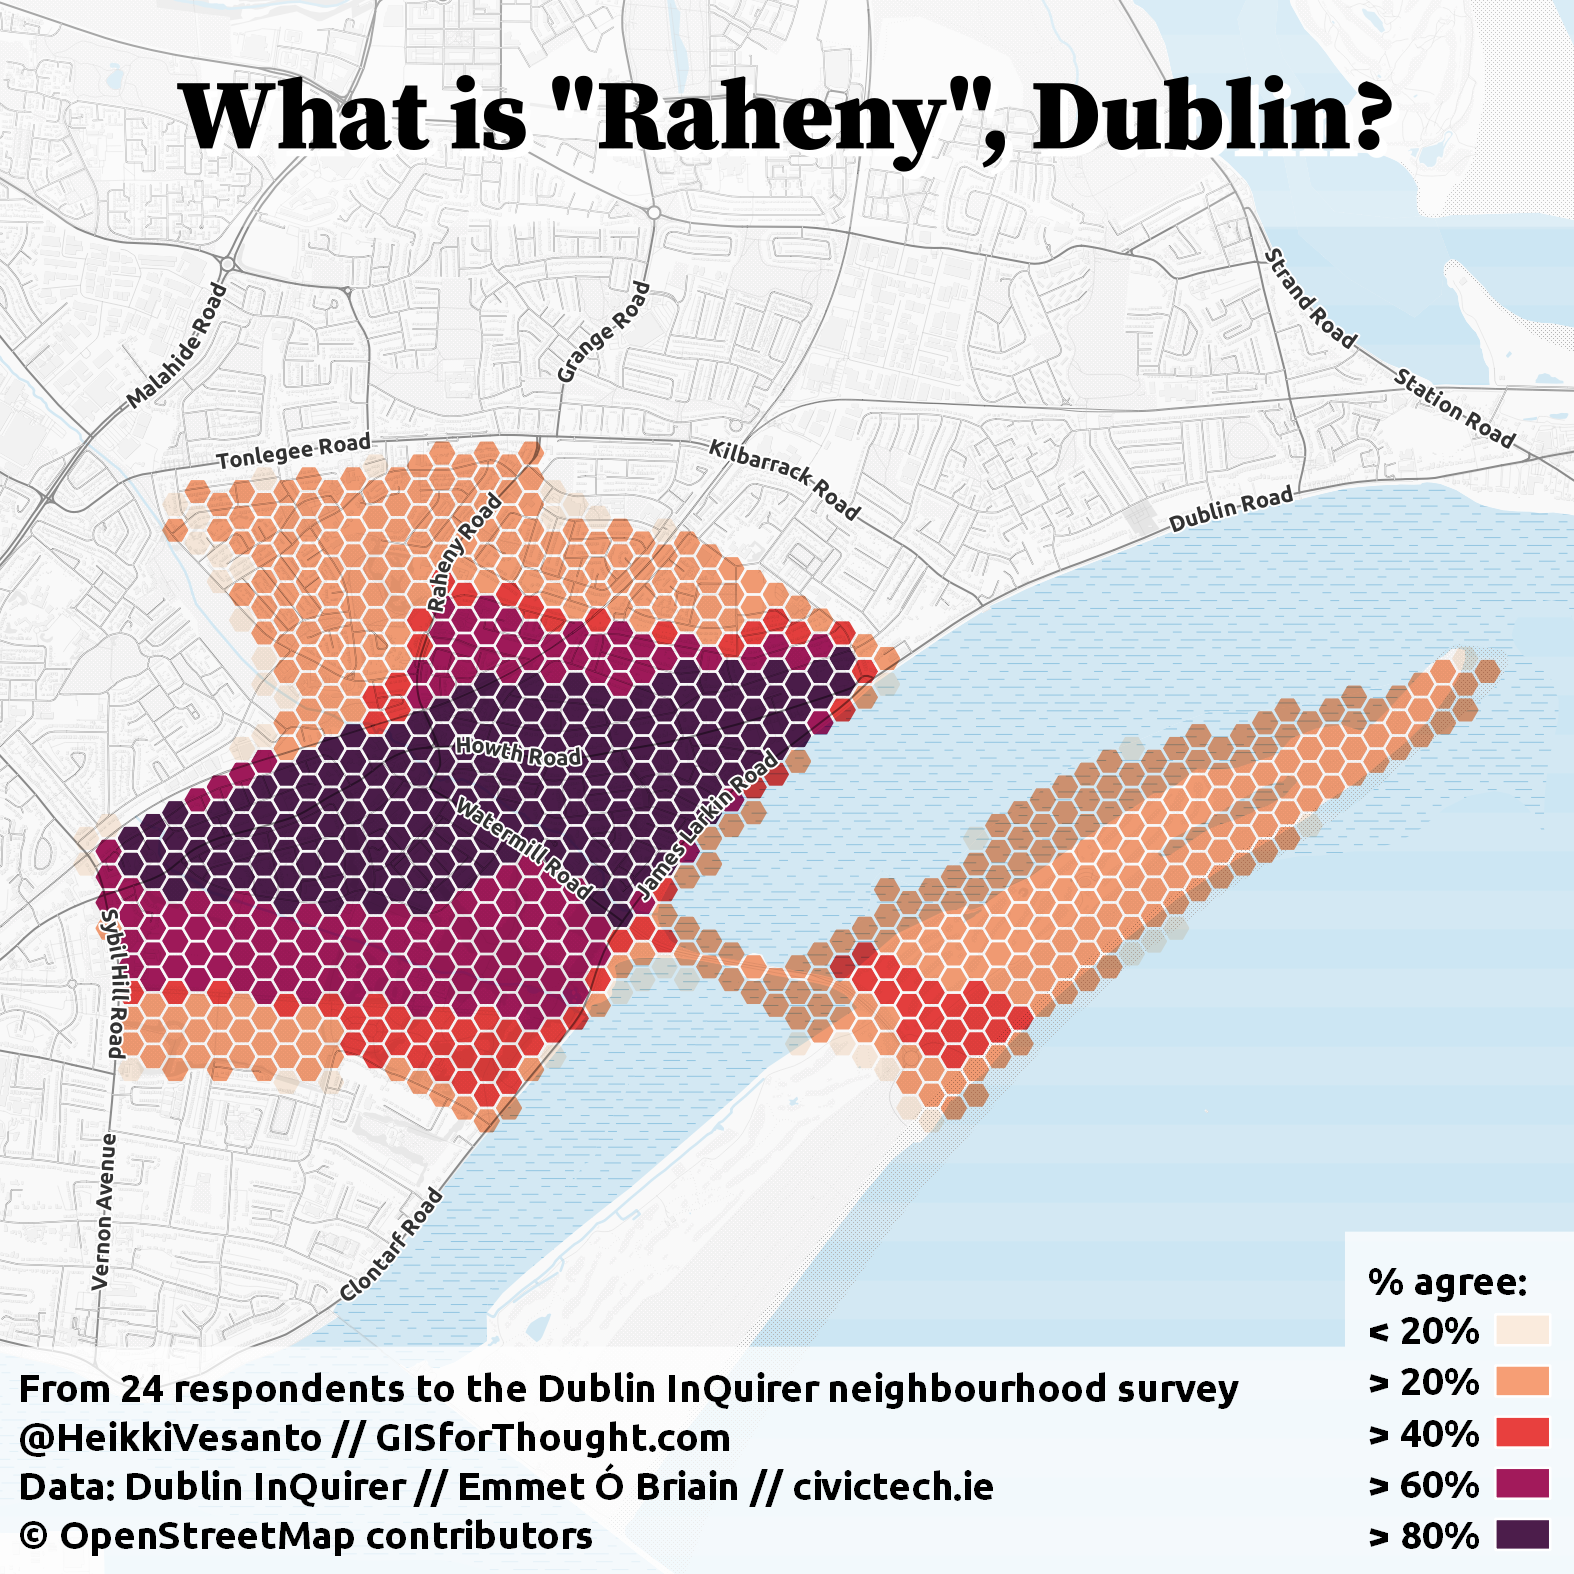
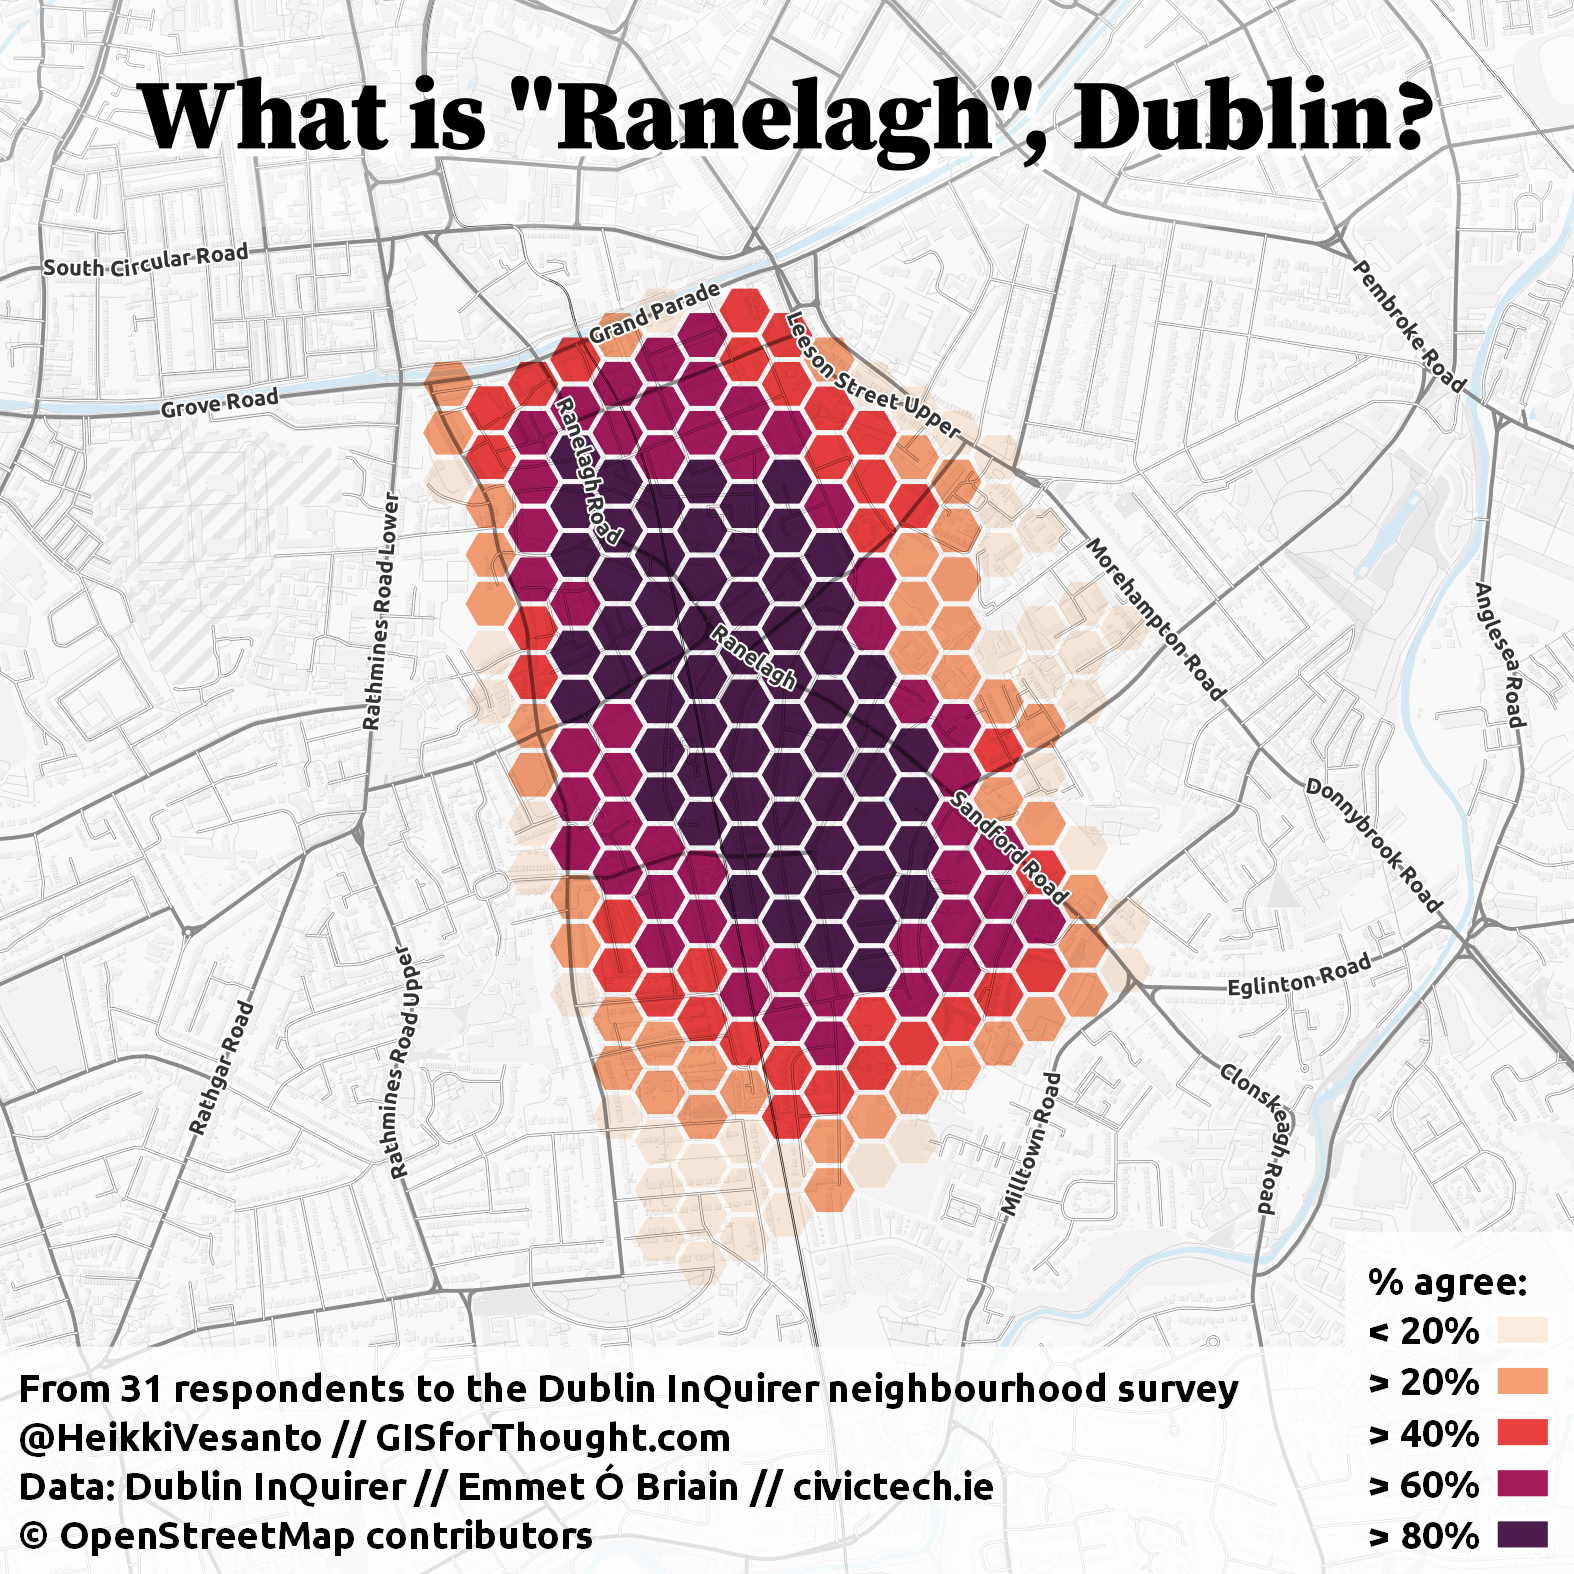
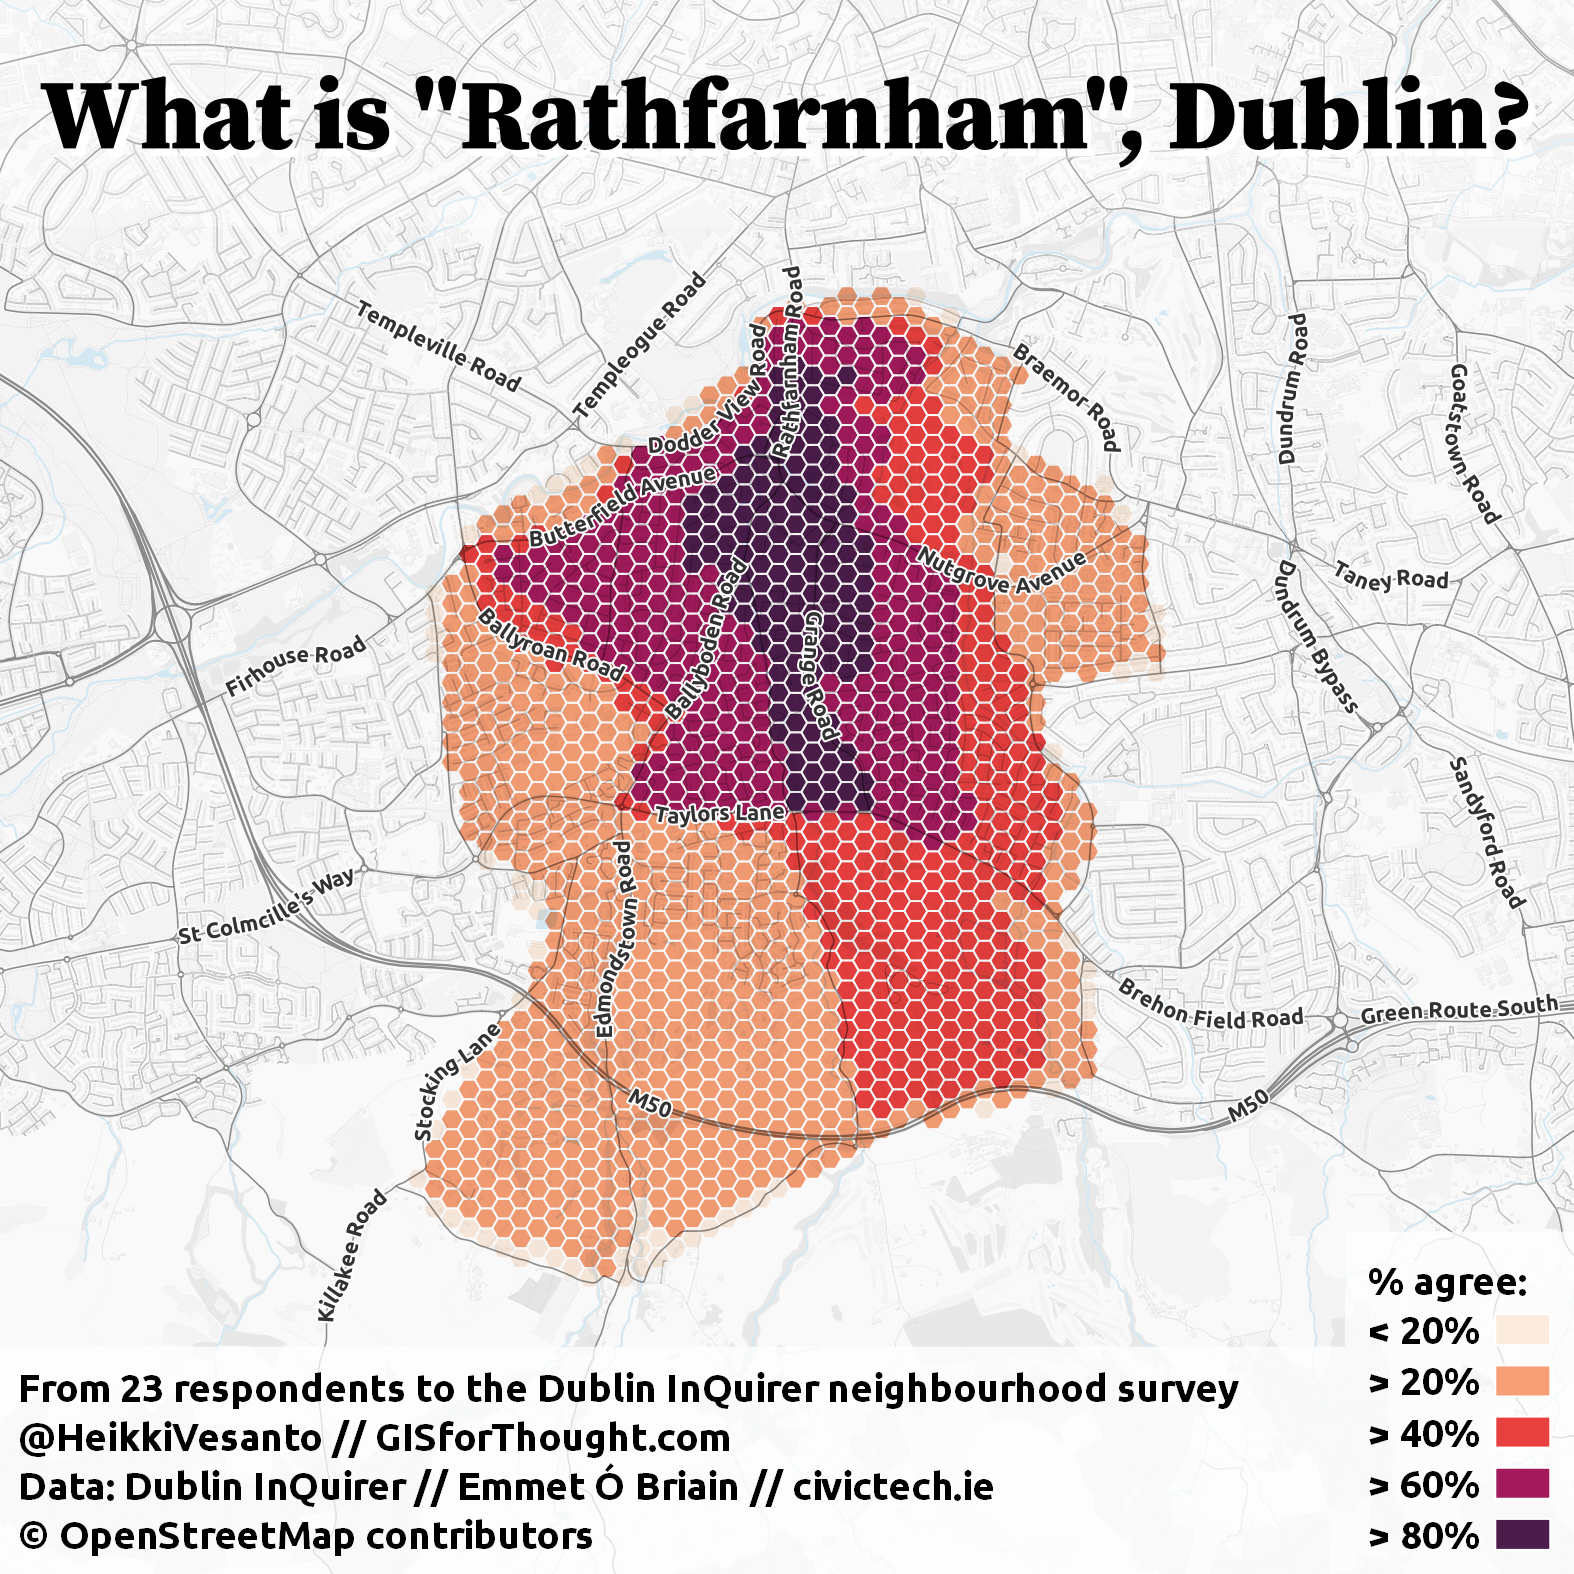
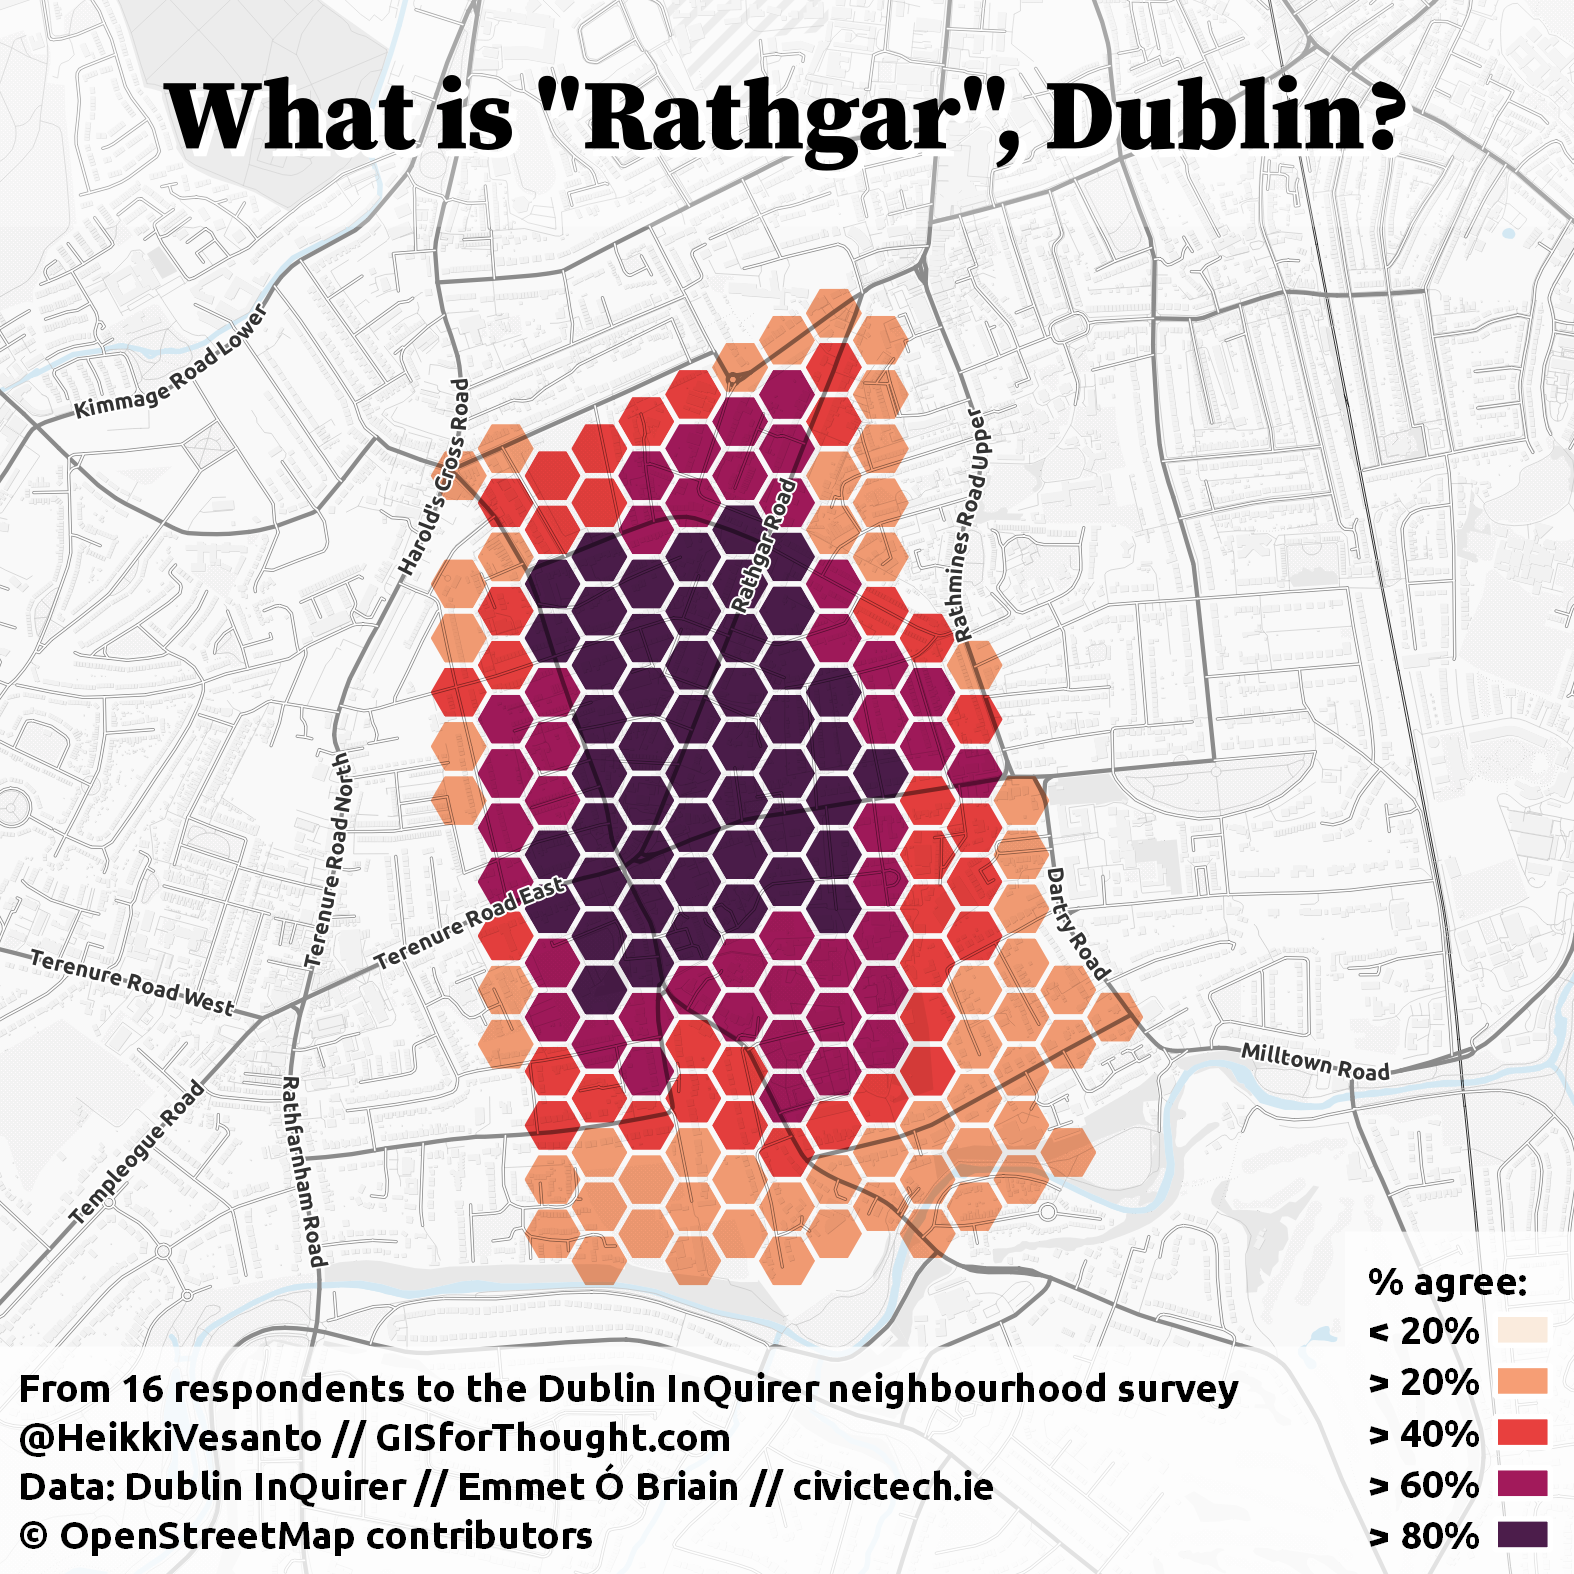
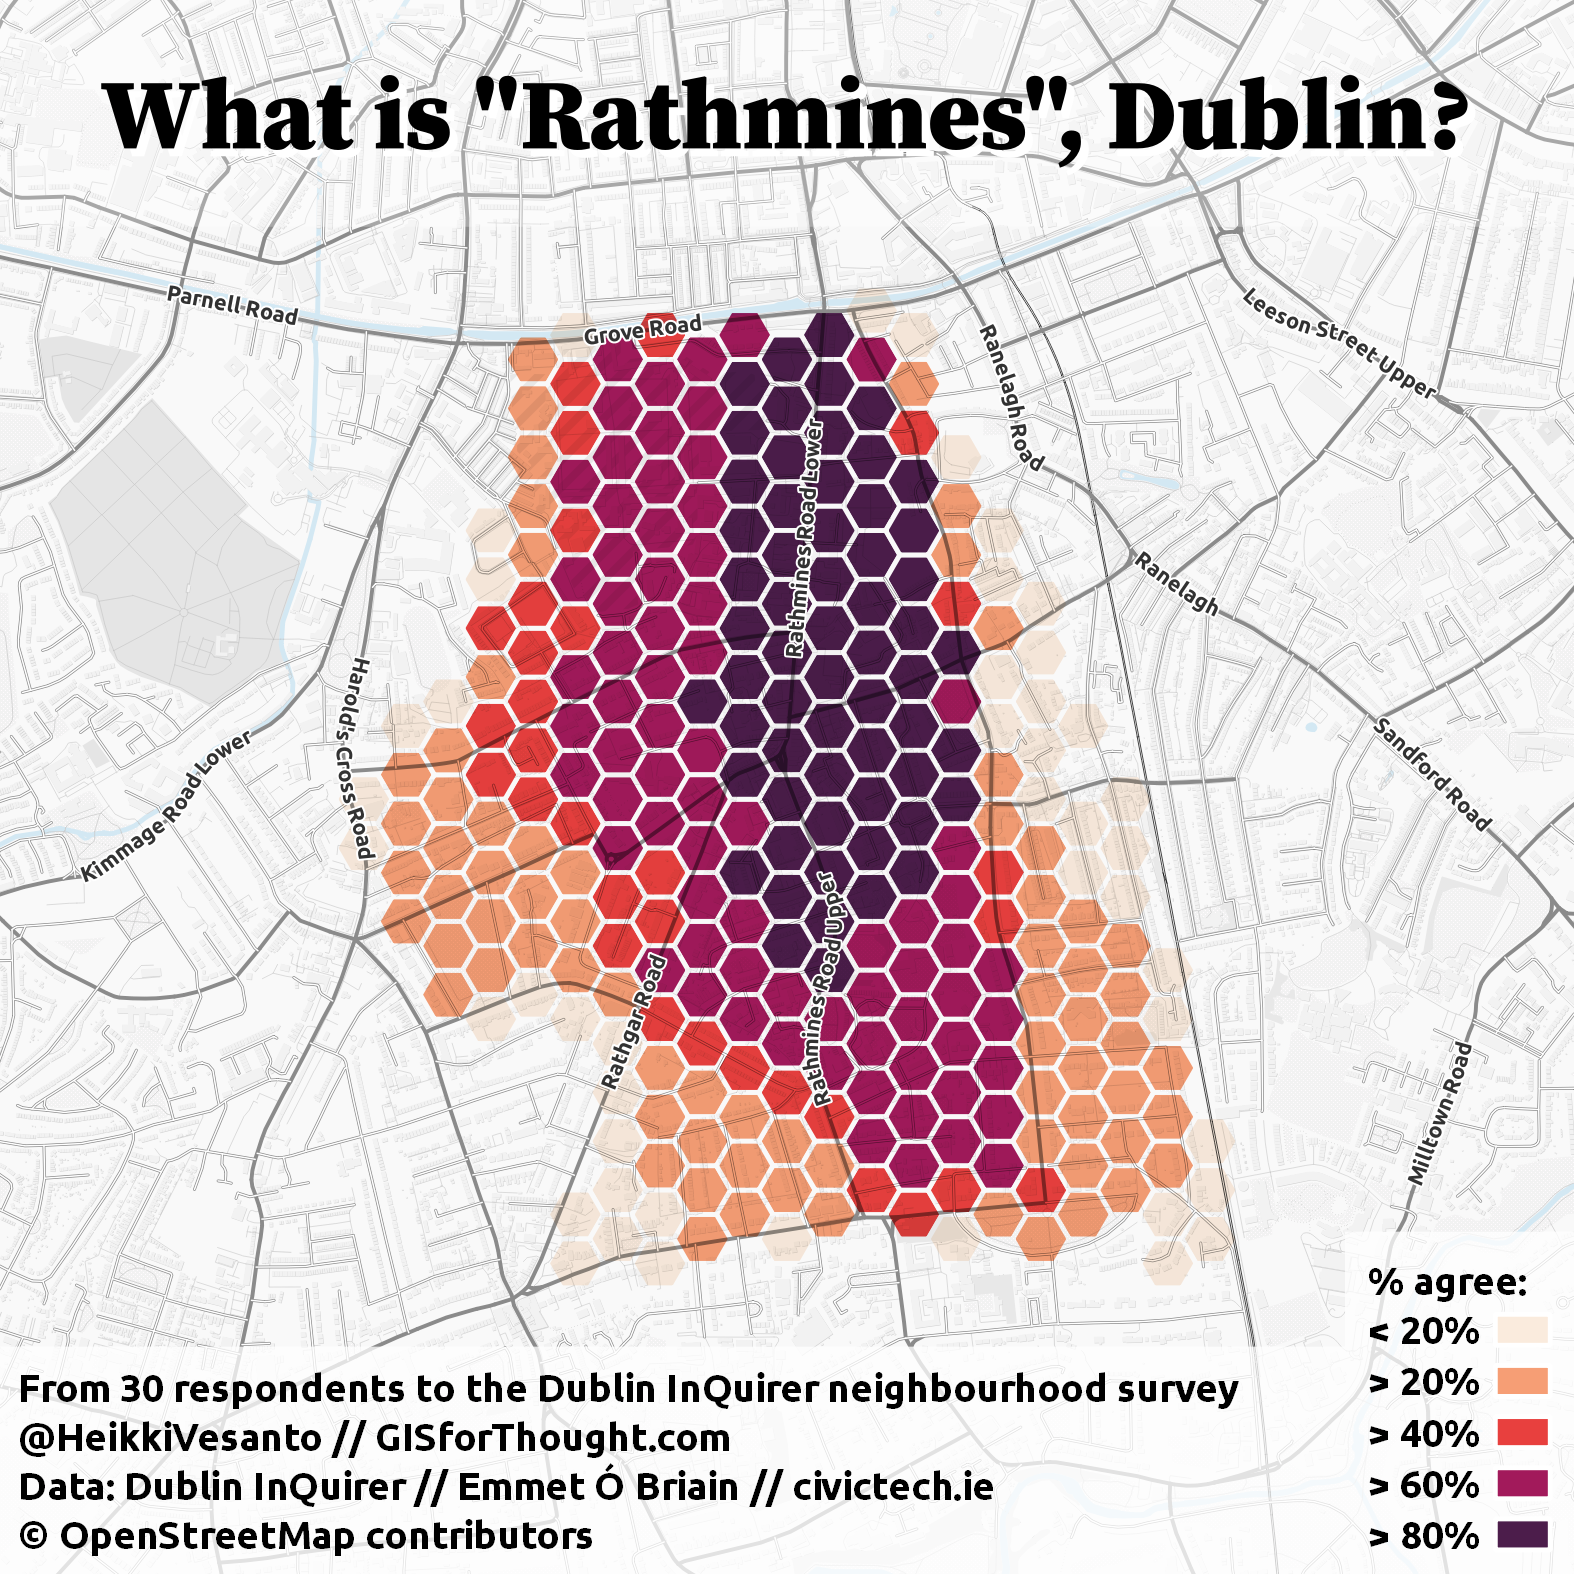
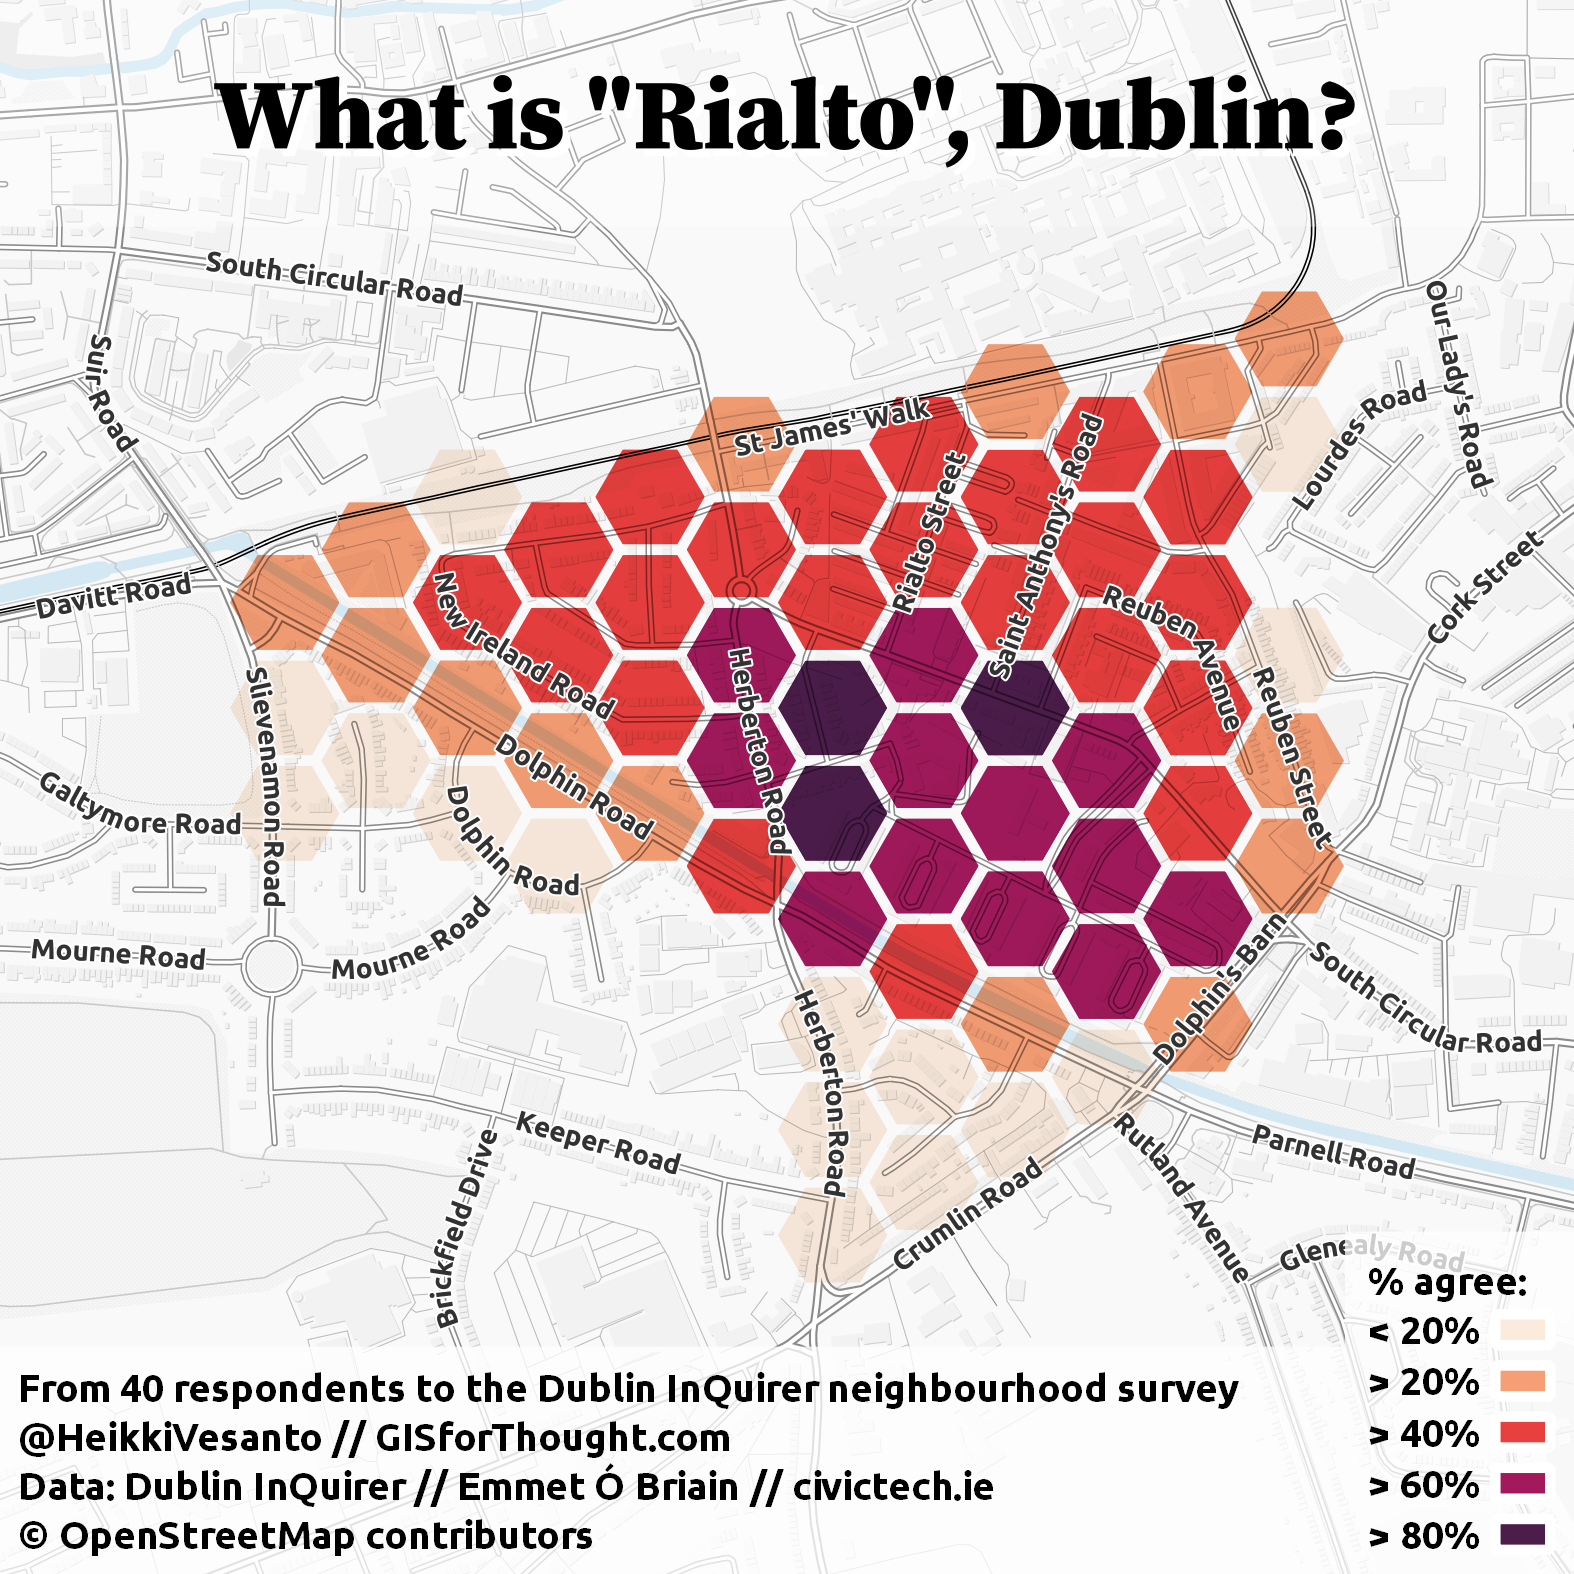
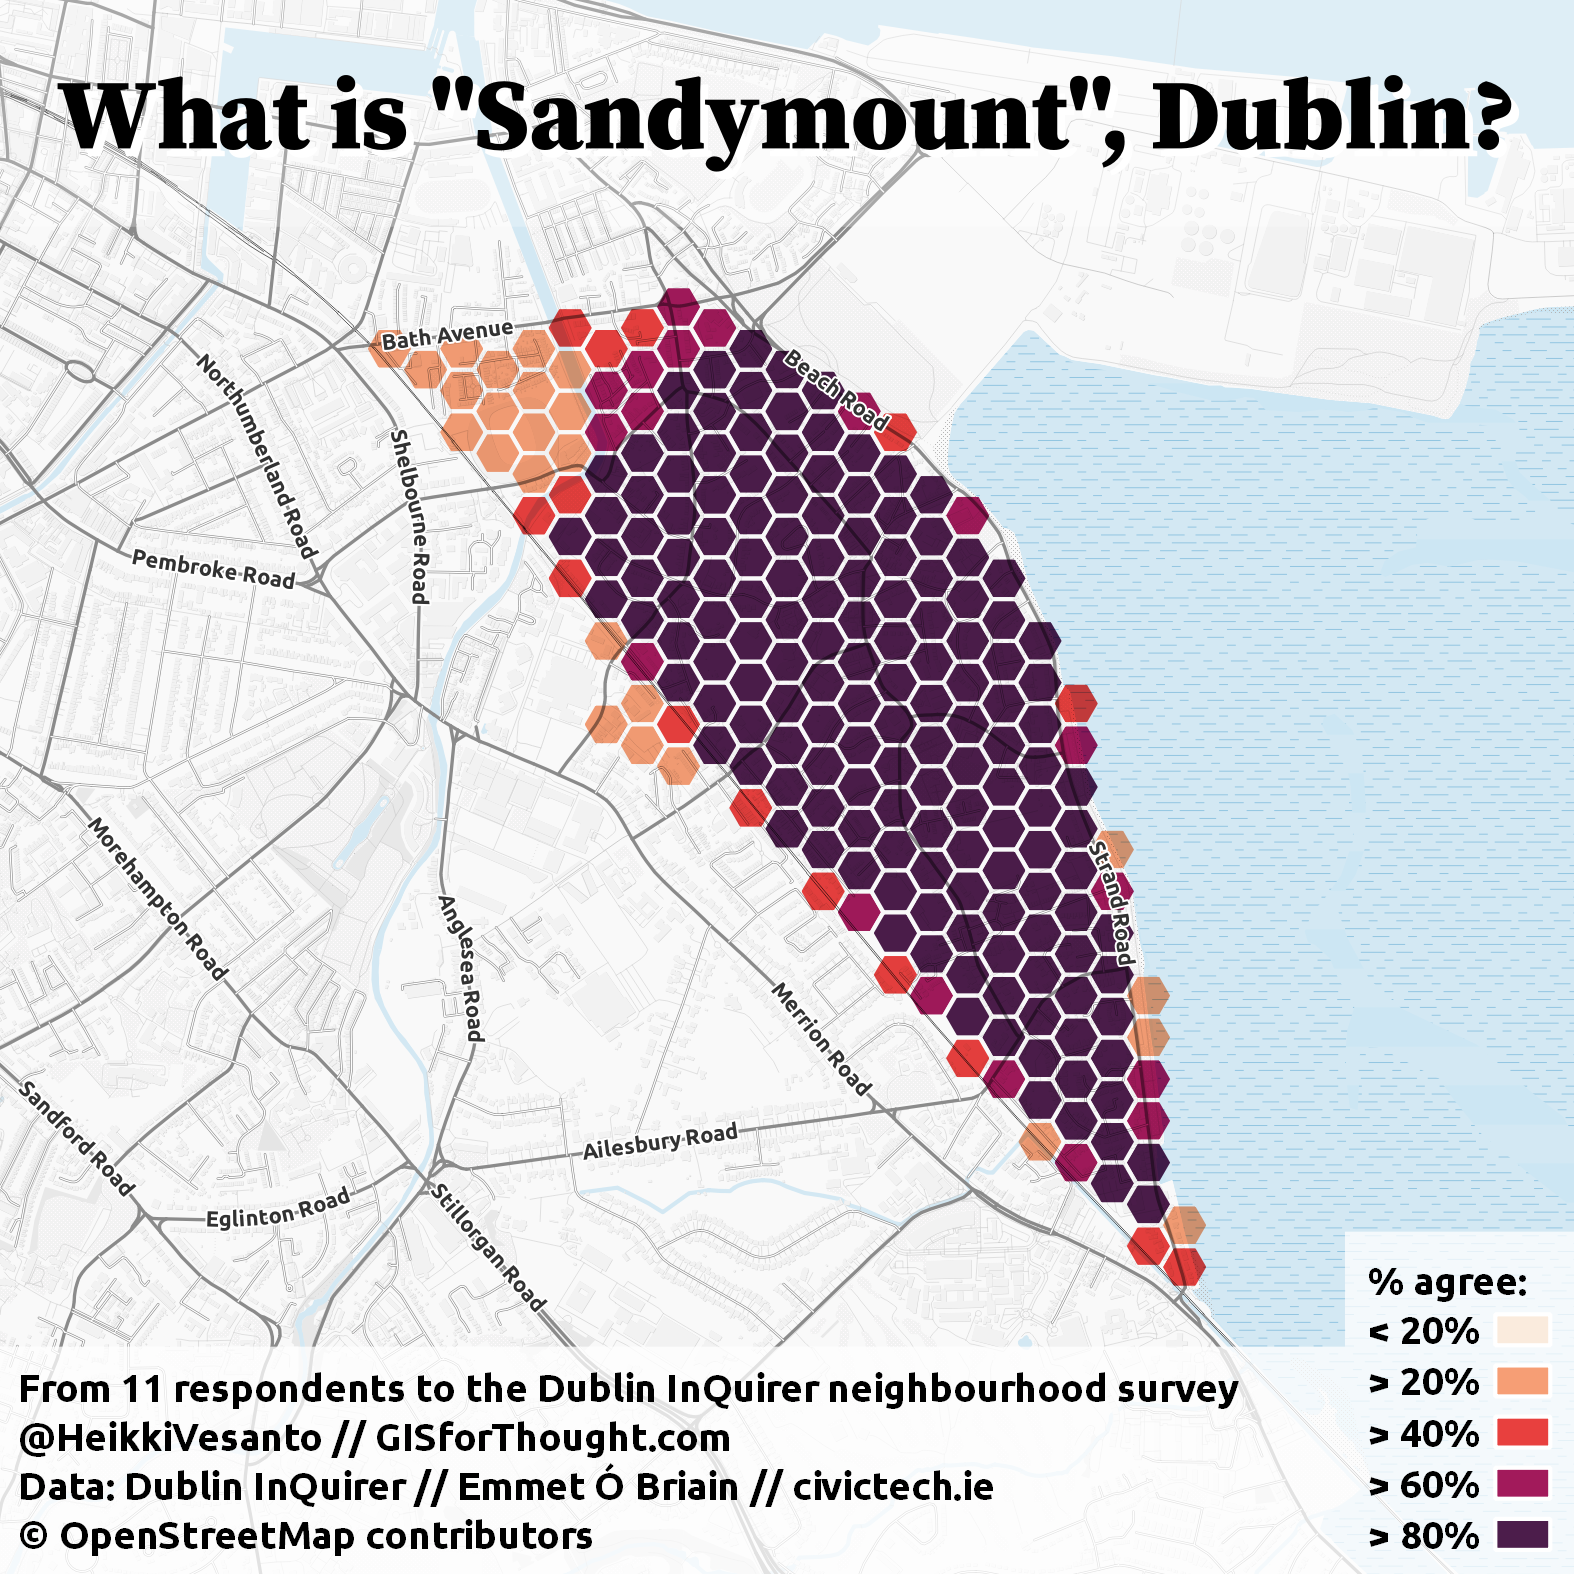
Luckily the Dublin InQuirer decided to run a similar survey, polling their subscribers for responses. The number of submissions was good, not quite beating the Boston yet, but getting close. 2200 responses and 133 unique neighborhoods mapped. They also did a few great things. One was making the data available to download. This meant that anyone could map the results, which is great. Additionally they are reaching out to areas with less responses, which is a great effort on their part.
Dublin InQuirer – Will You Draw Your Dublin Neighbourhood for Us?
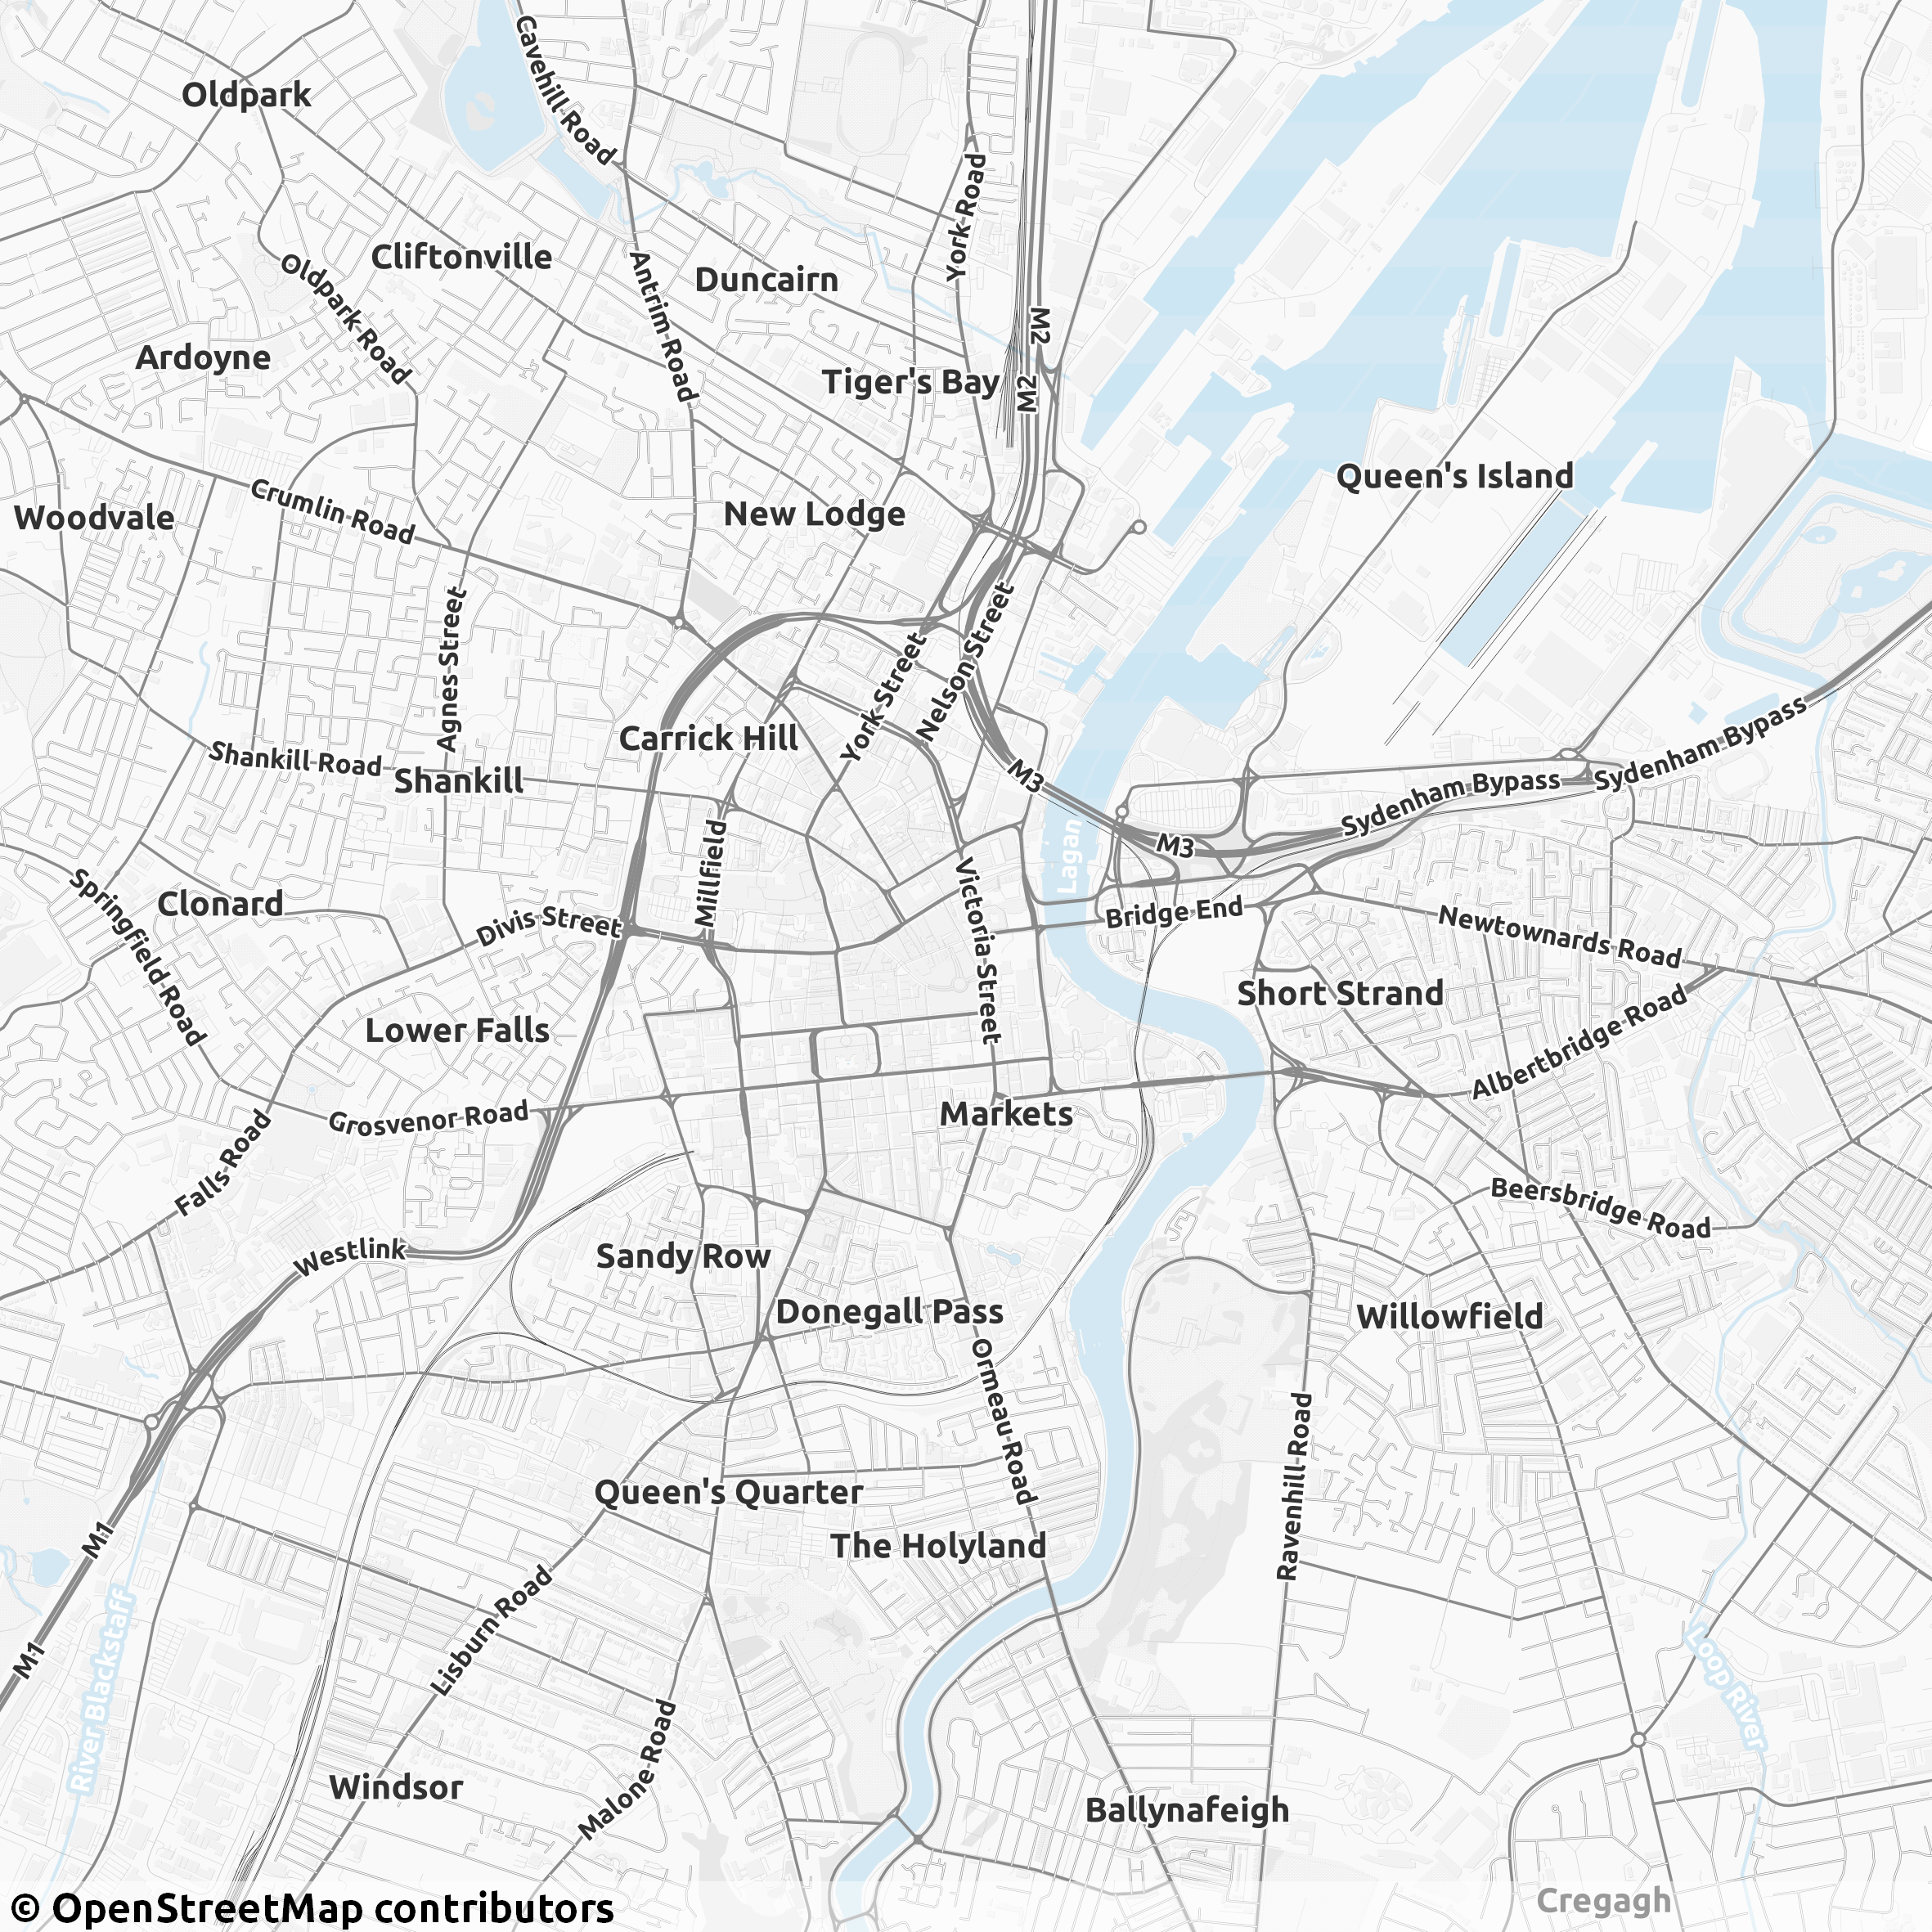
Results:
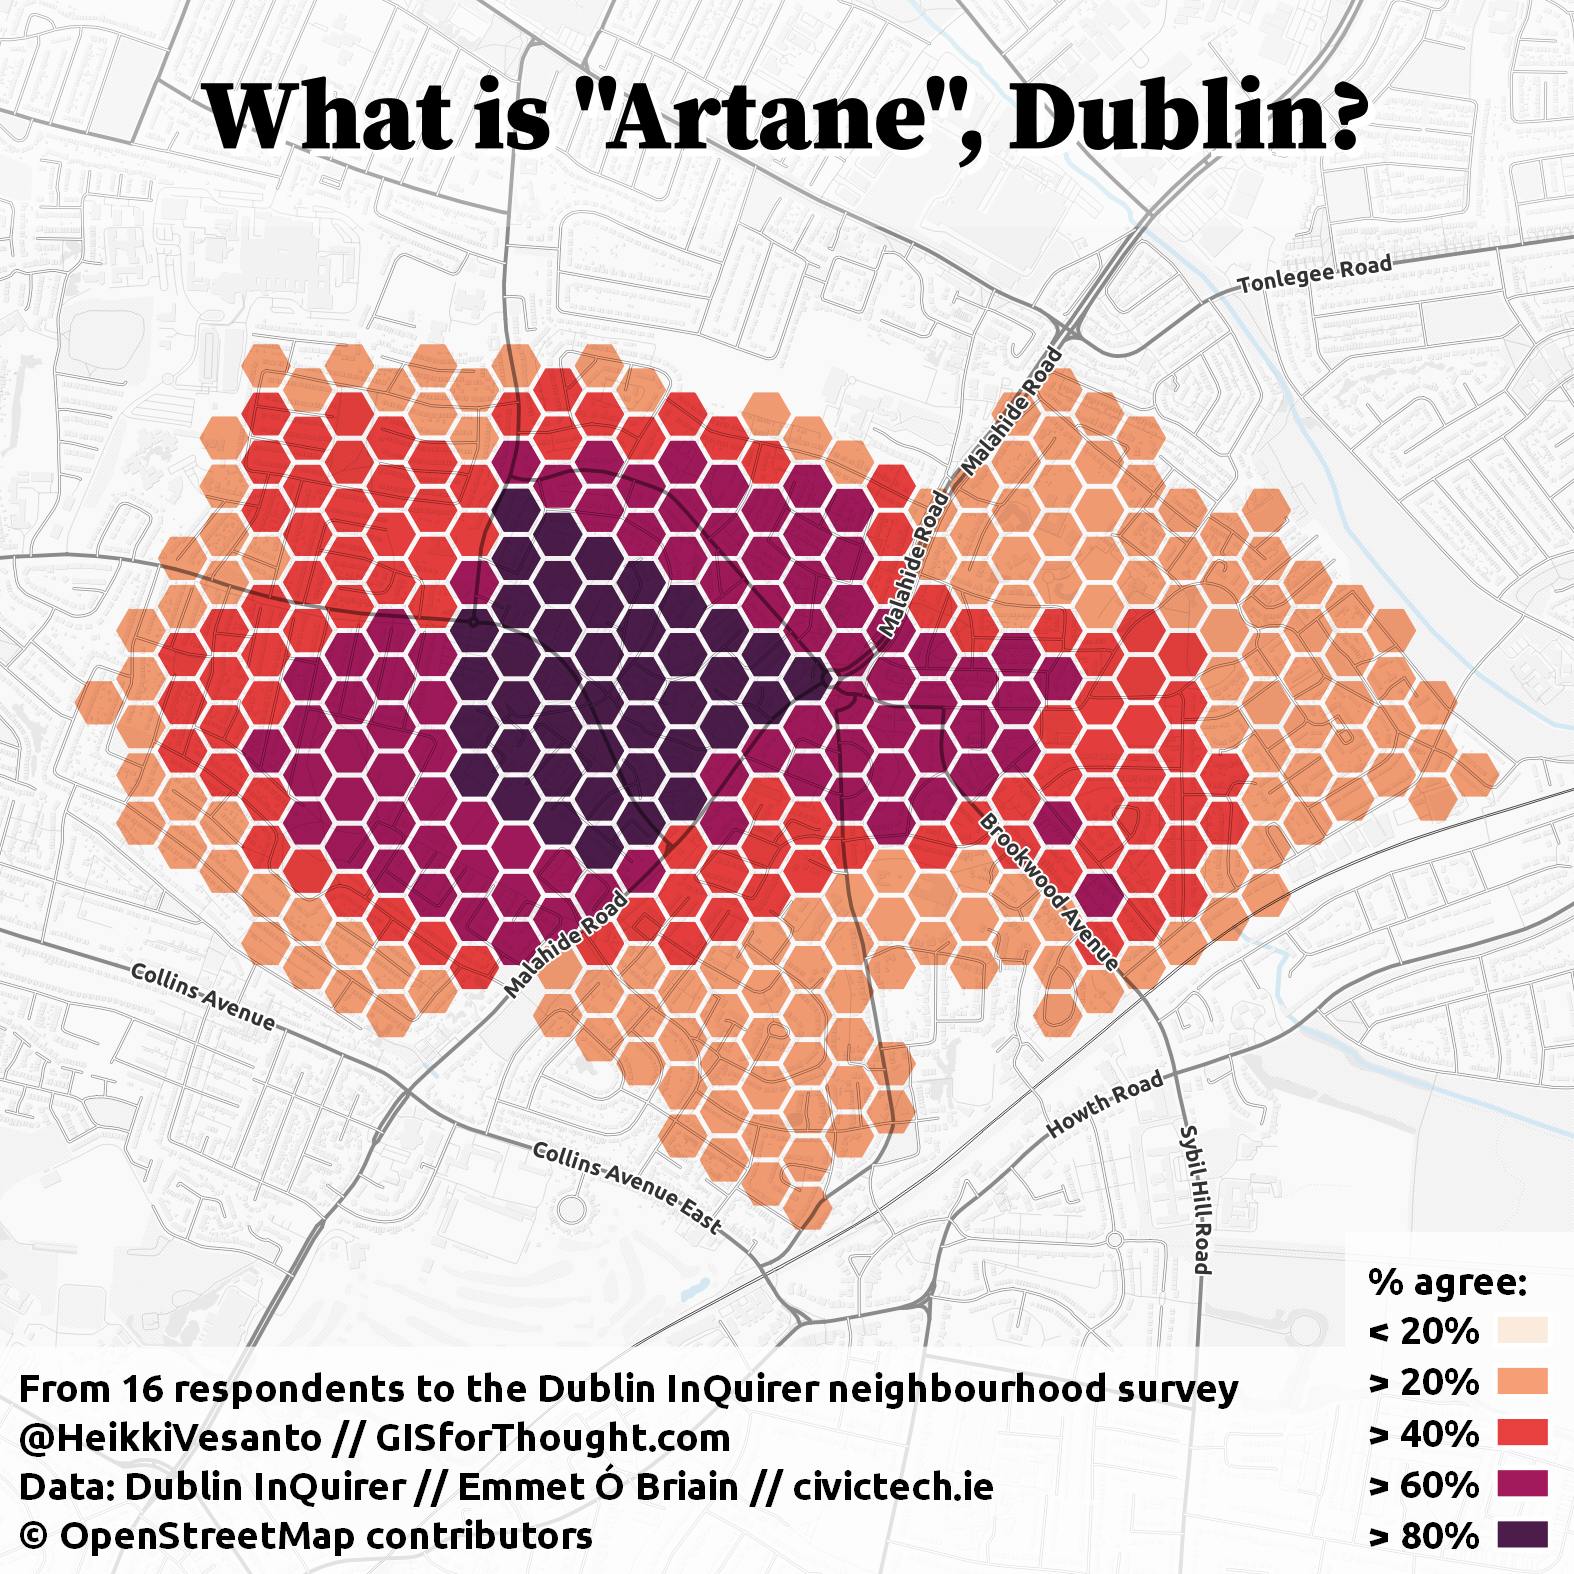
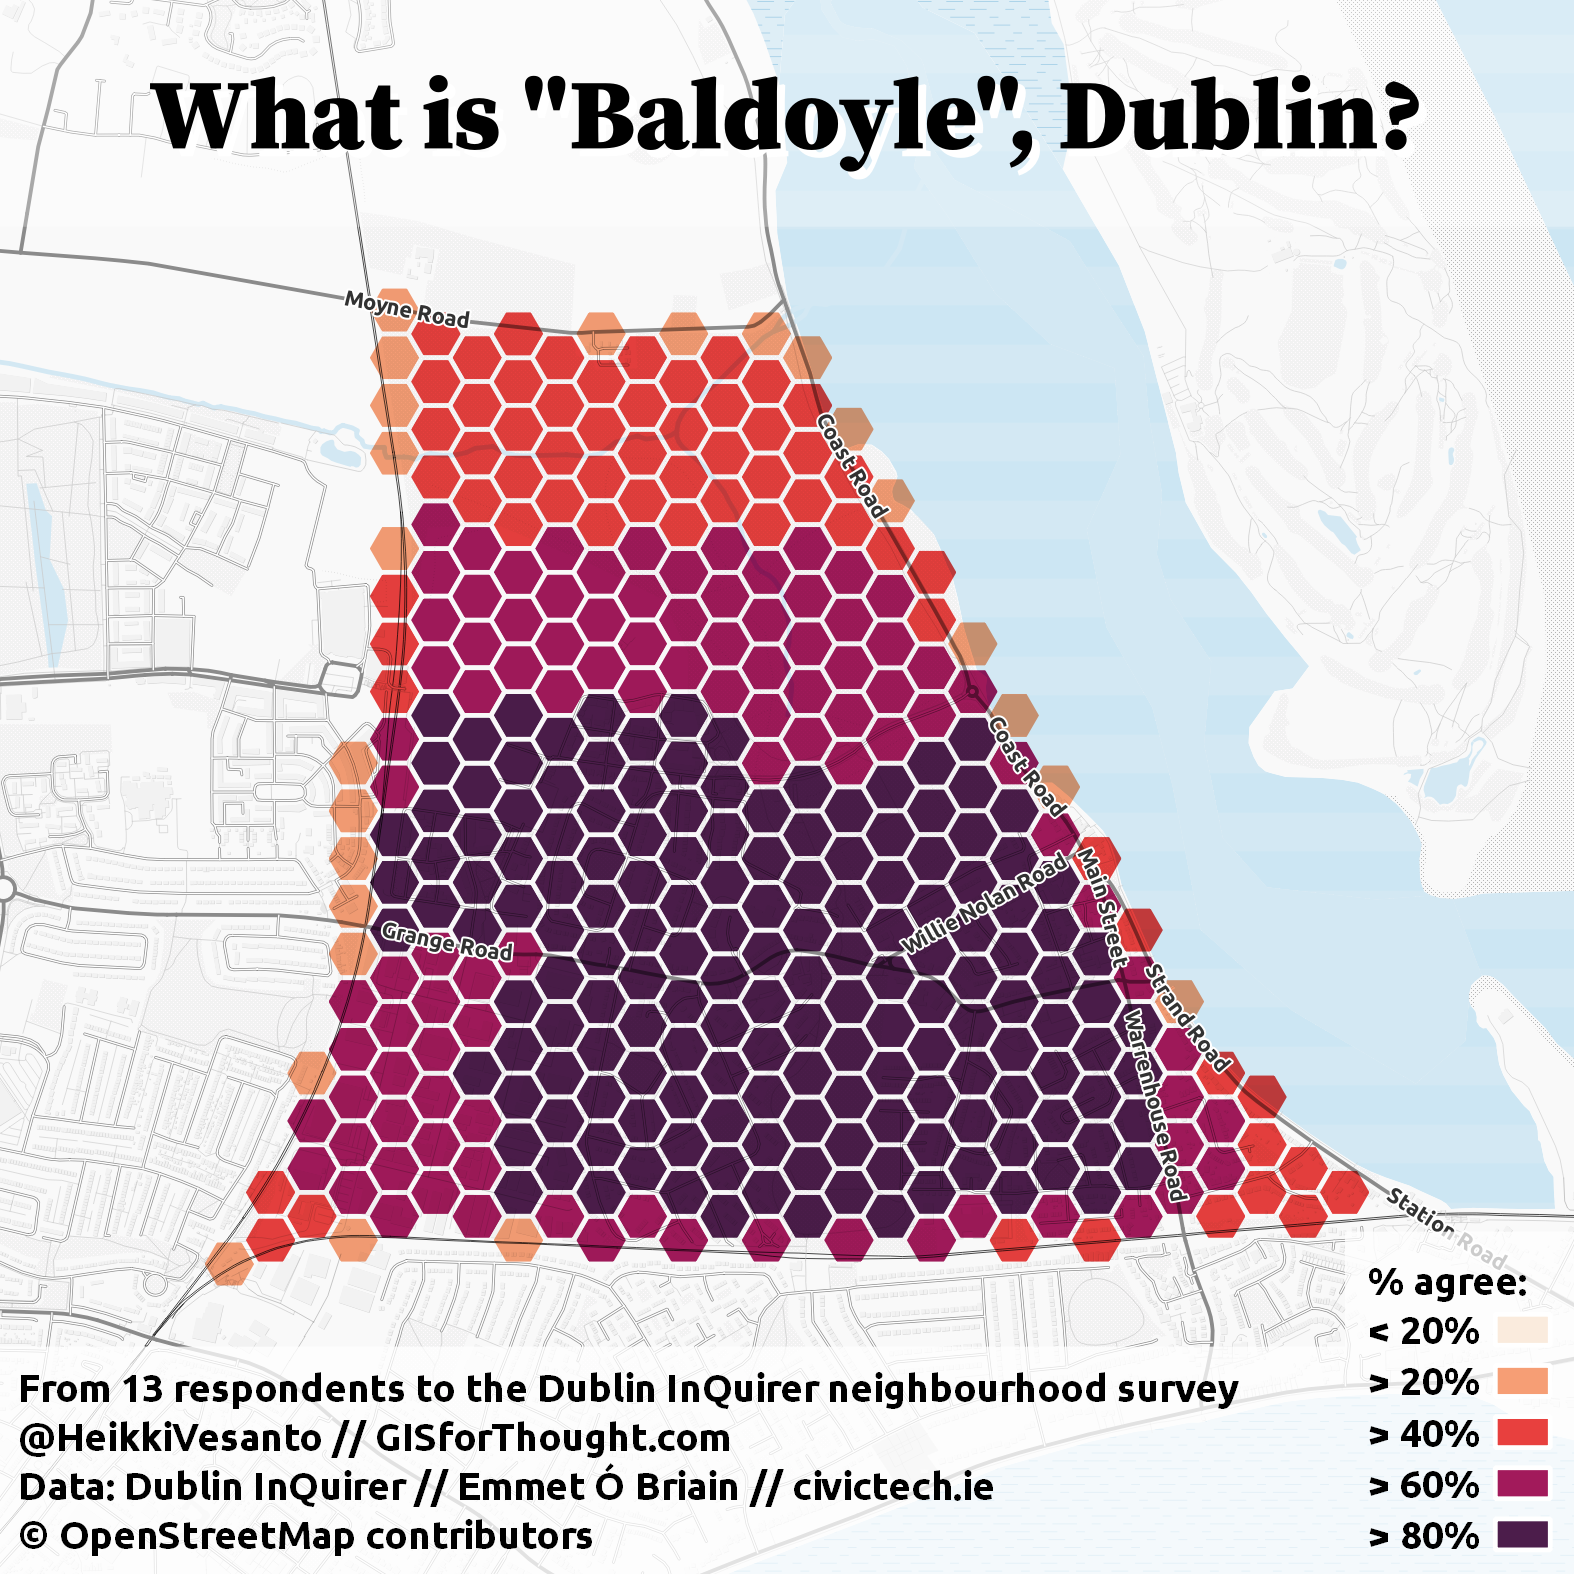
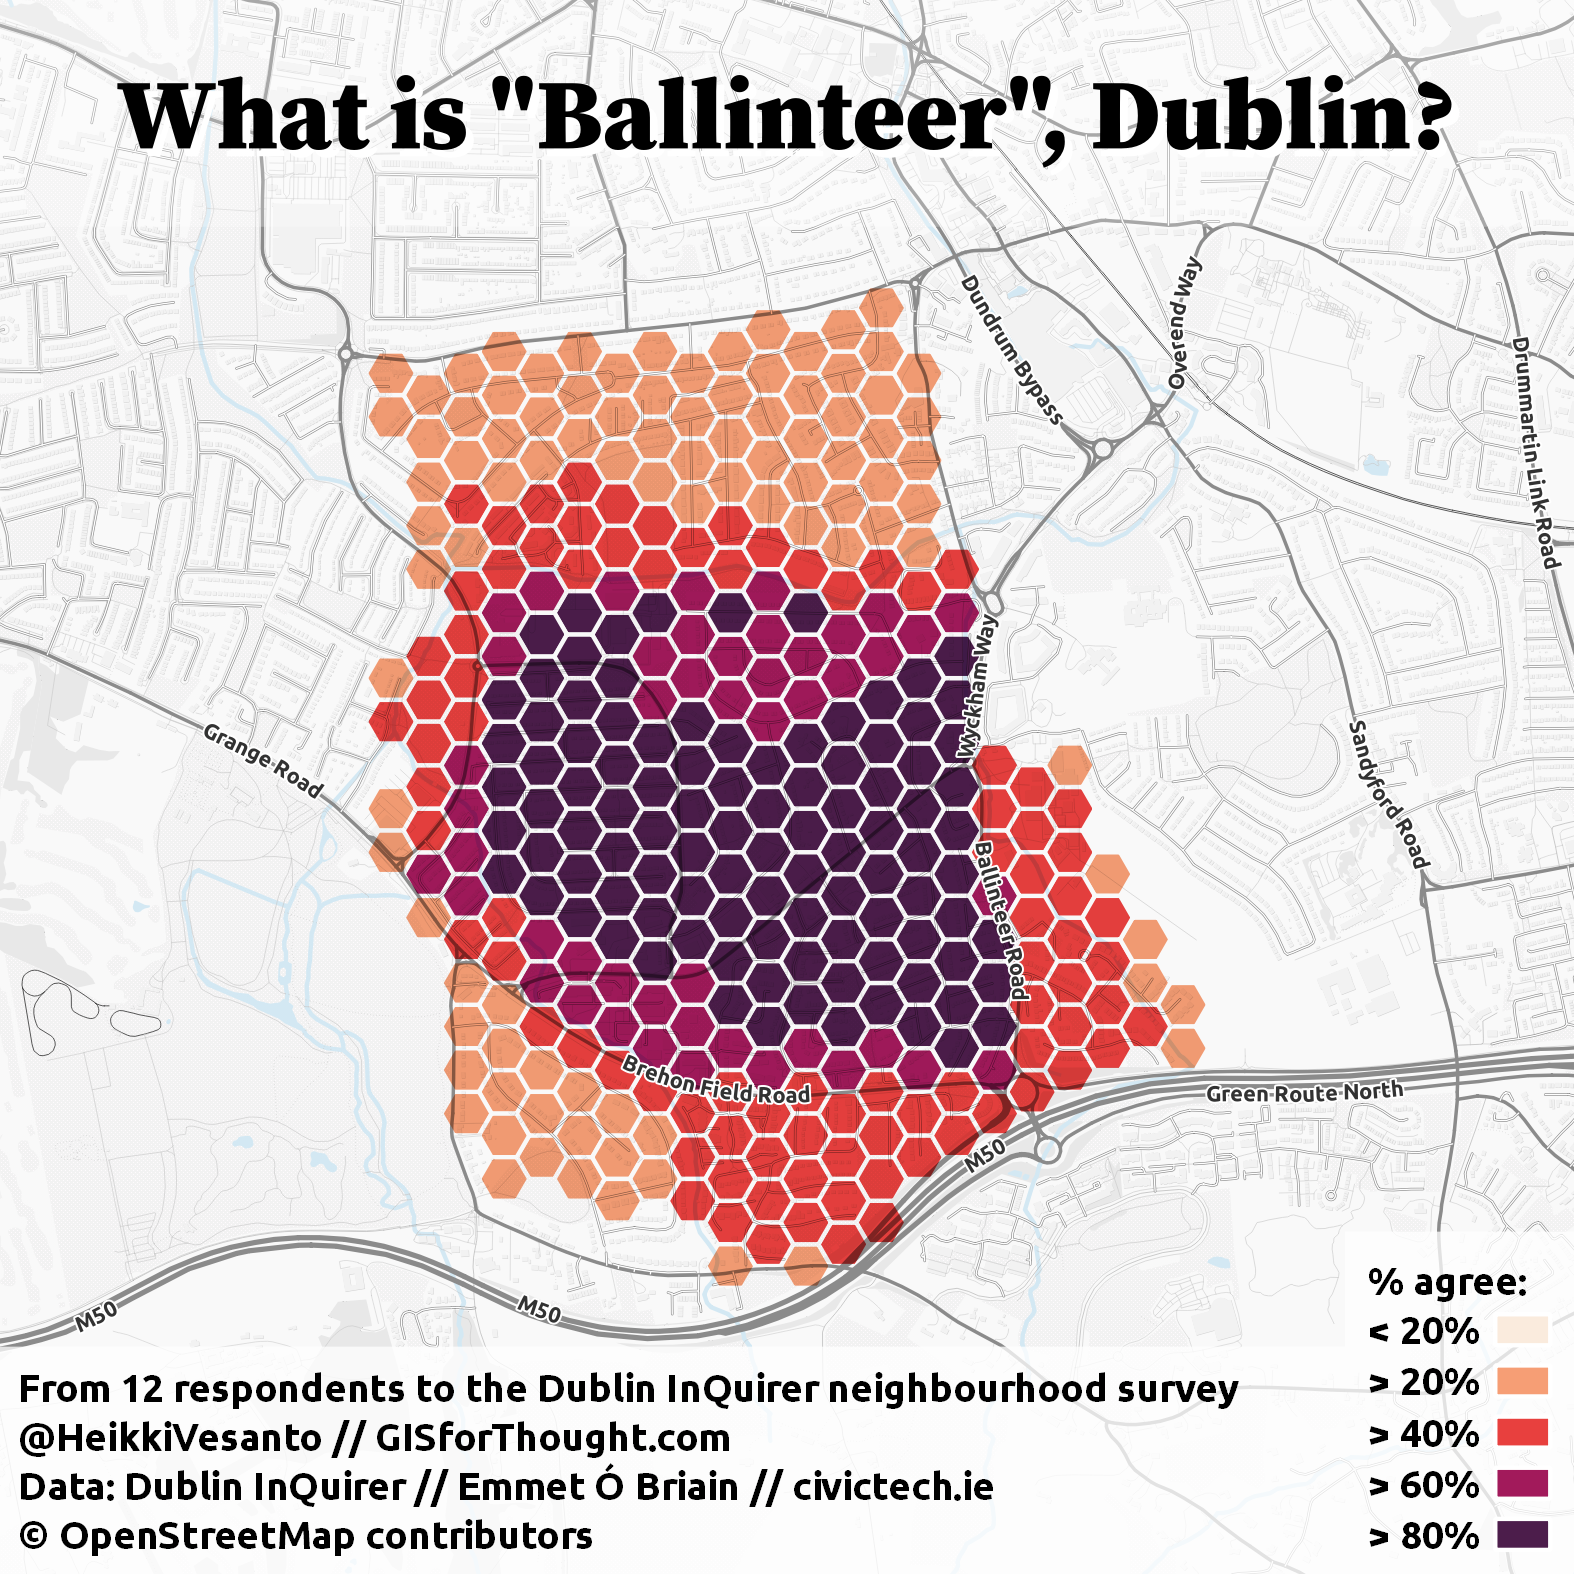
I have mapped all of the neighborhoods as an interactive map, and individually if they had 10 or more responses.
Interactive:
Individual Dublin Hoods:
The following have been mapped as they had over 10 responses:
Artane,
Baldoyle,
Ballinteer,
Ballsbridge,
Ballybough,
Ballyfermot,
Beaumont,
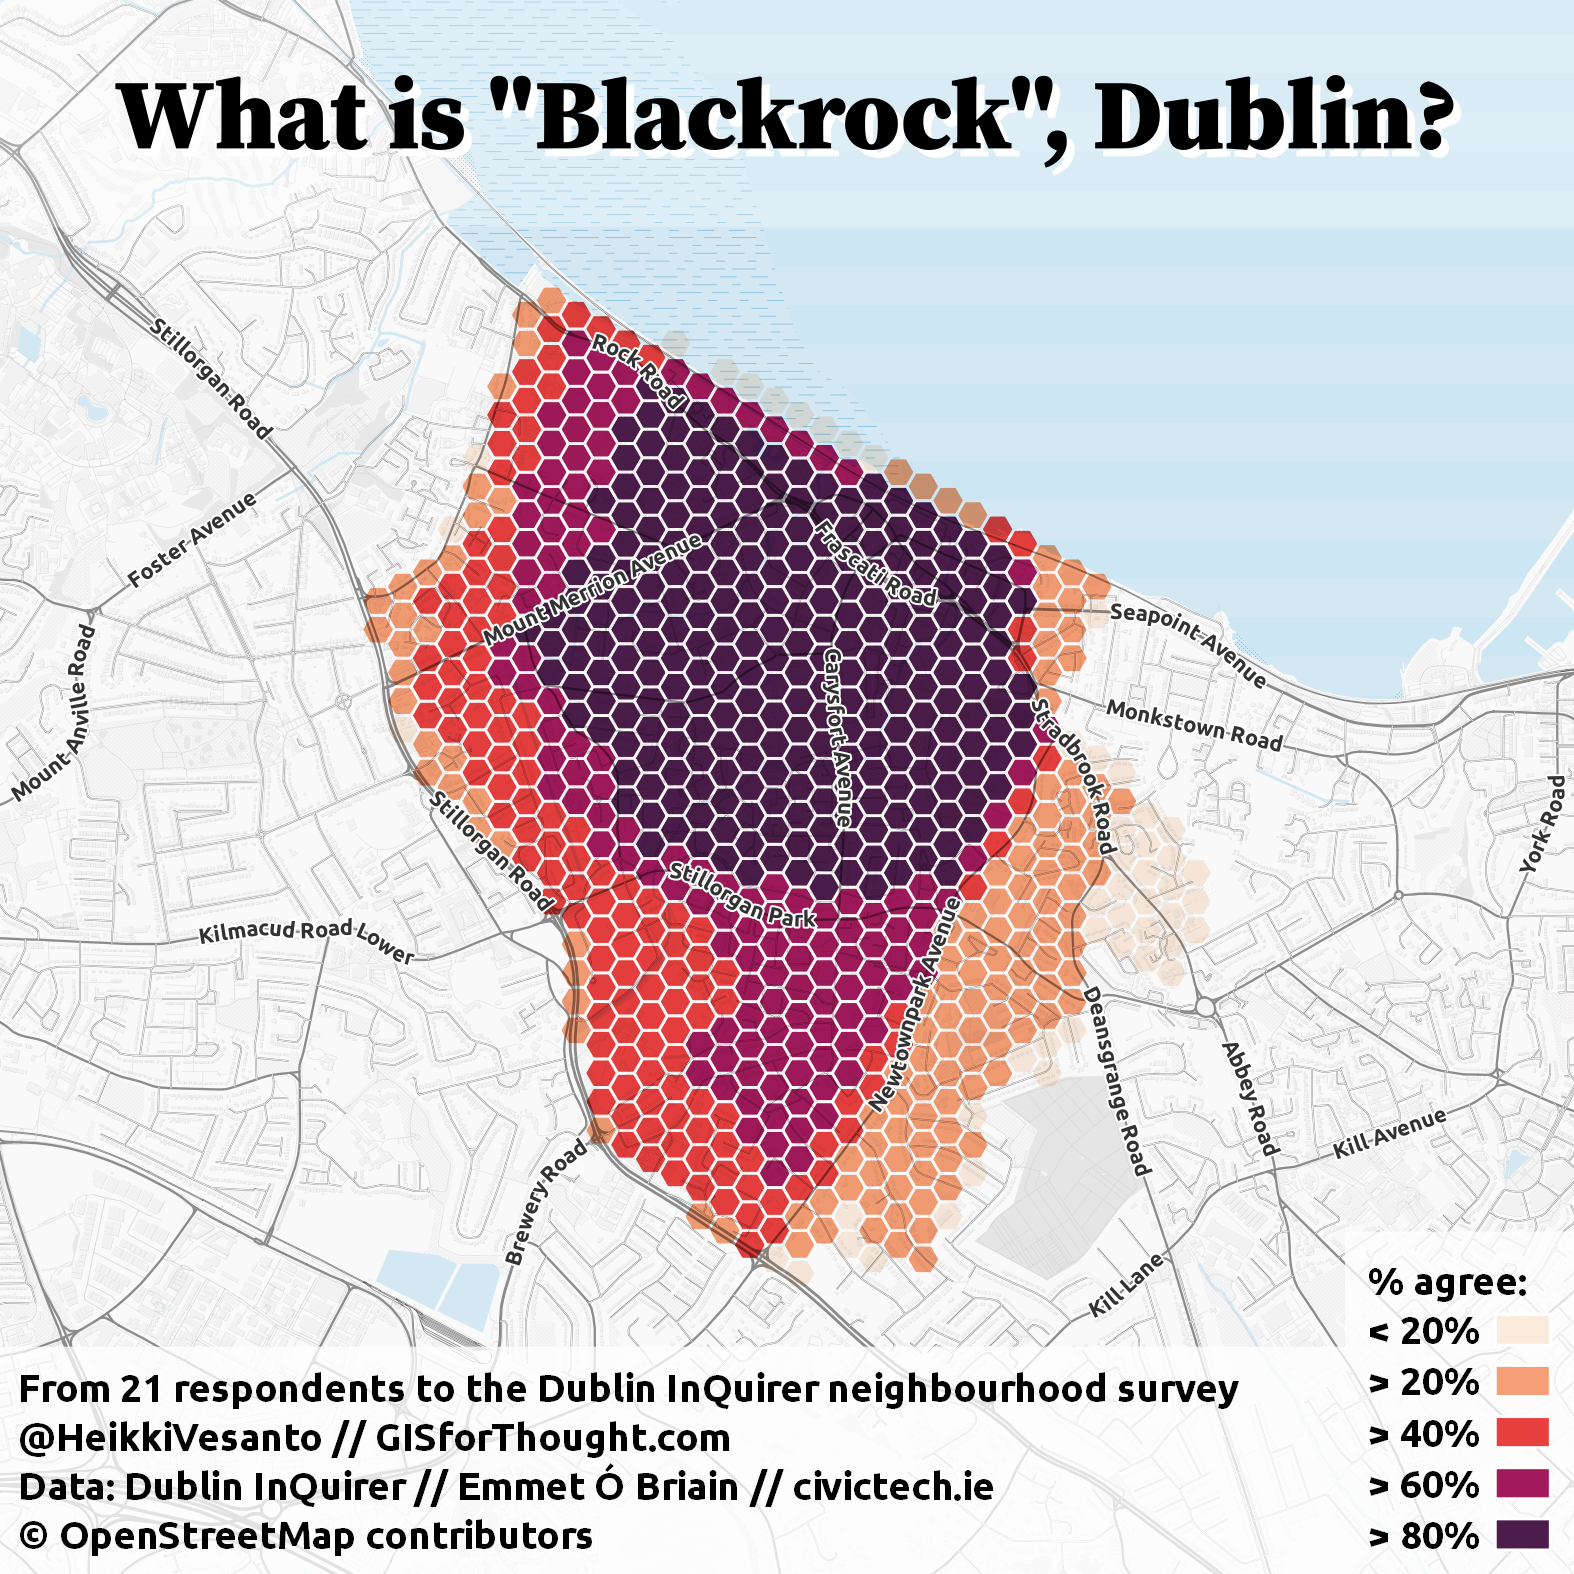
Blackrock,
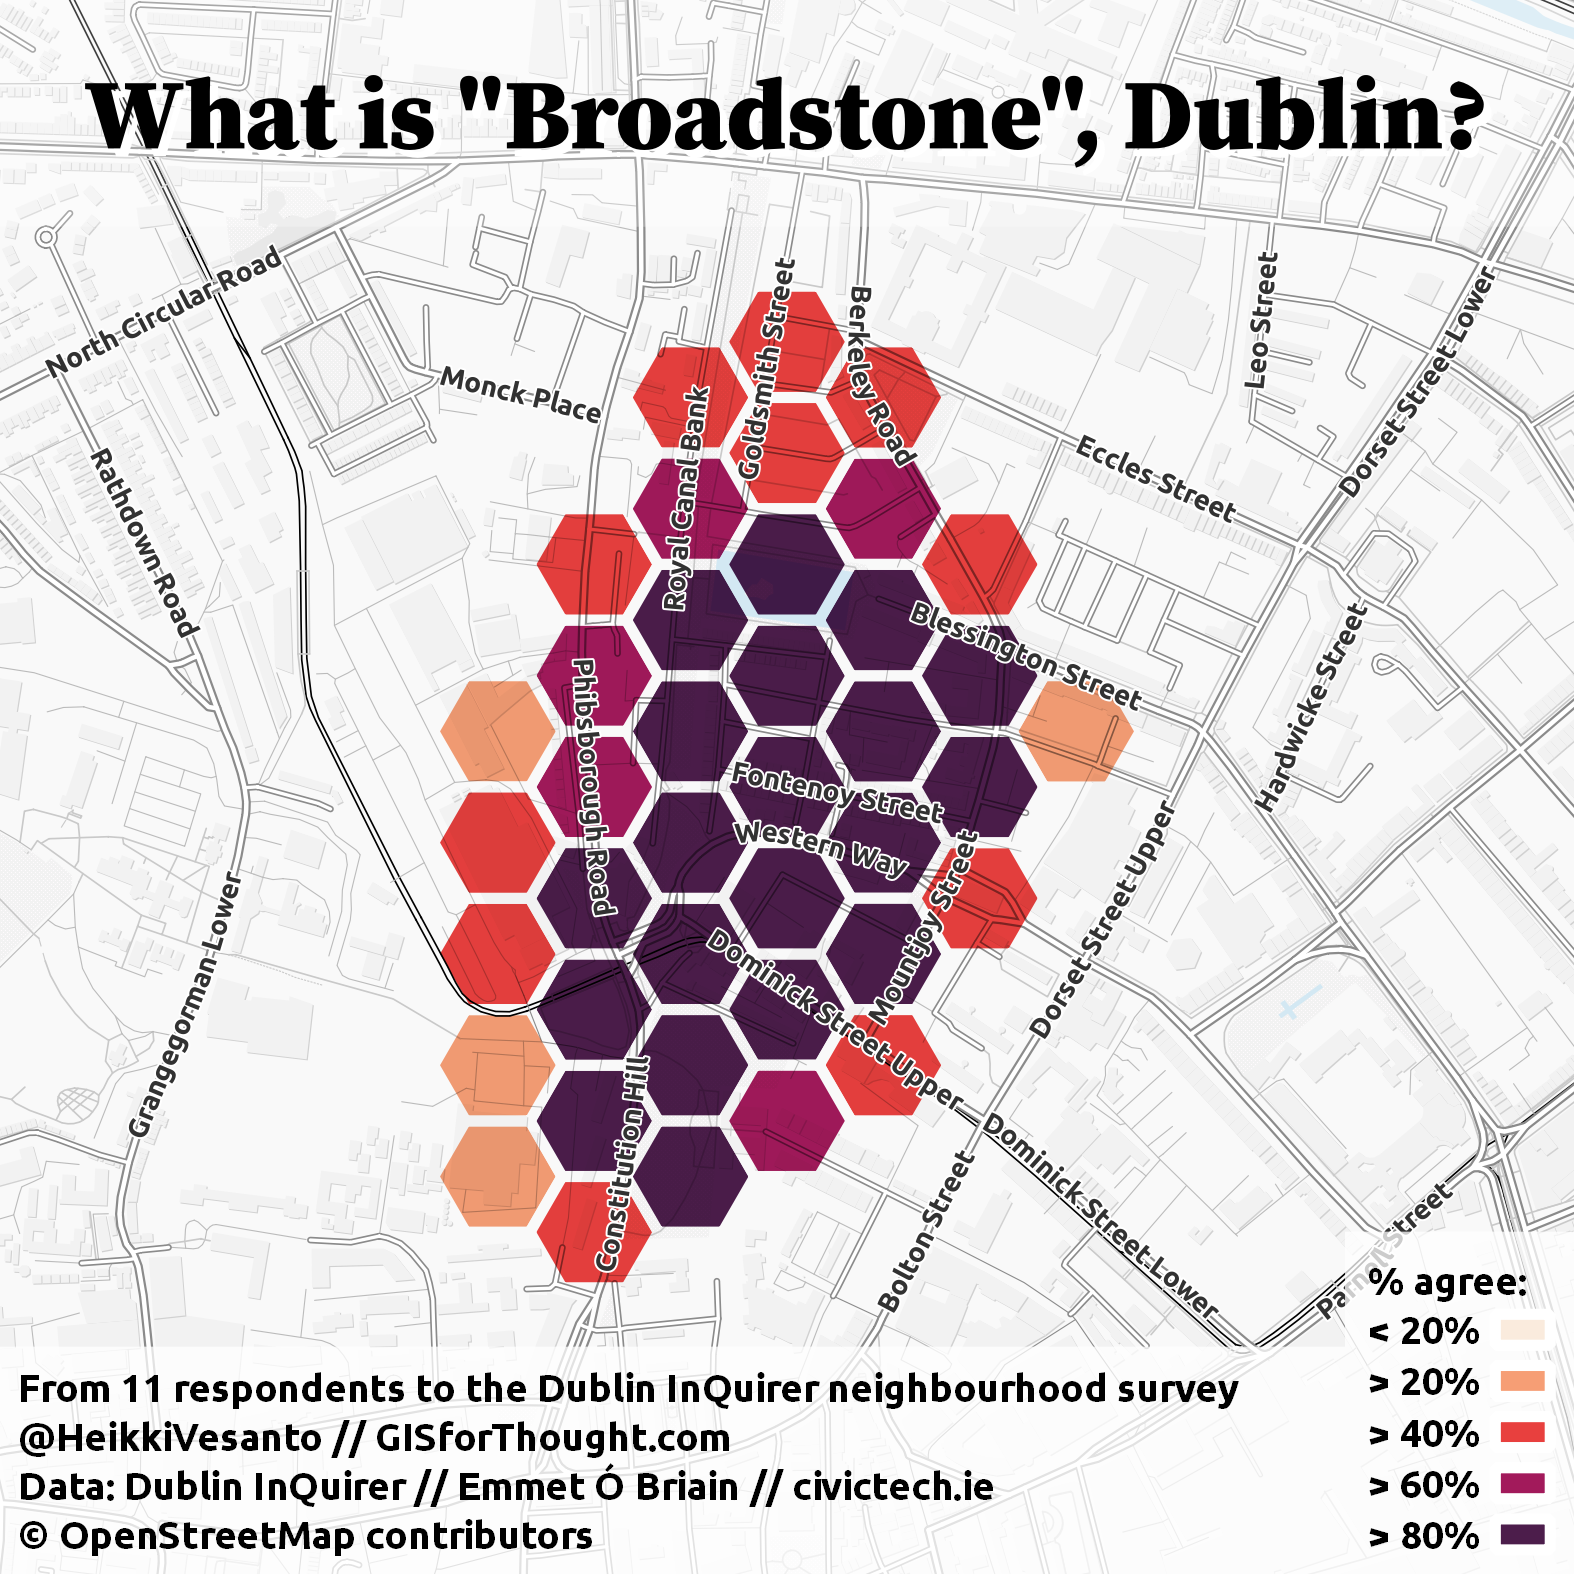
Broadstone,
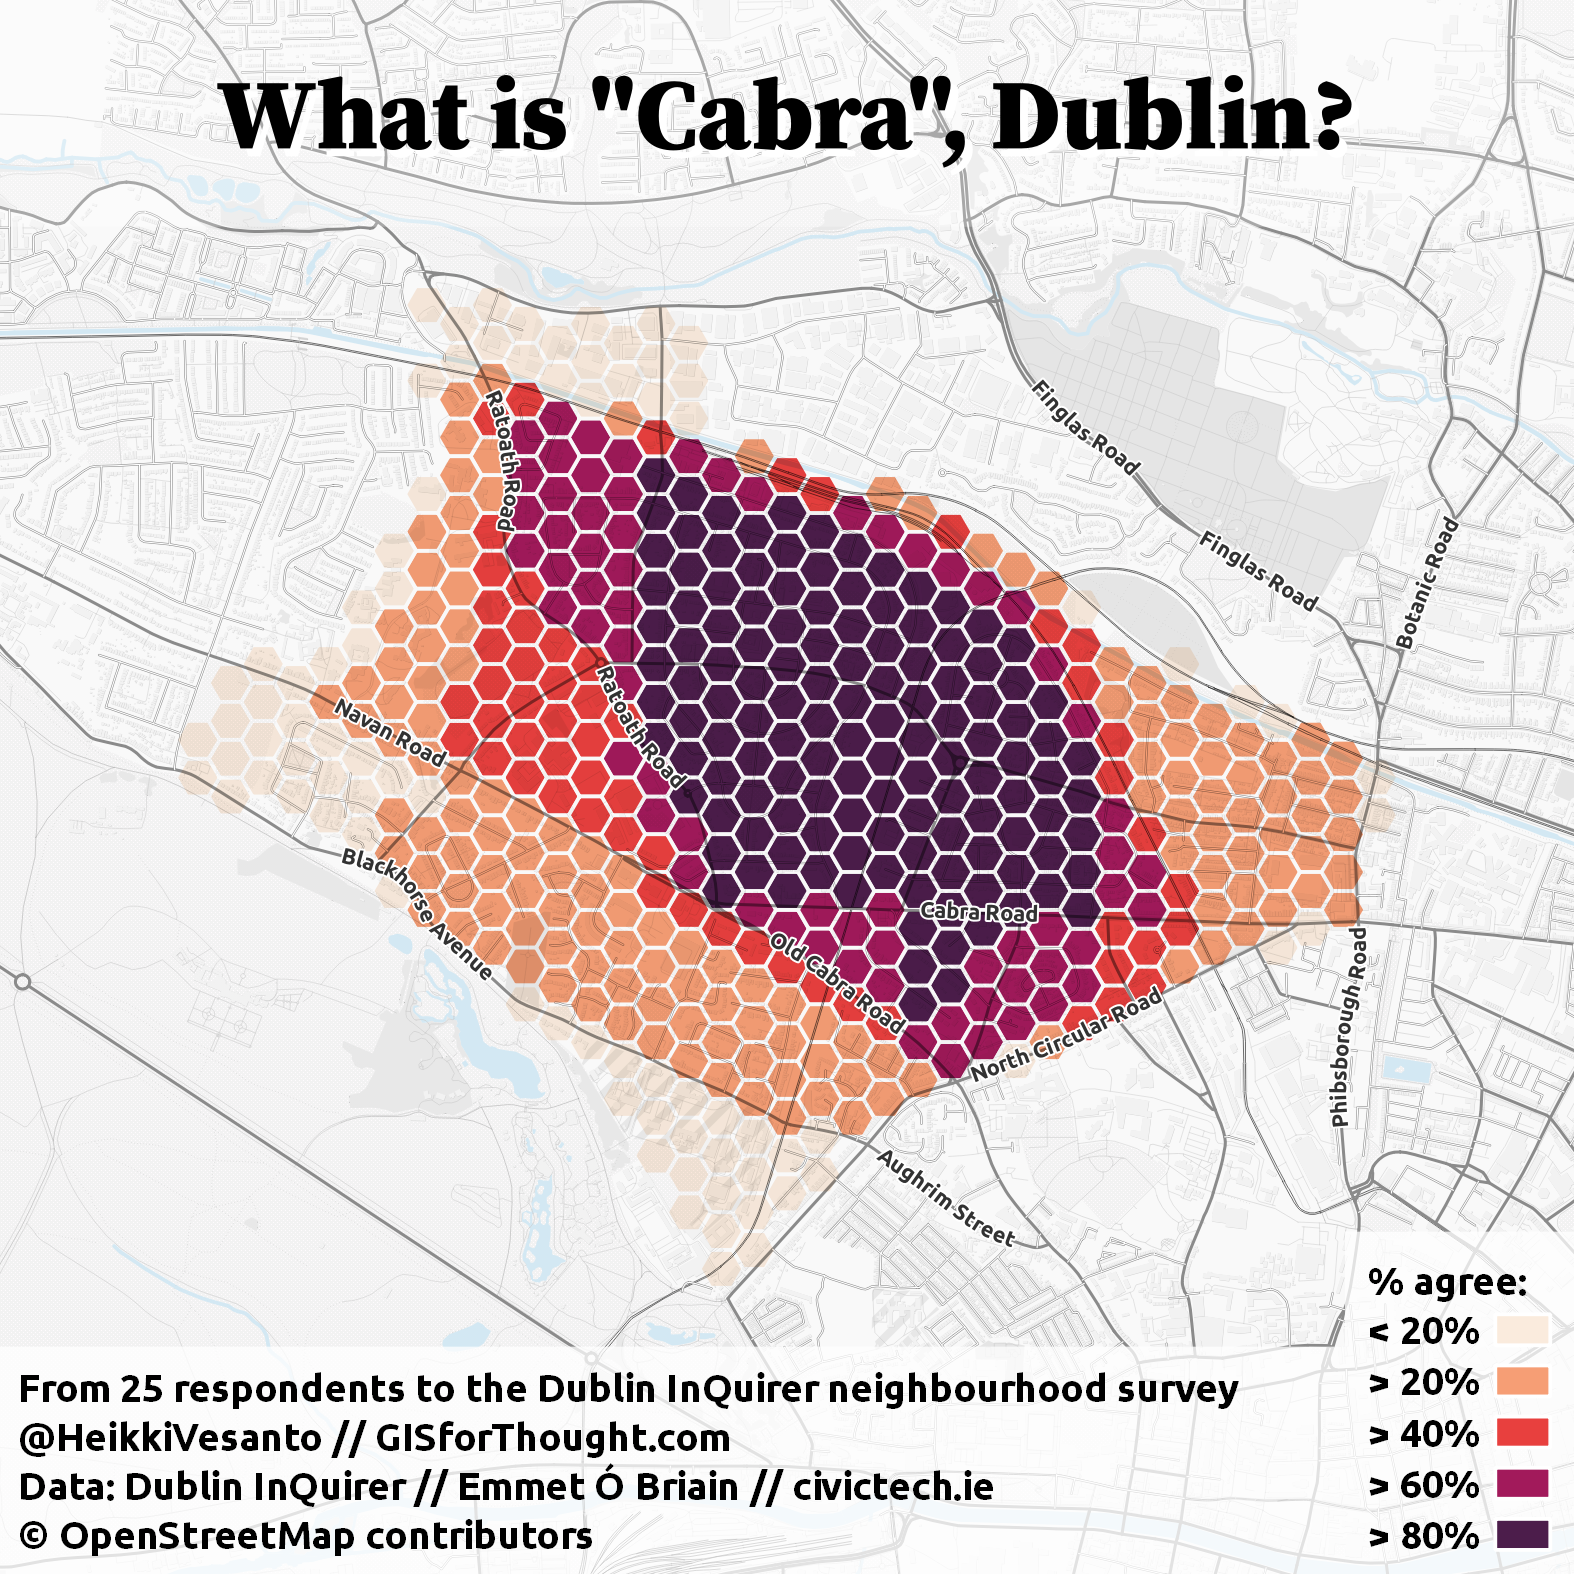
Cabra,
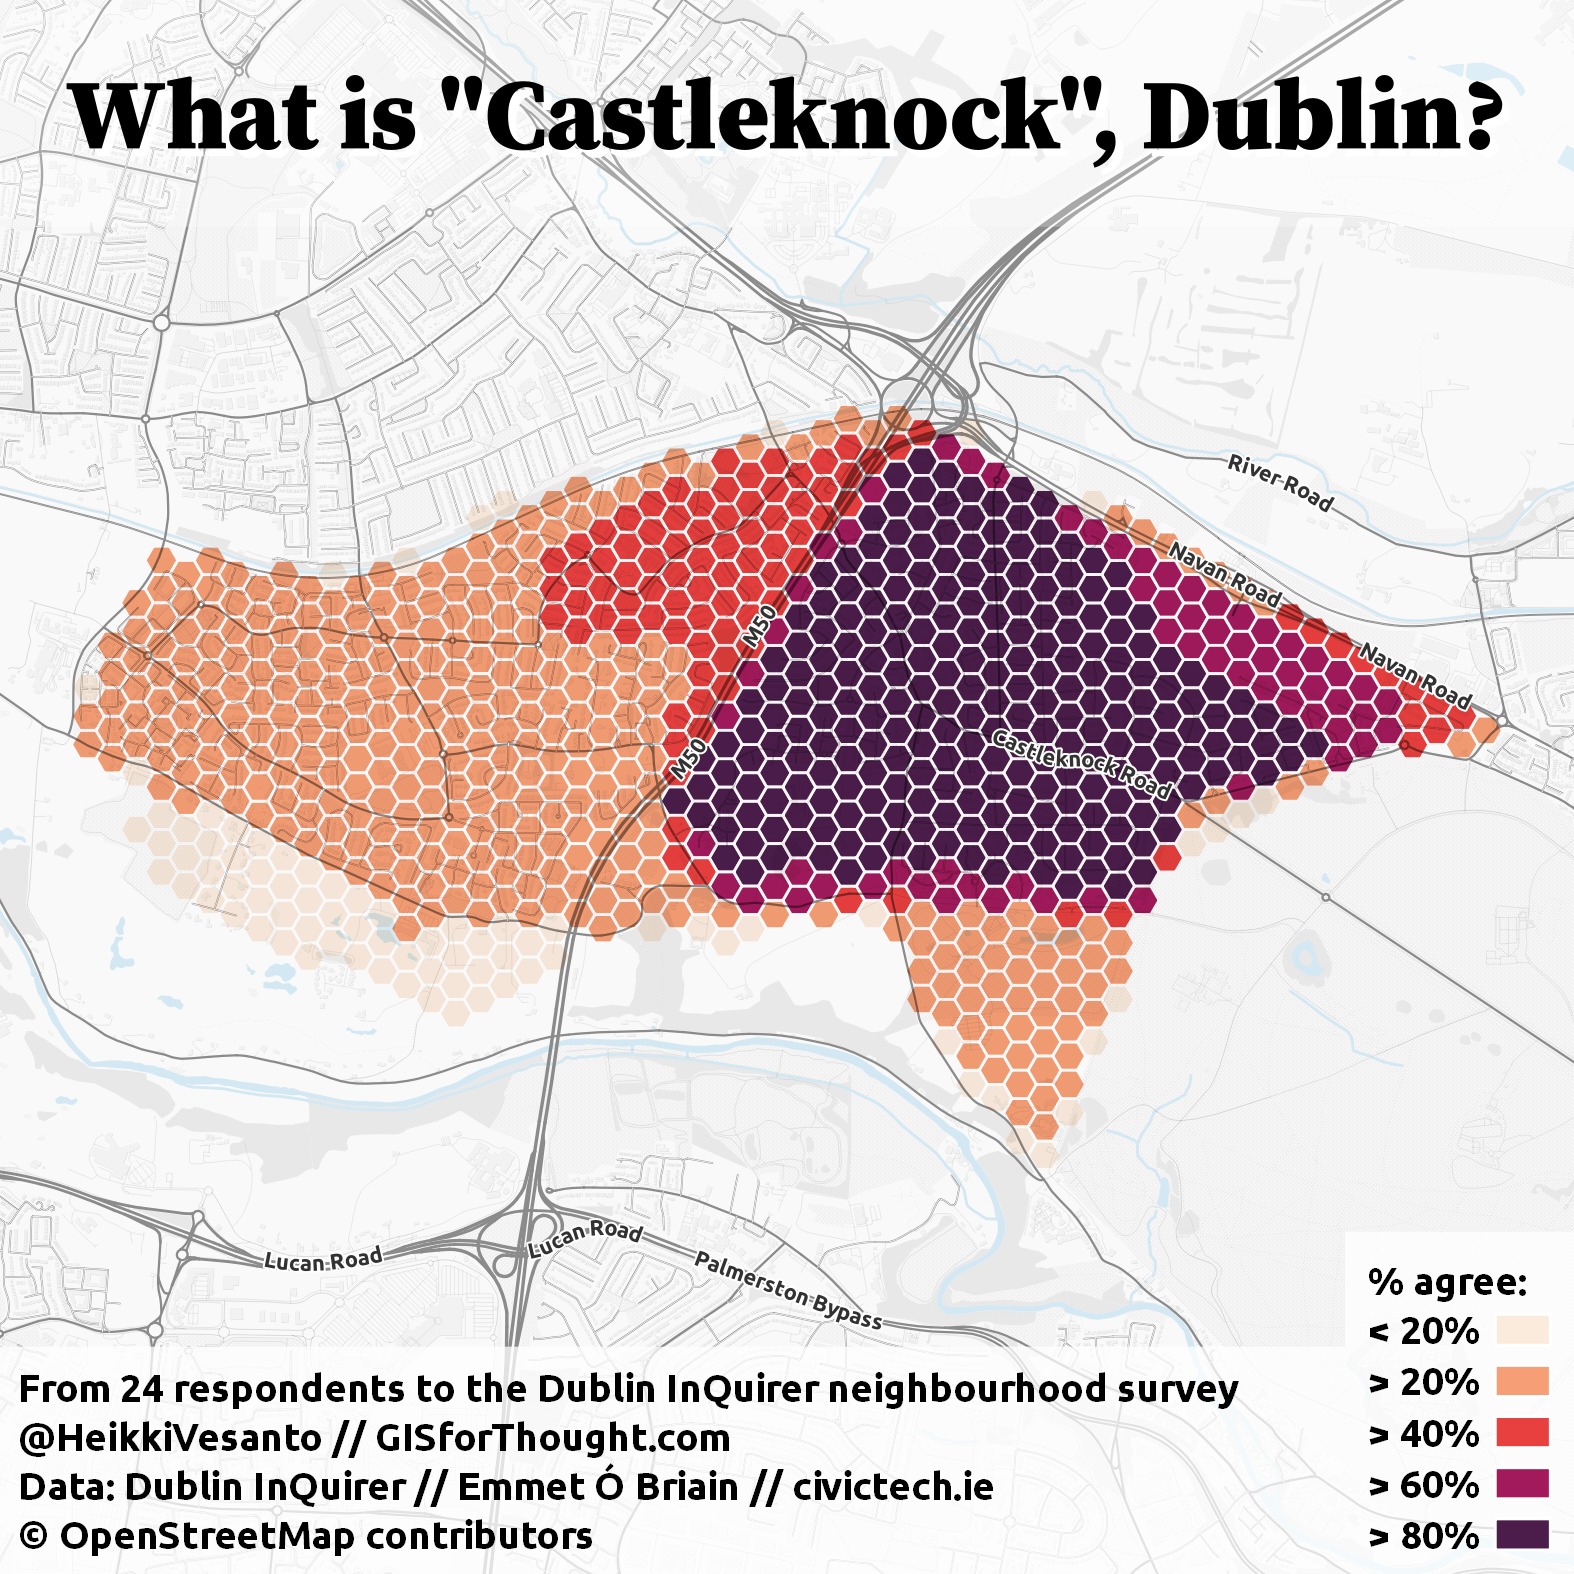
Castleknock,
Churchtown,
Clondalkin,
Clontarf,
Crumlin,
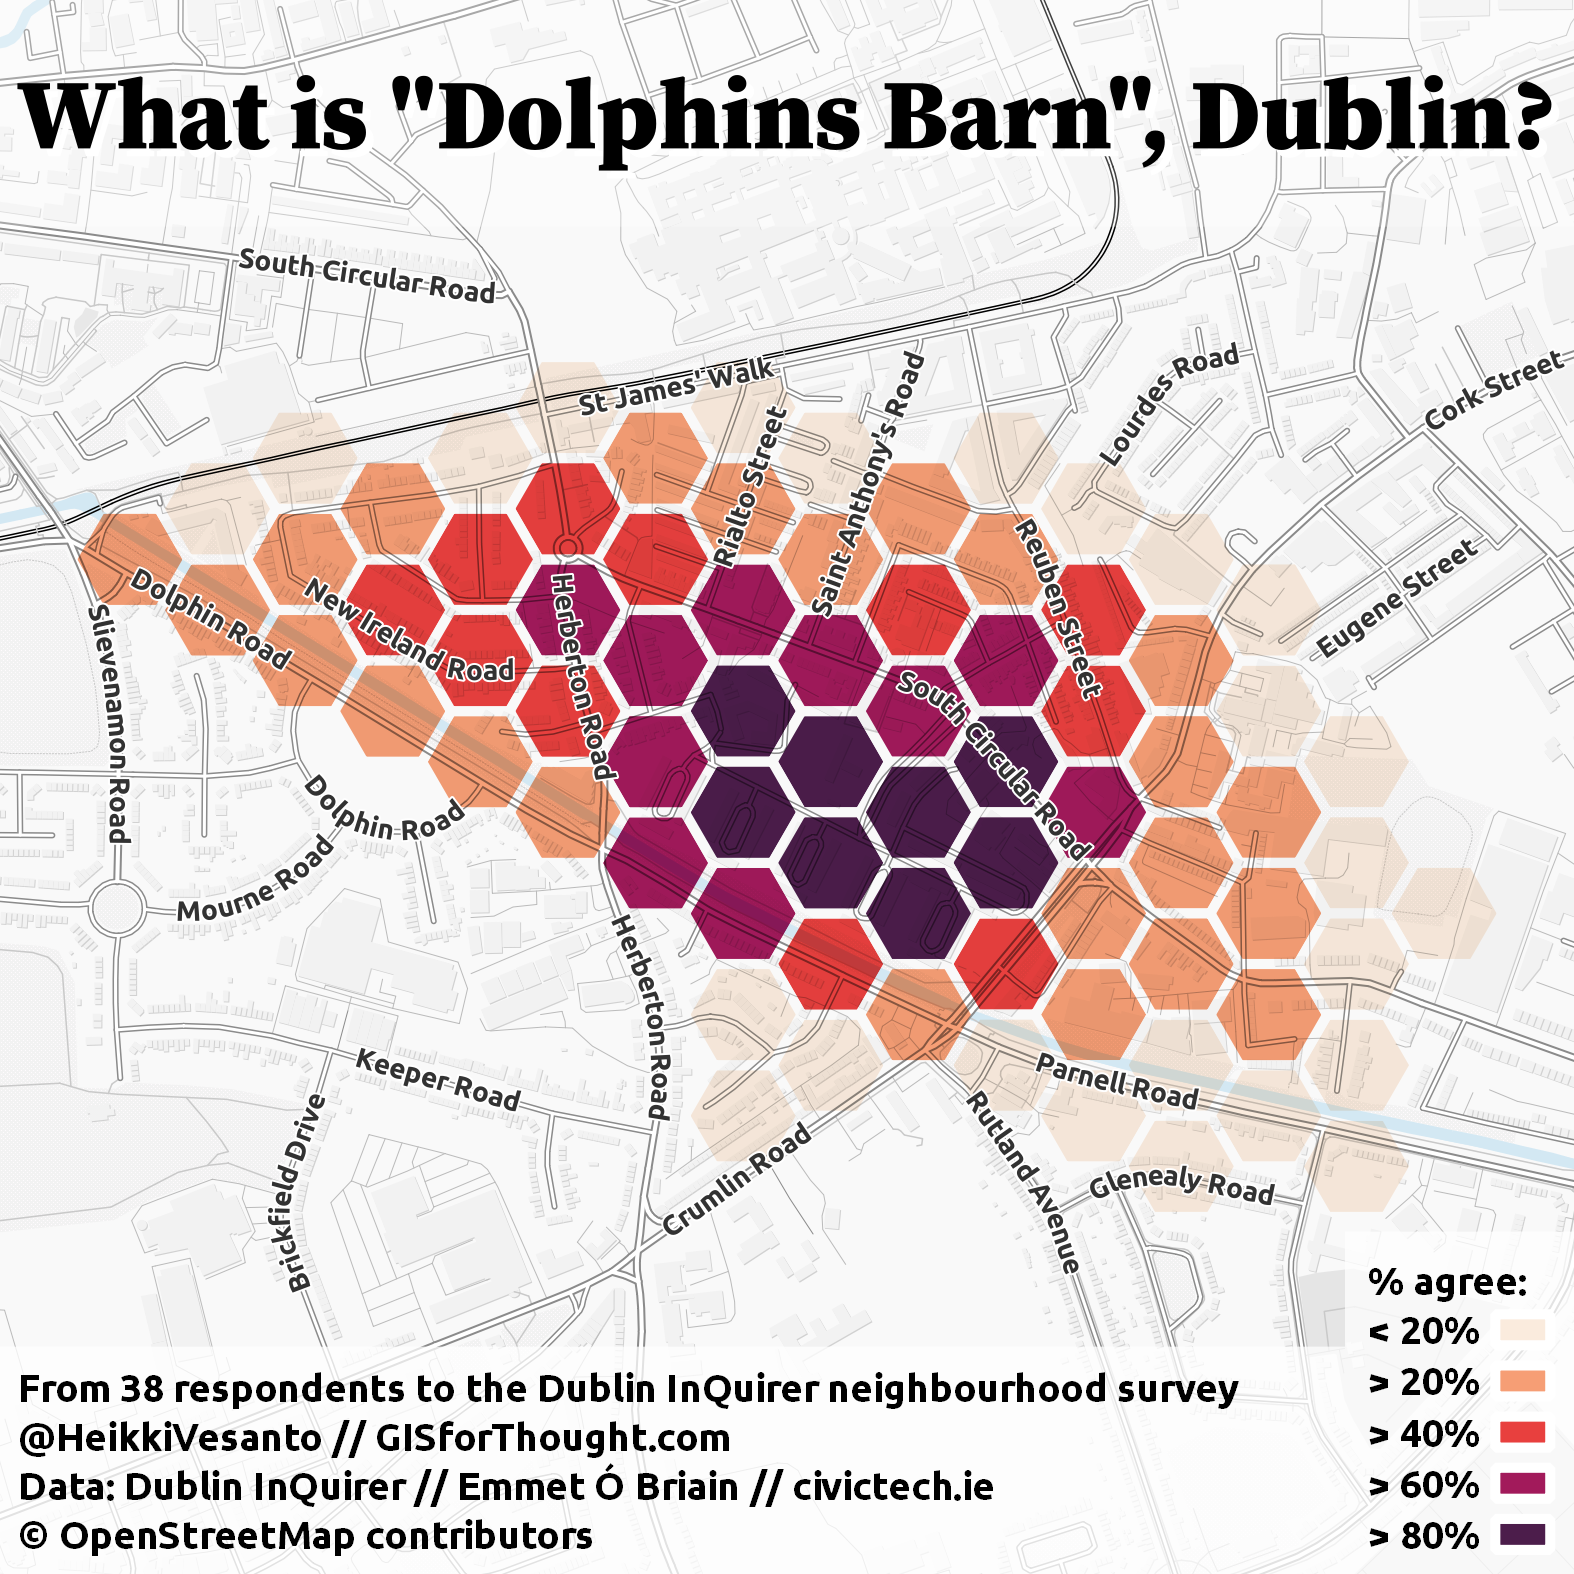
Dolphins Barn,
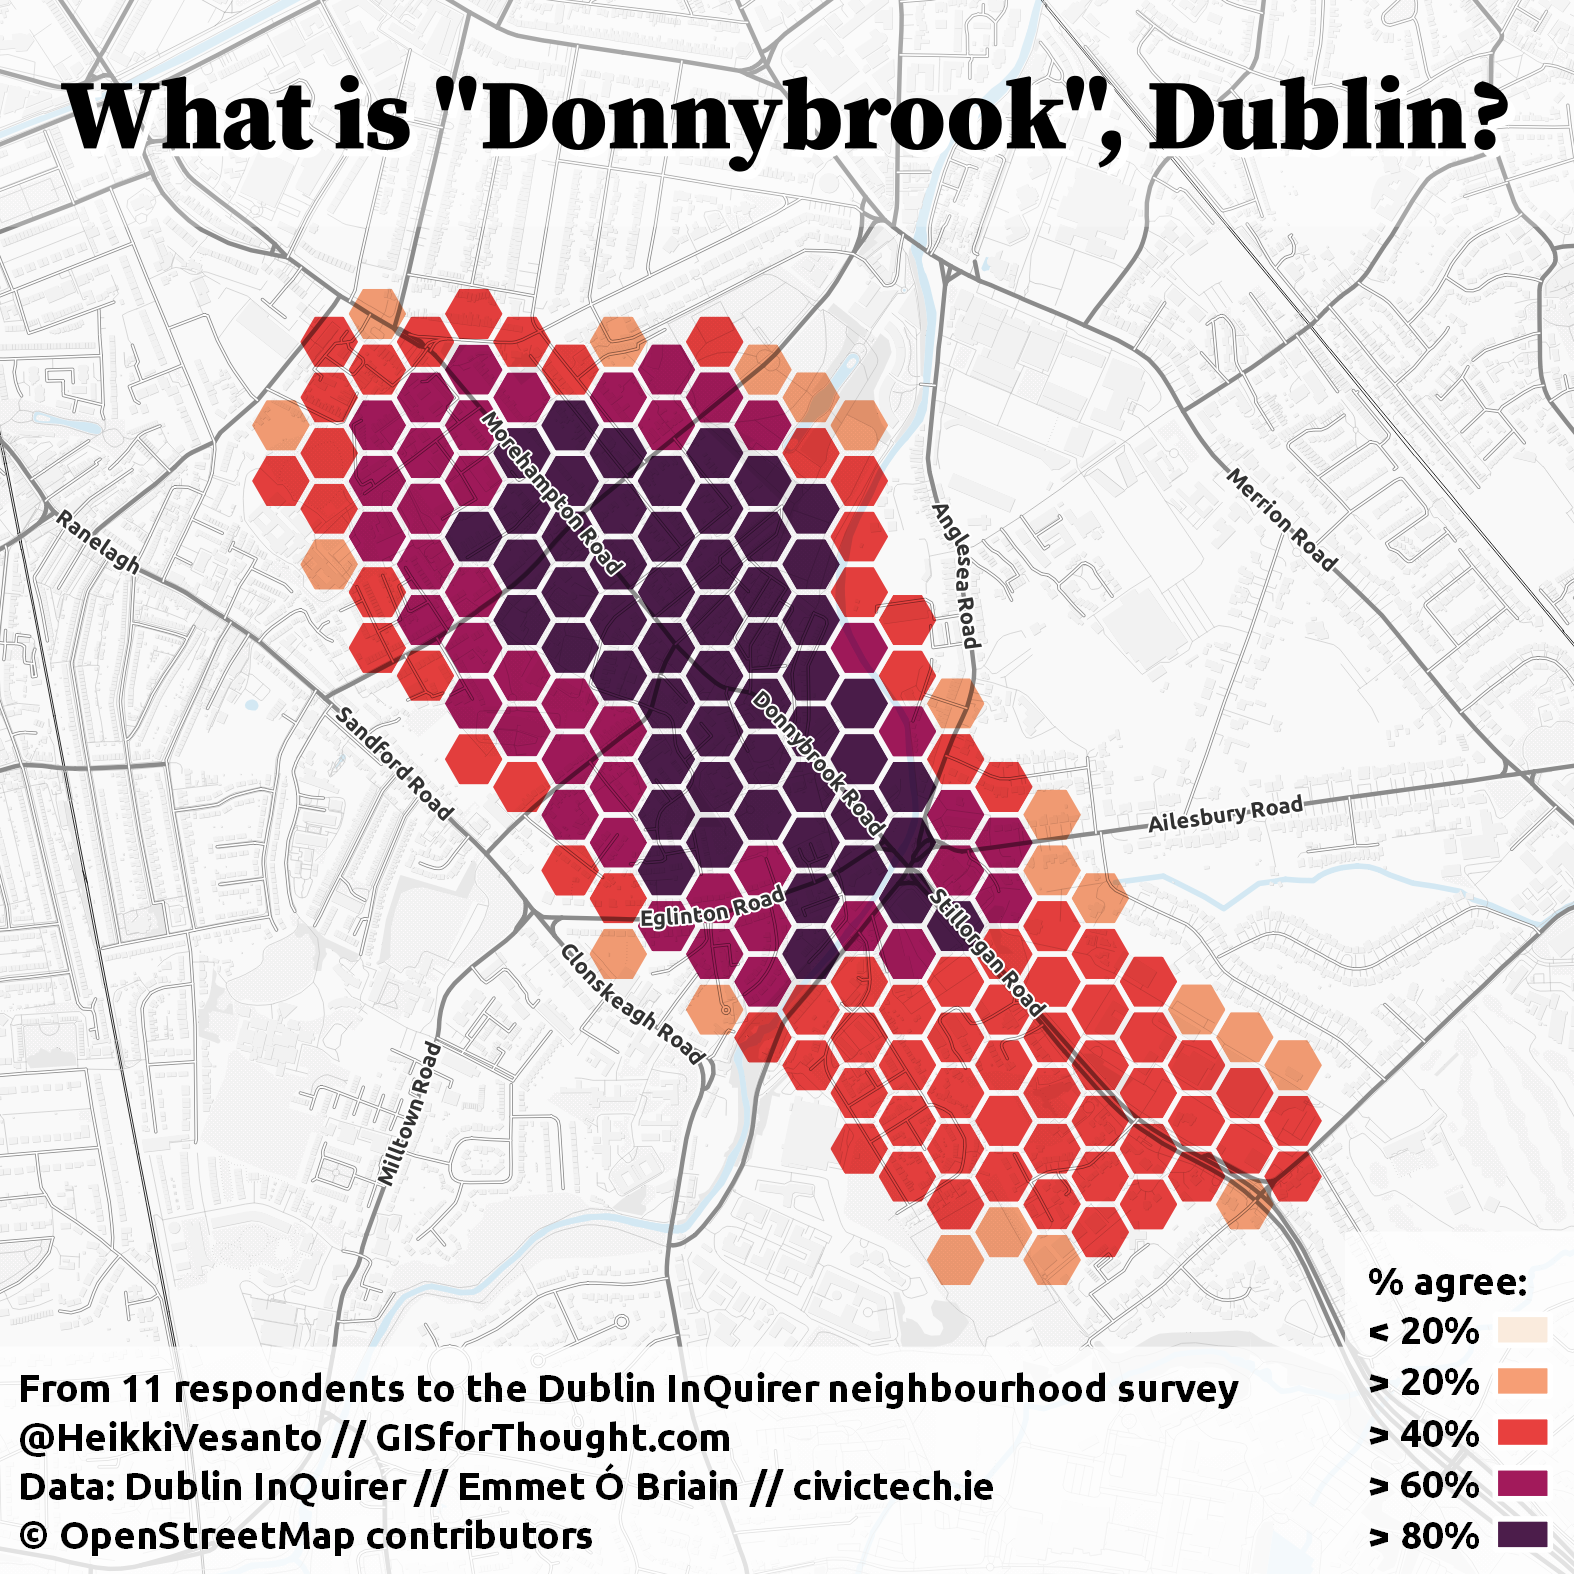
Donnybrook,
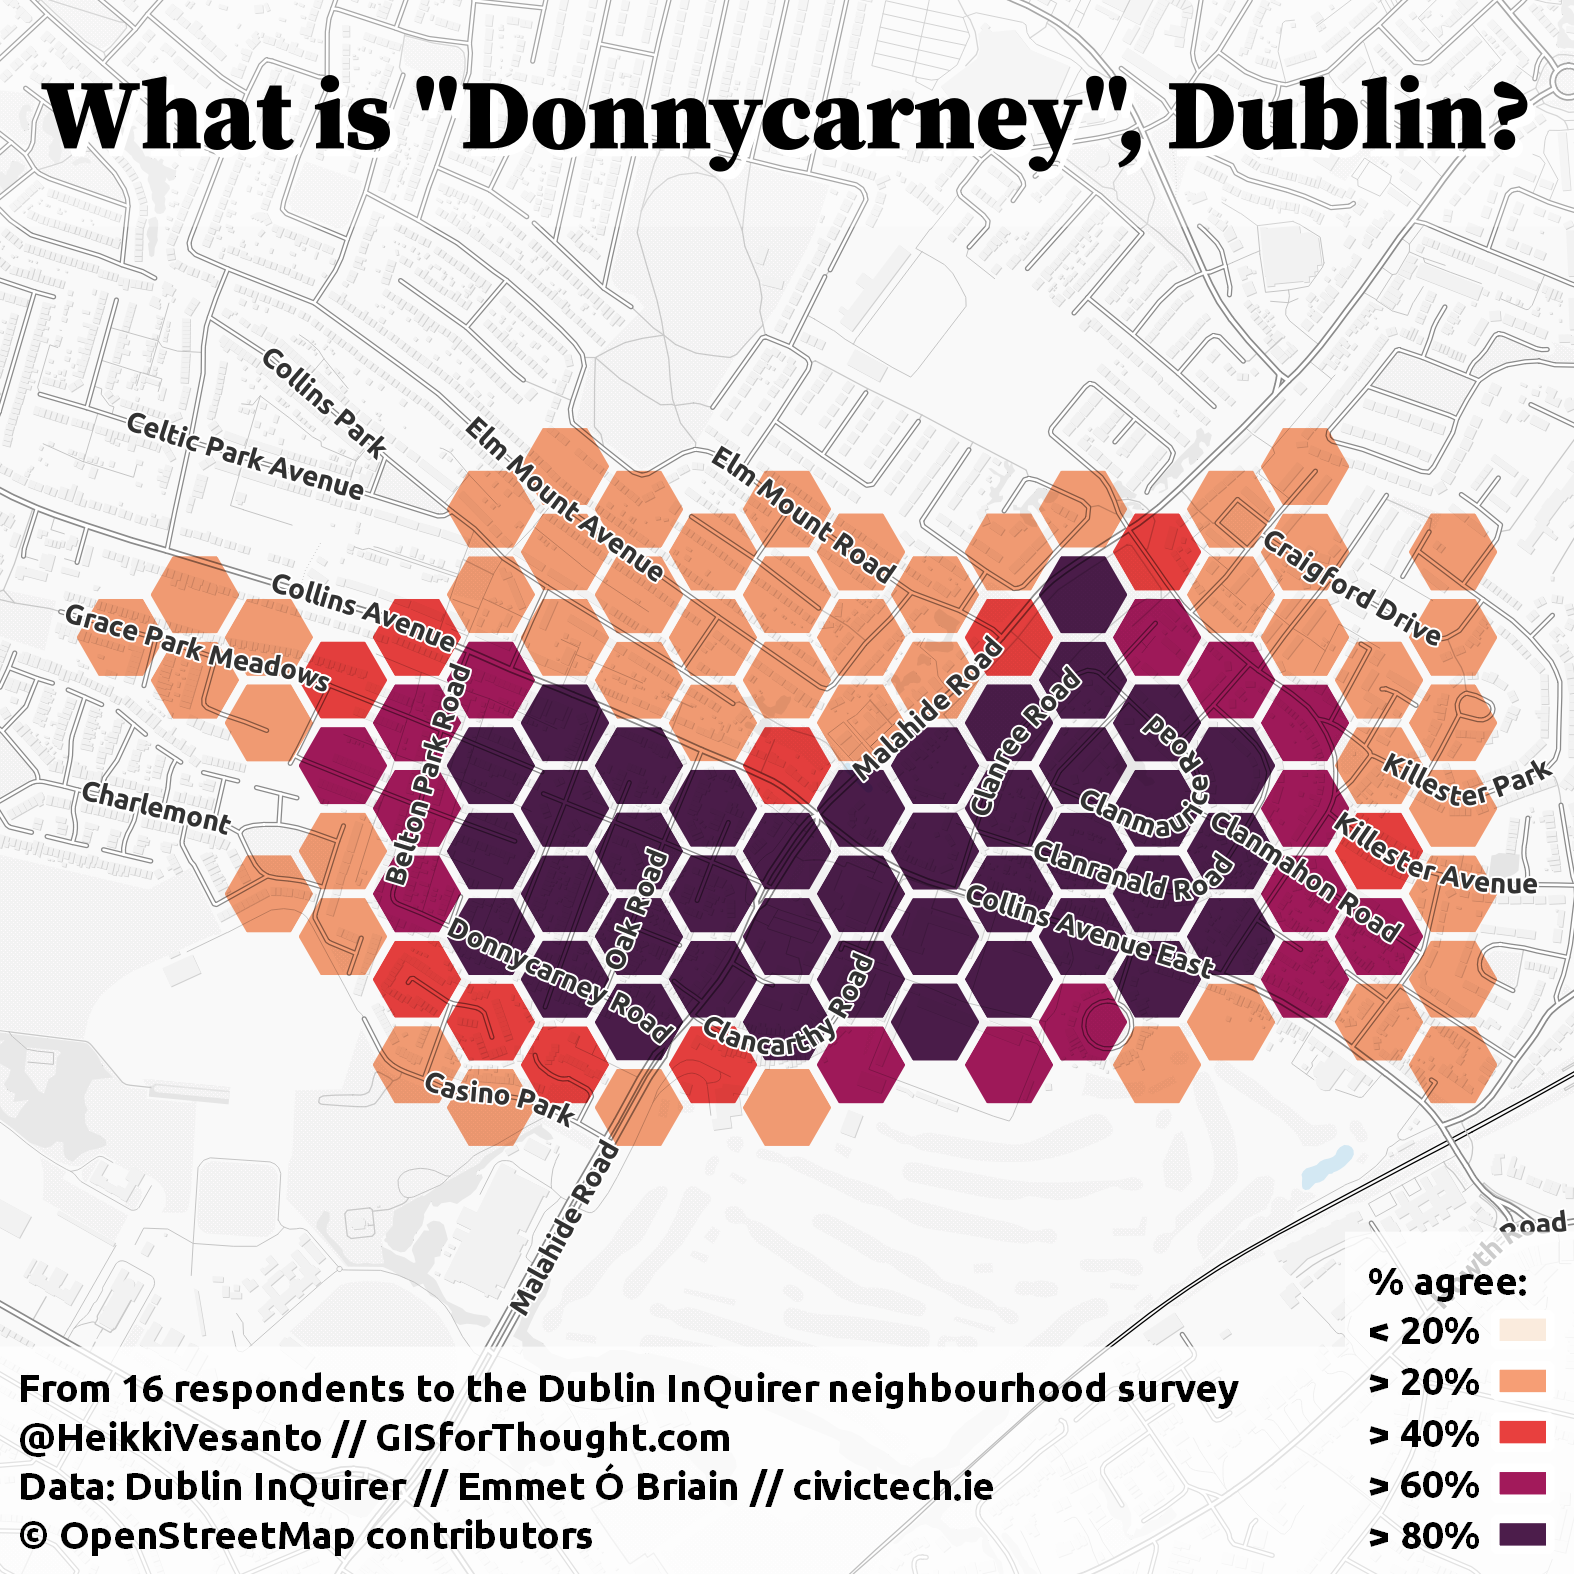
Donnycarney,
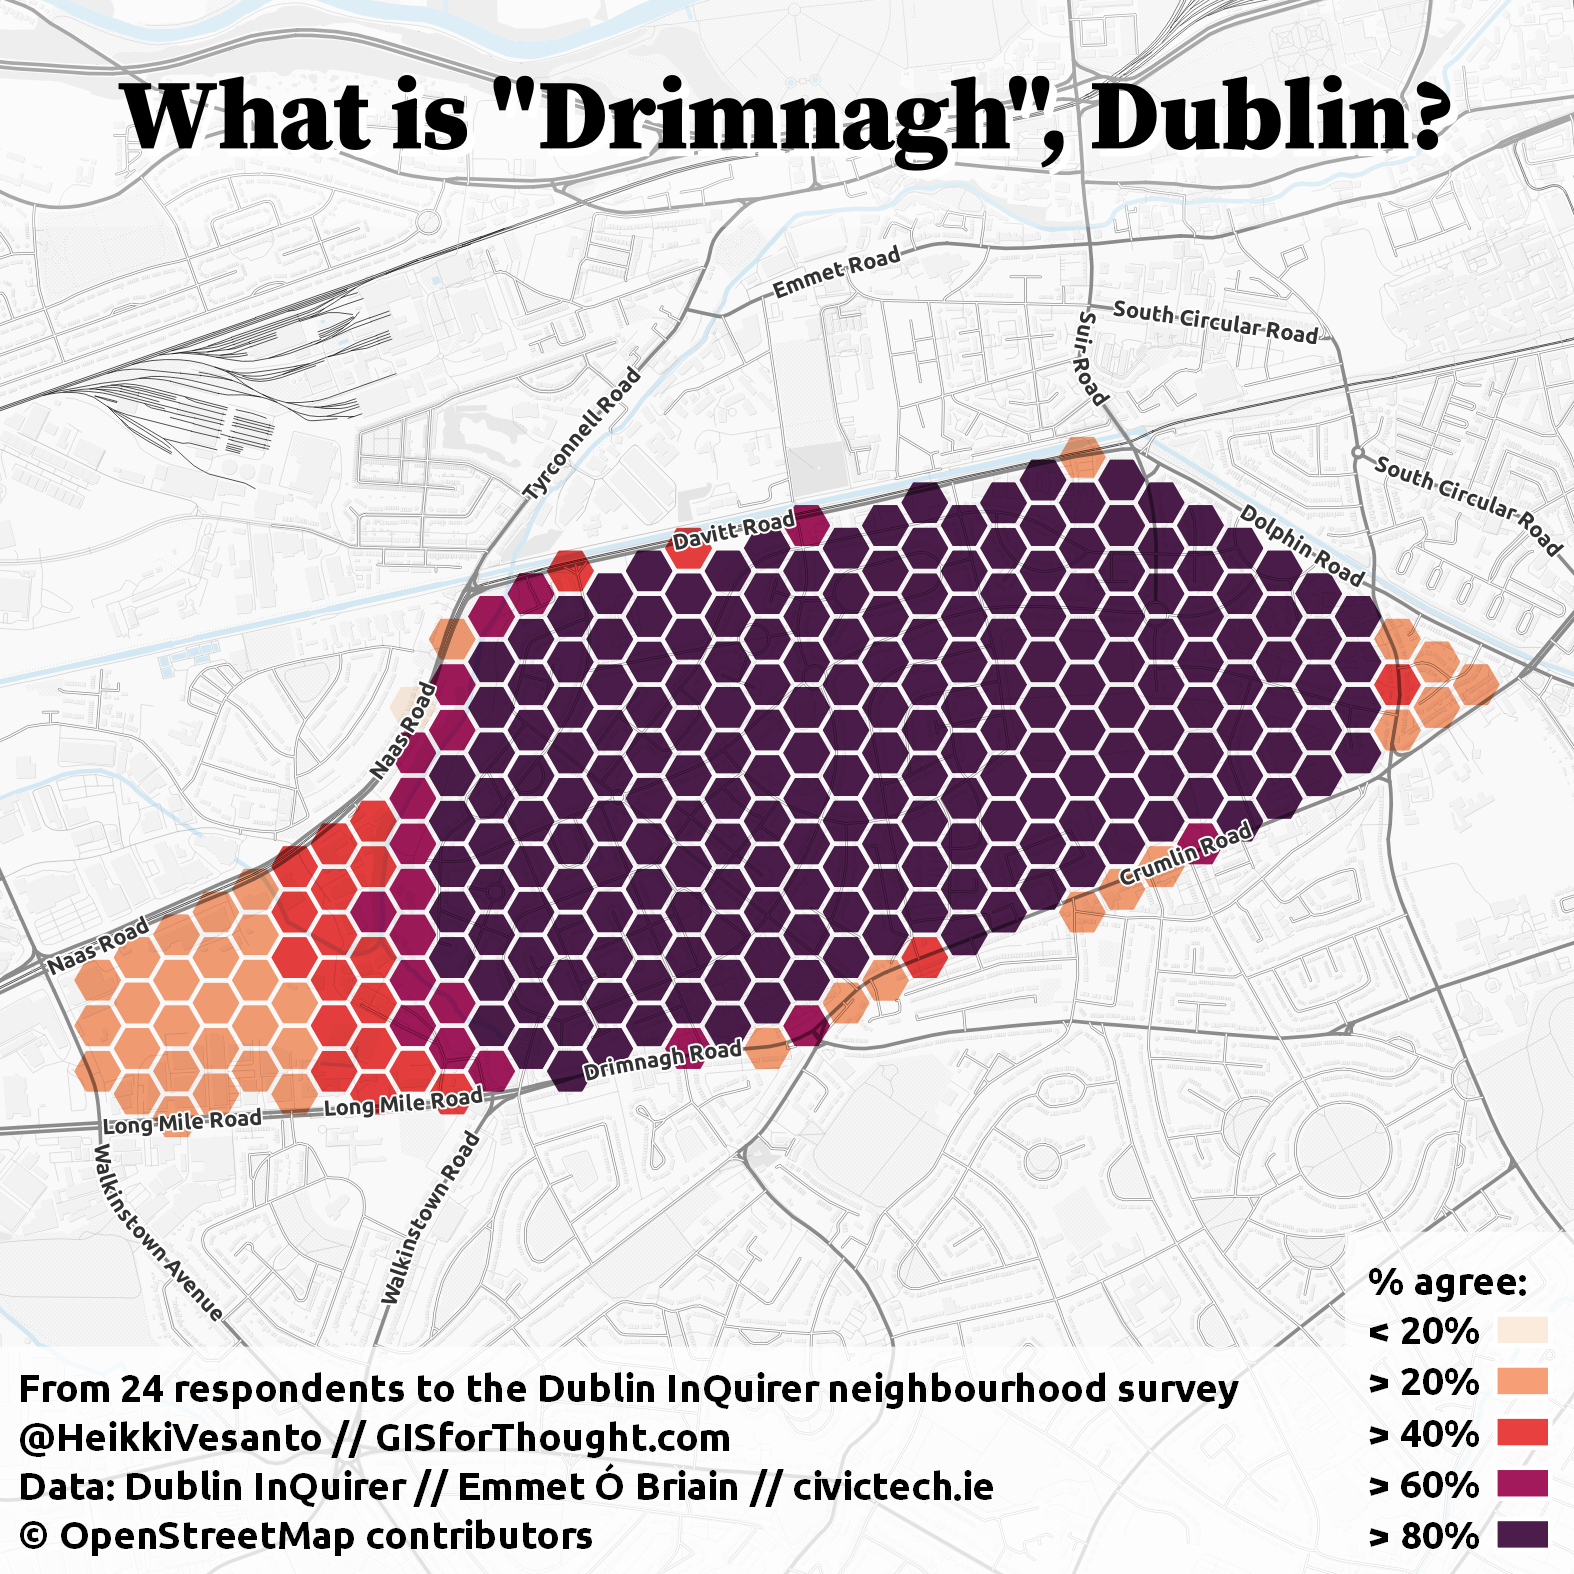
Drimnagh,
Drumcondra,
Dun Laoghaire,
East Wall,
Fairview,
Finglas,
Firhouse,
Glasnevin,
Goatstown,
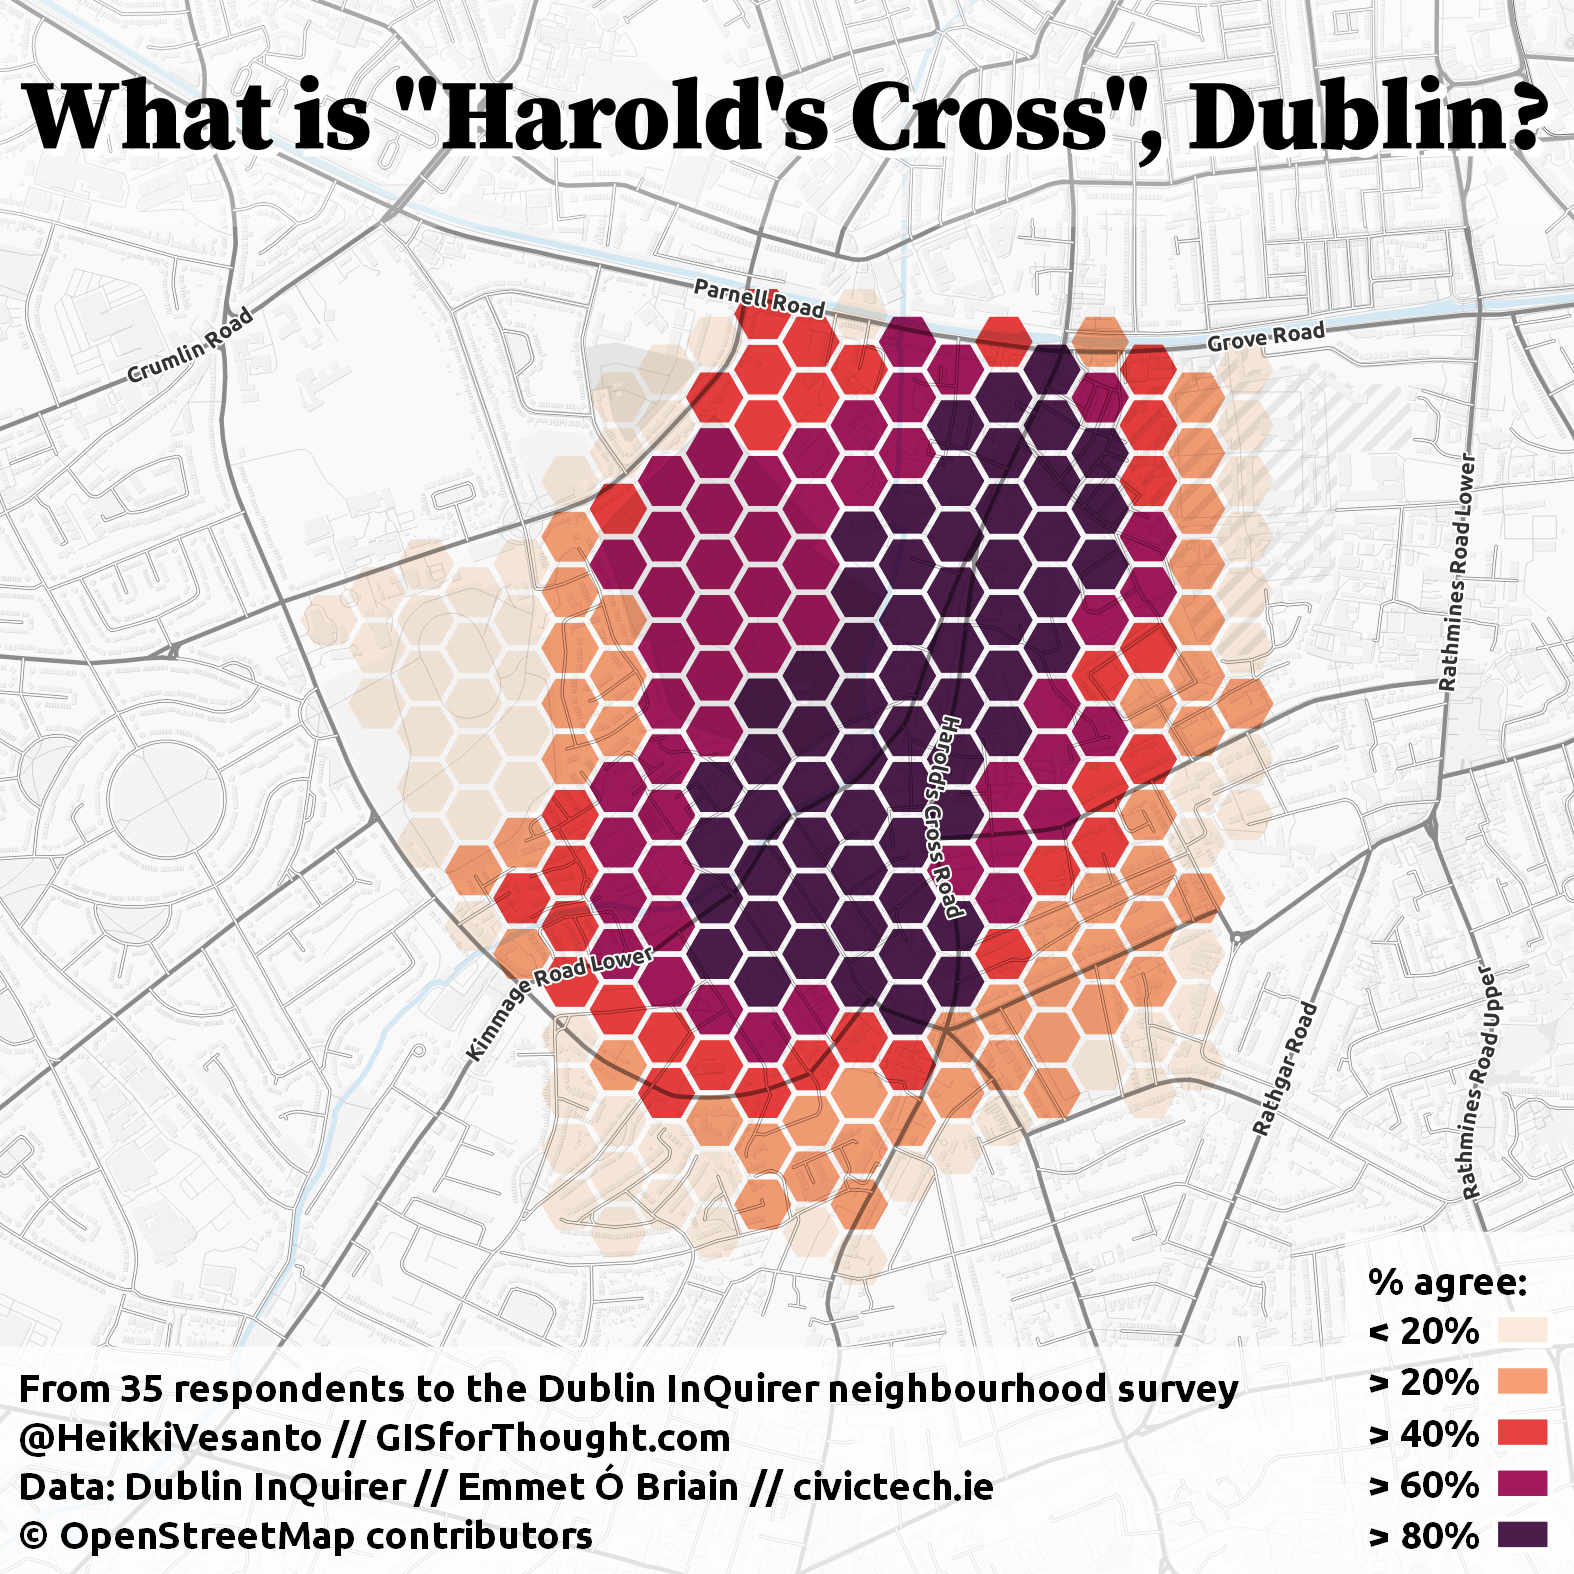
Harold’s Cross,
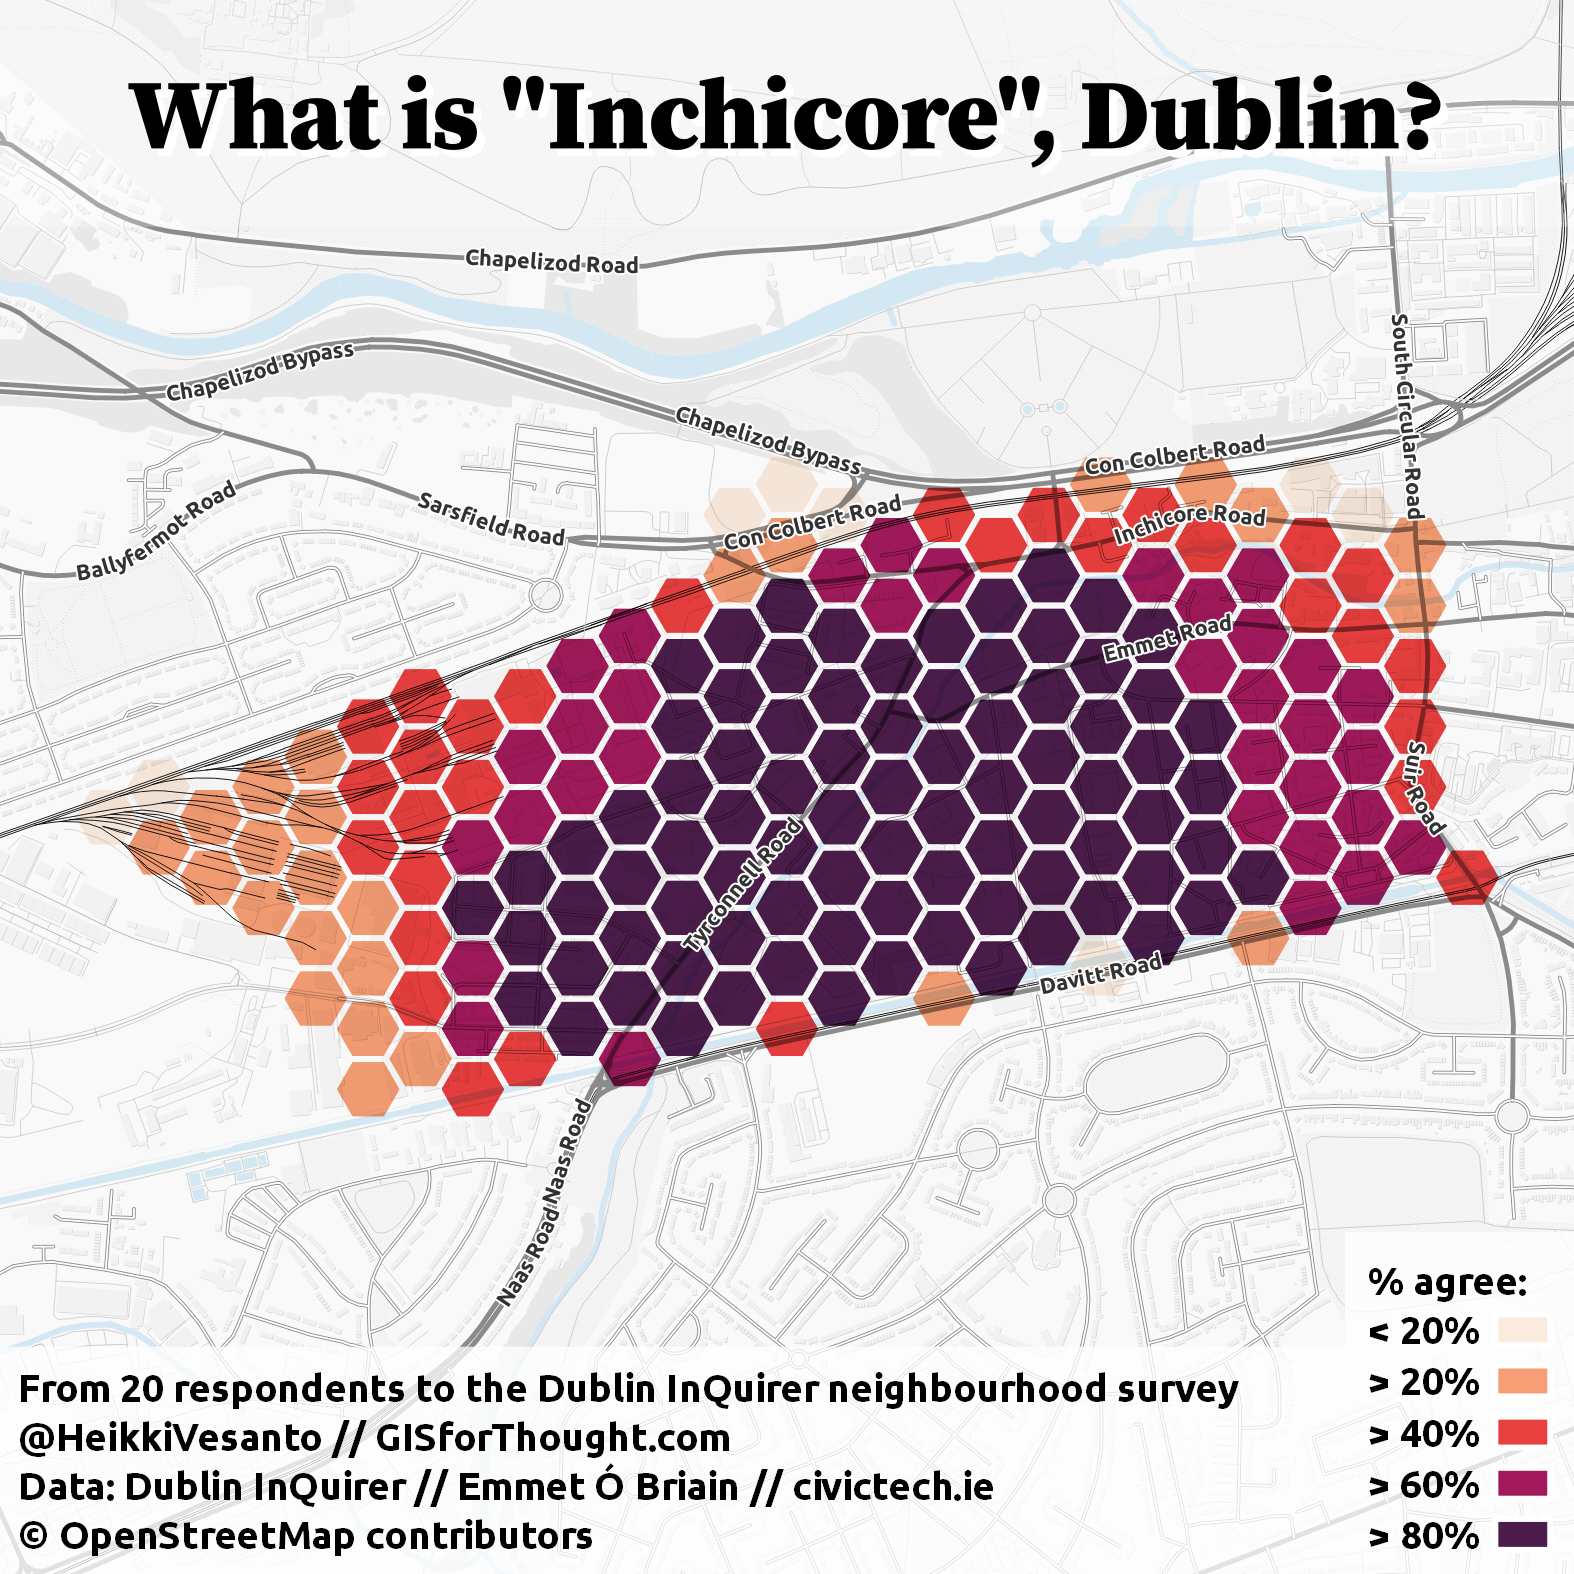
Inchicore,
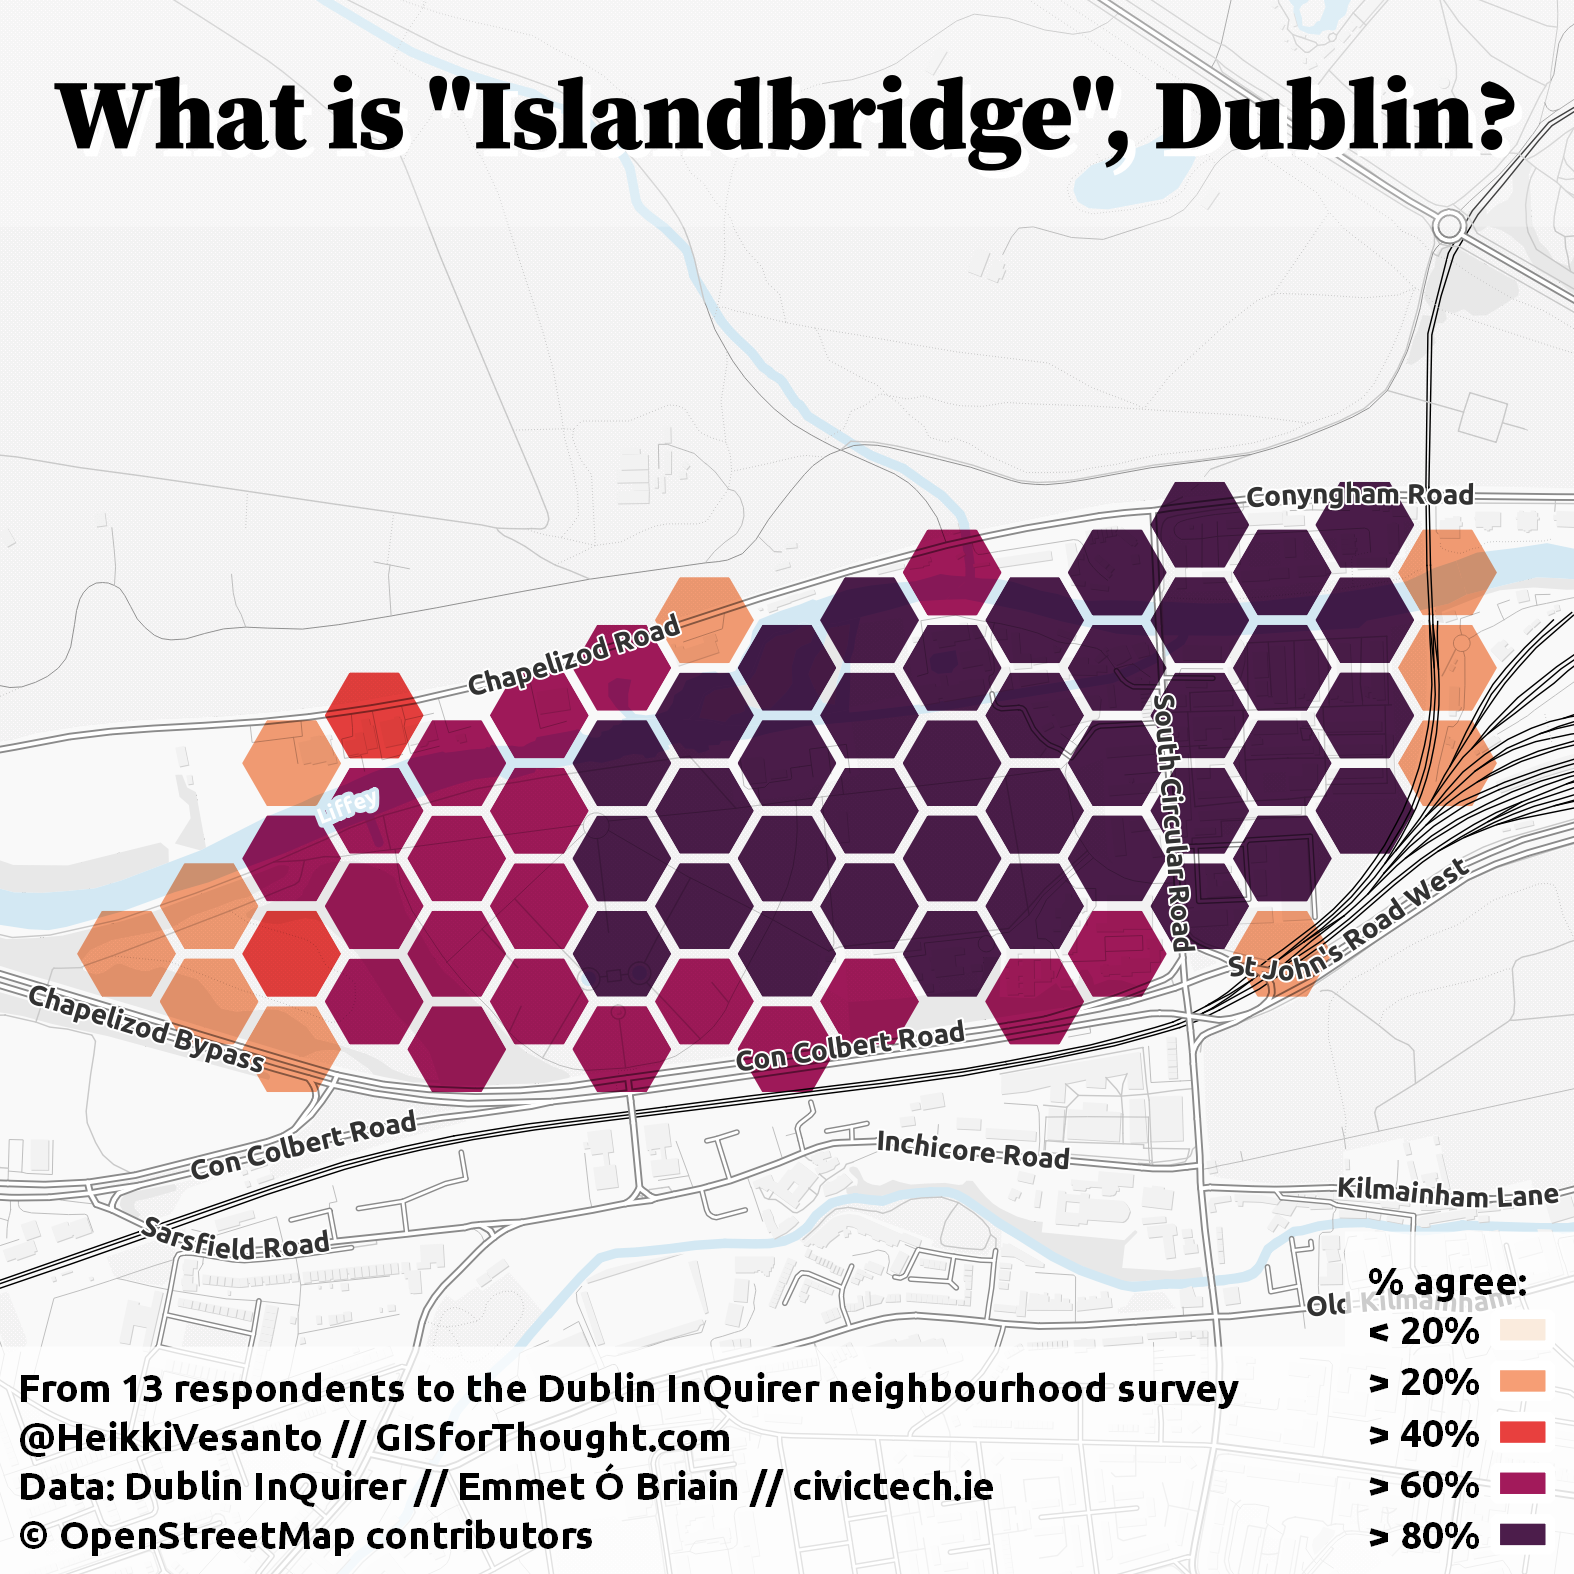
Islandbridge,
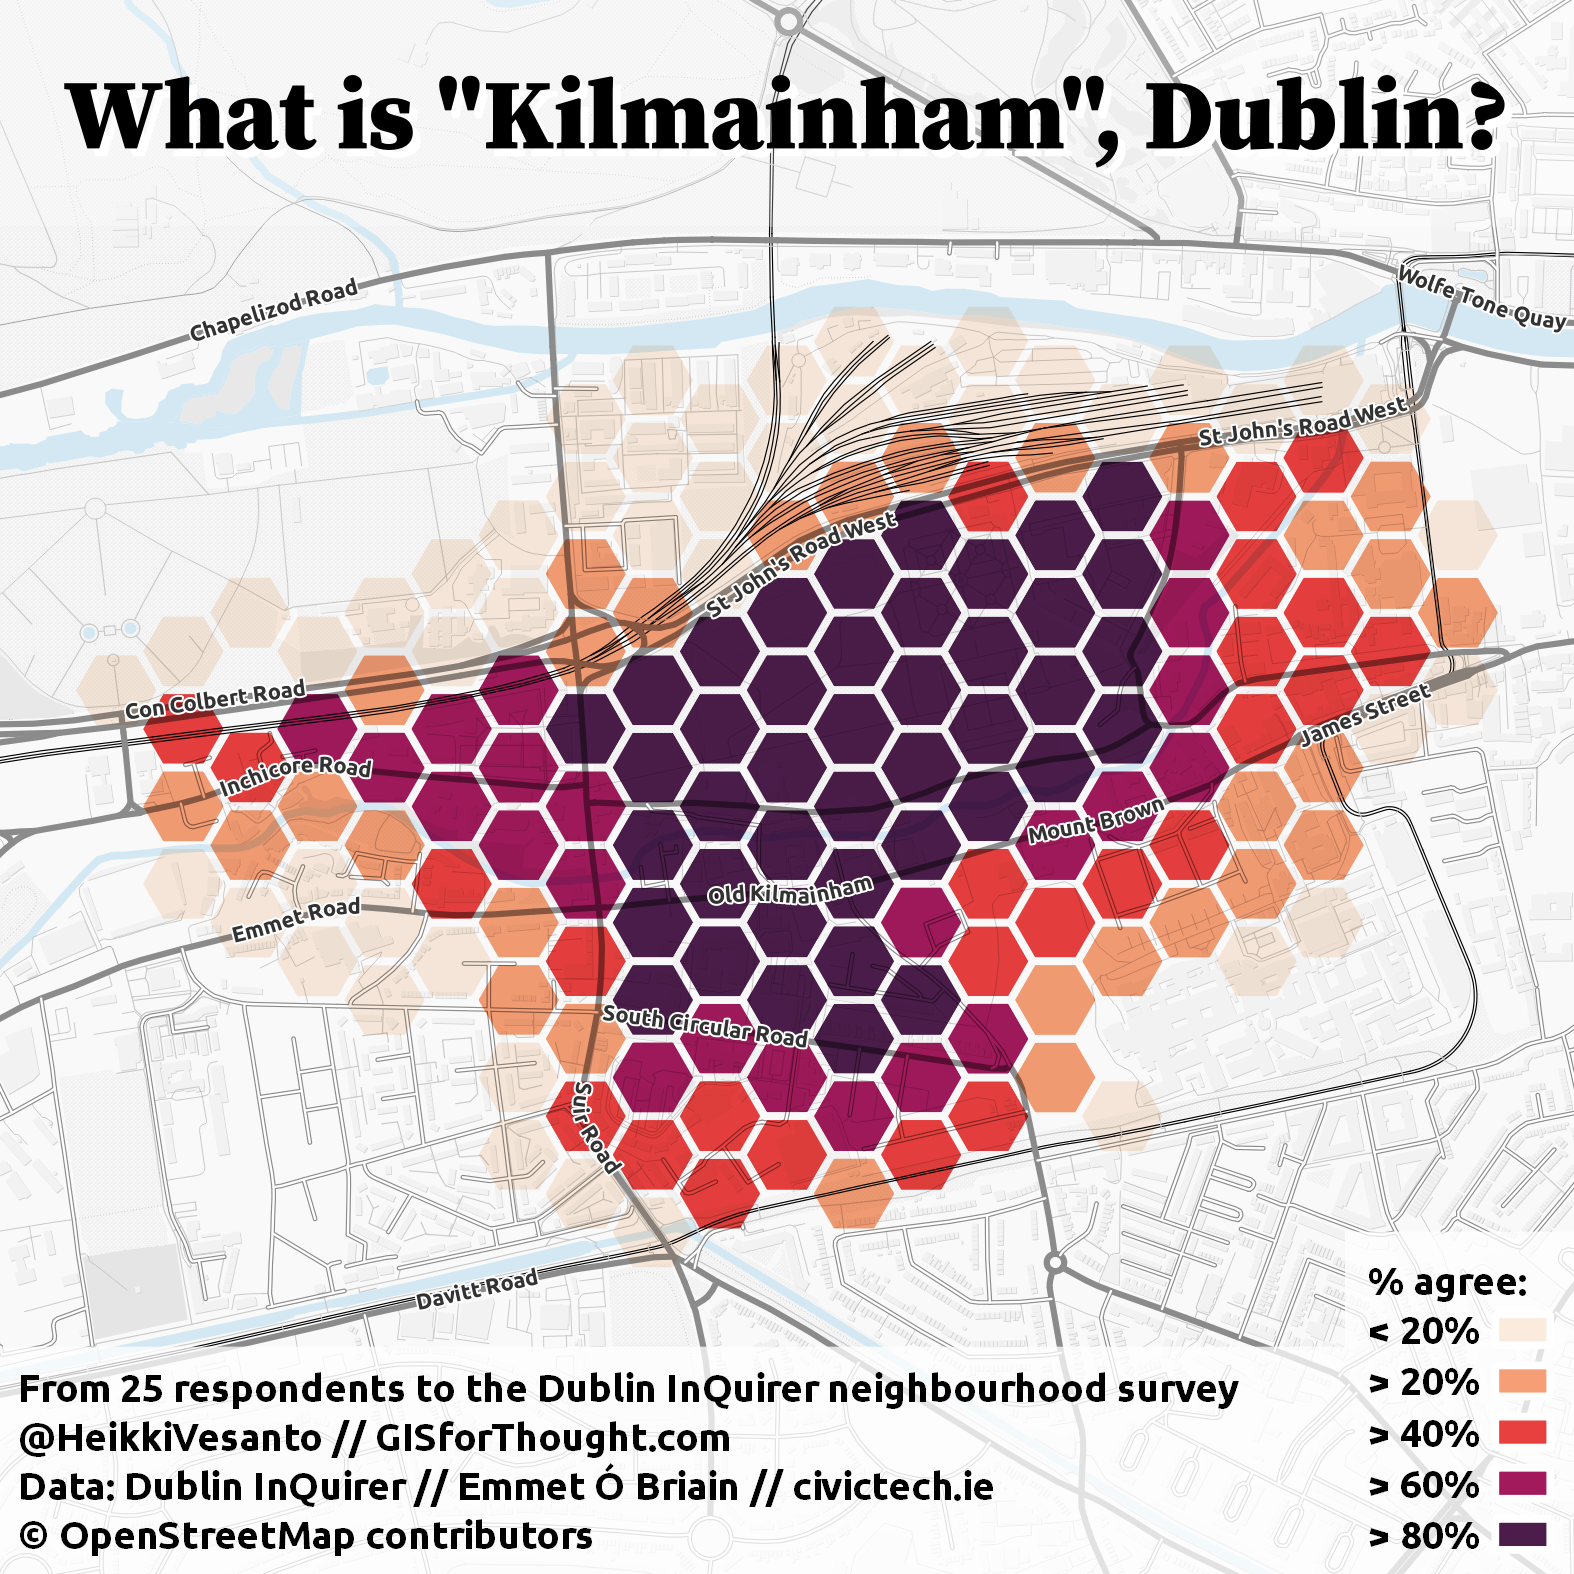
Kilmainham,
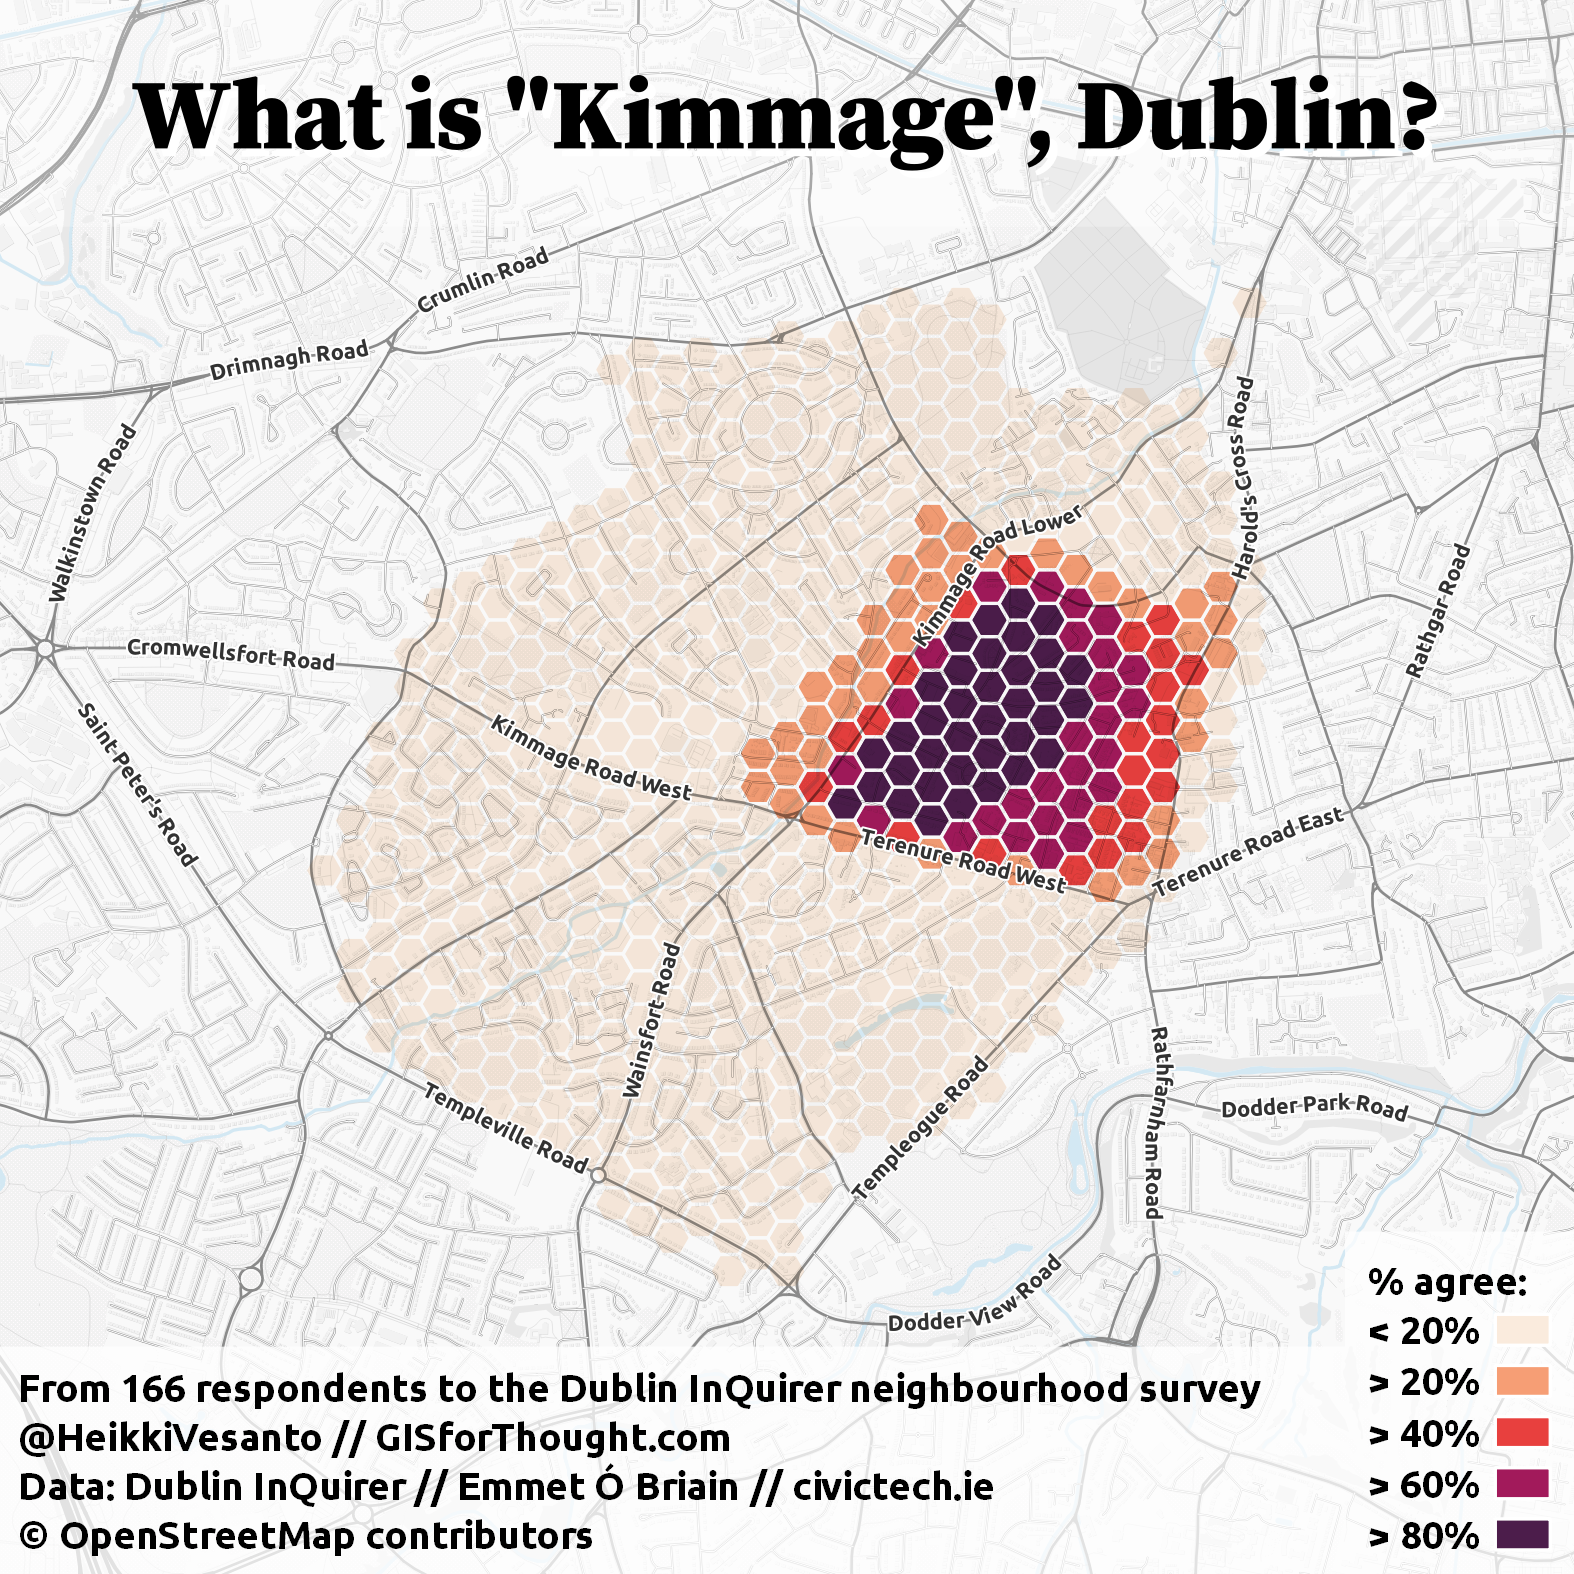
Kimmage,
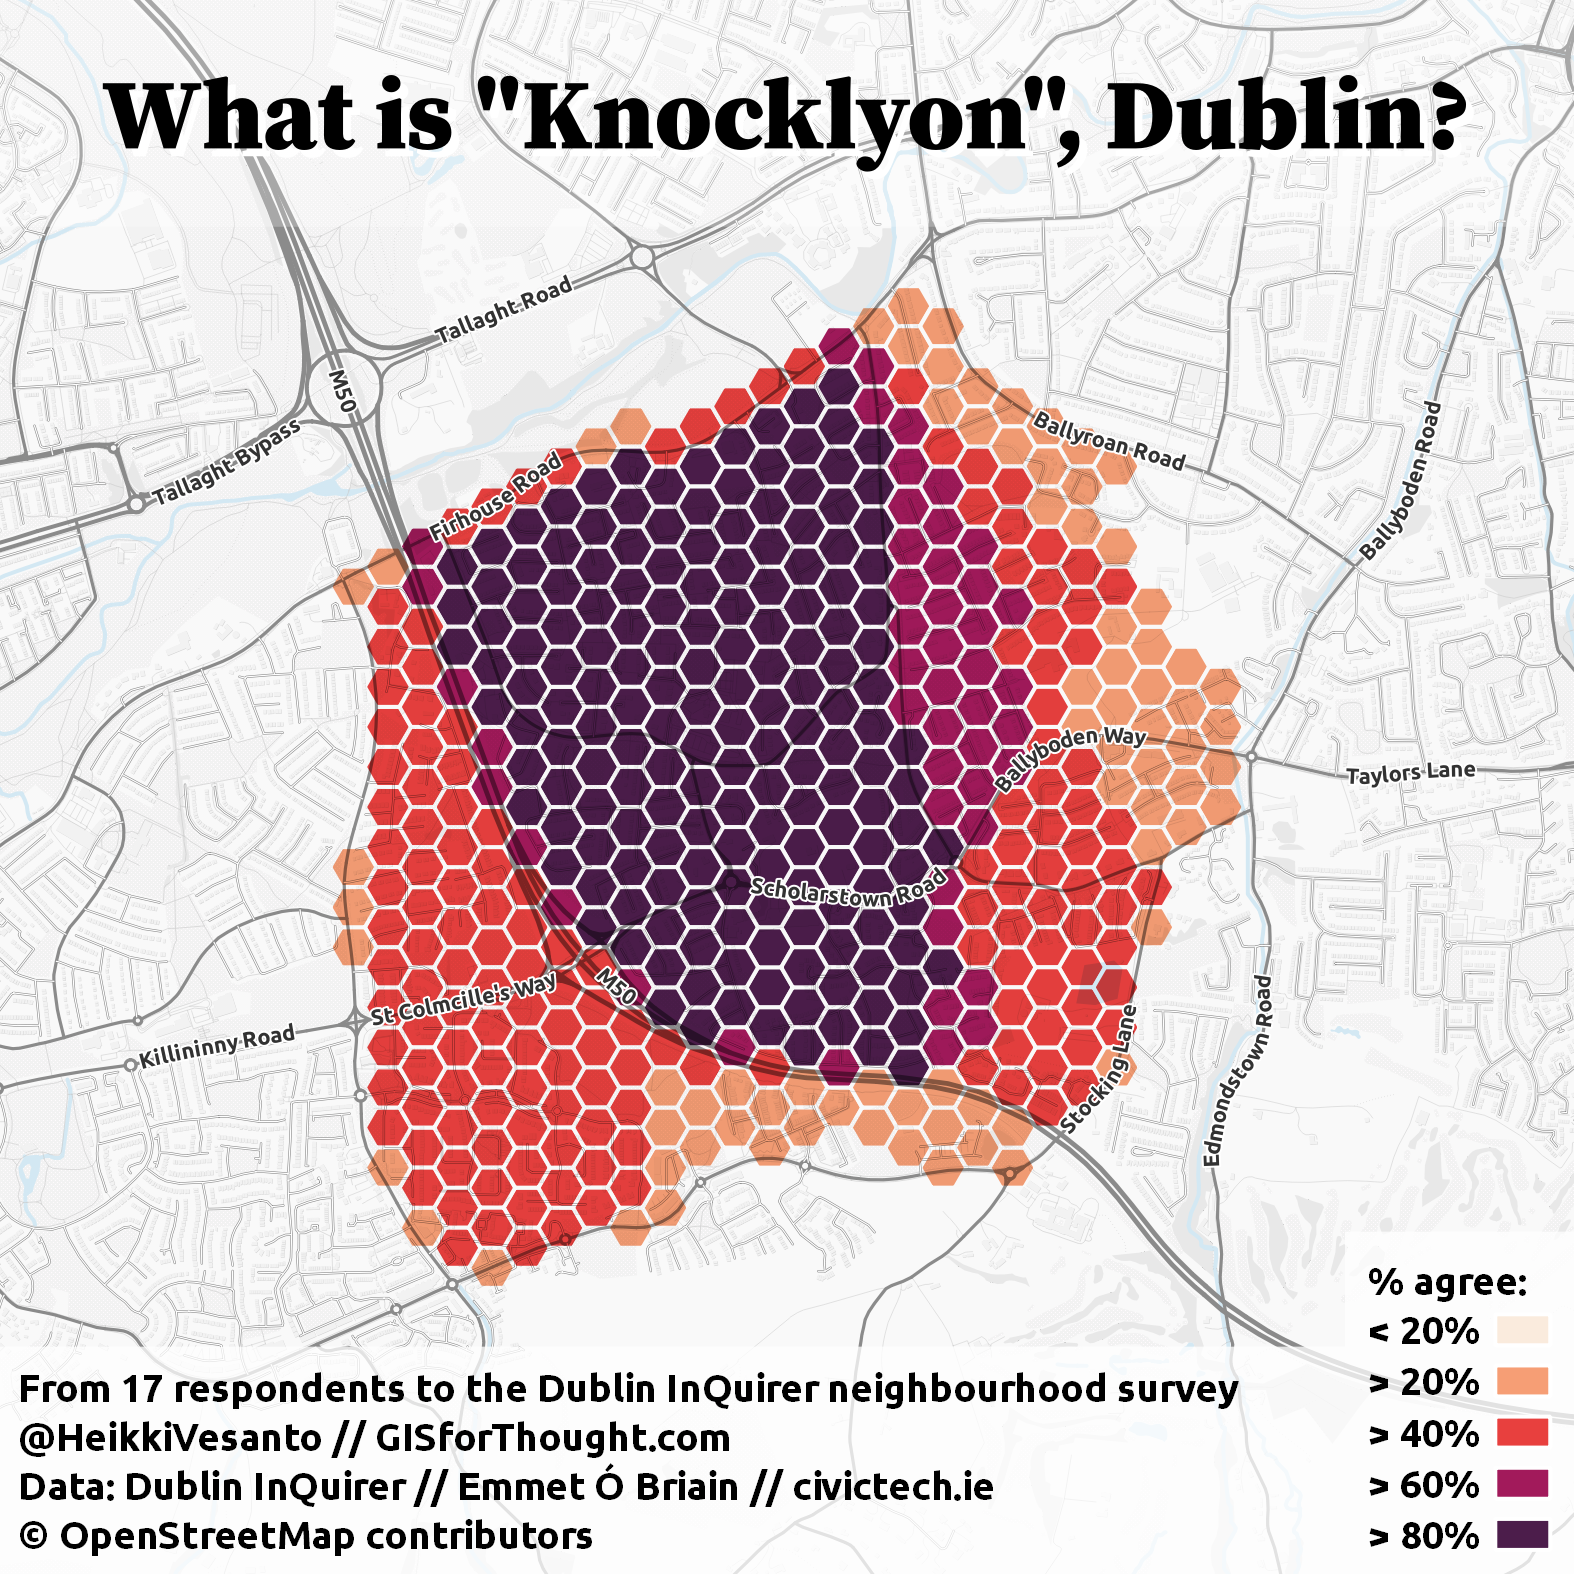
Knocklyon,
Lower Crumlin,
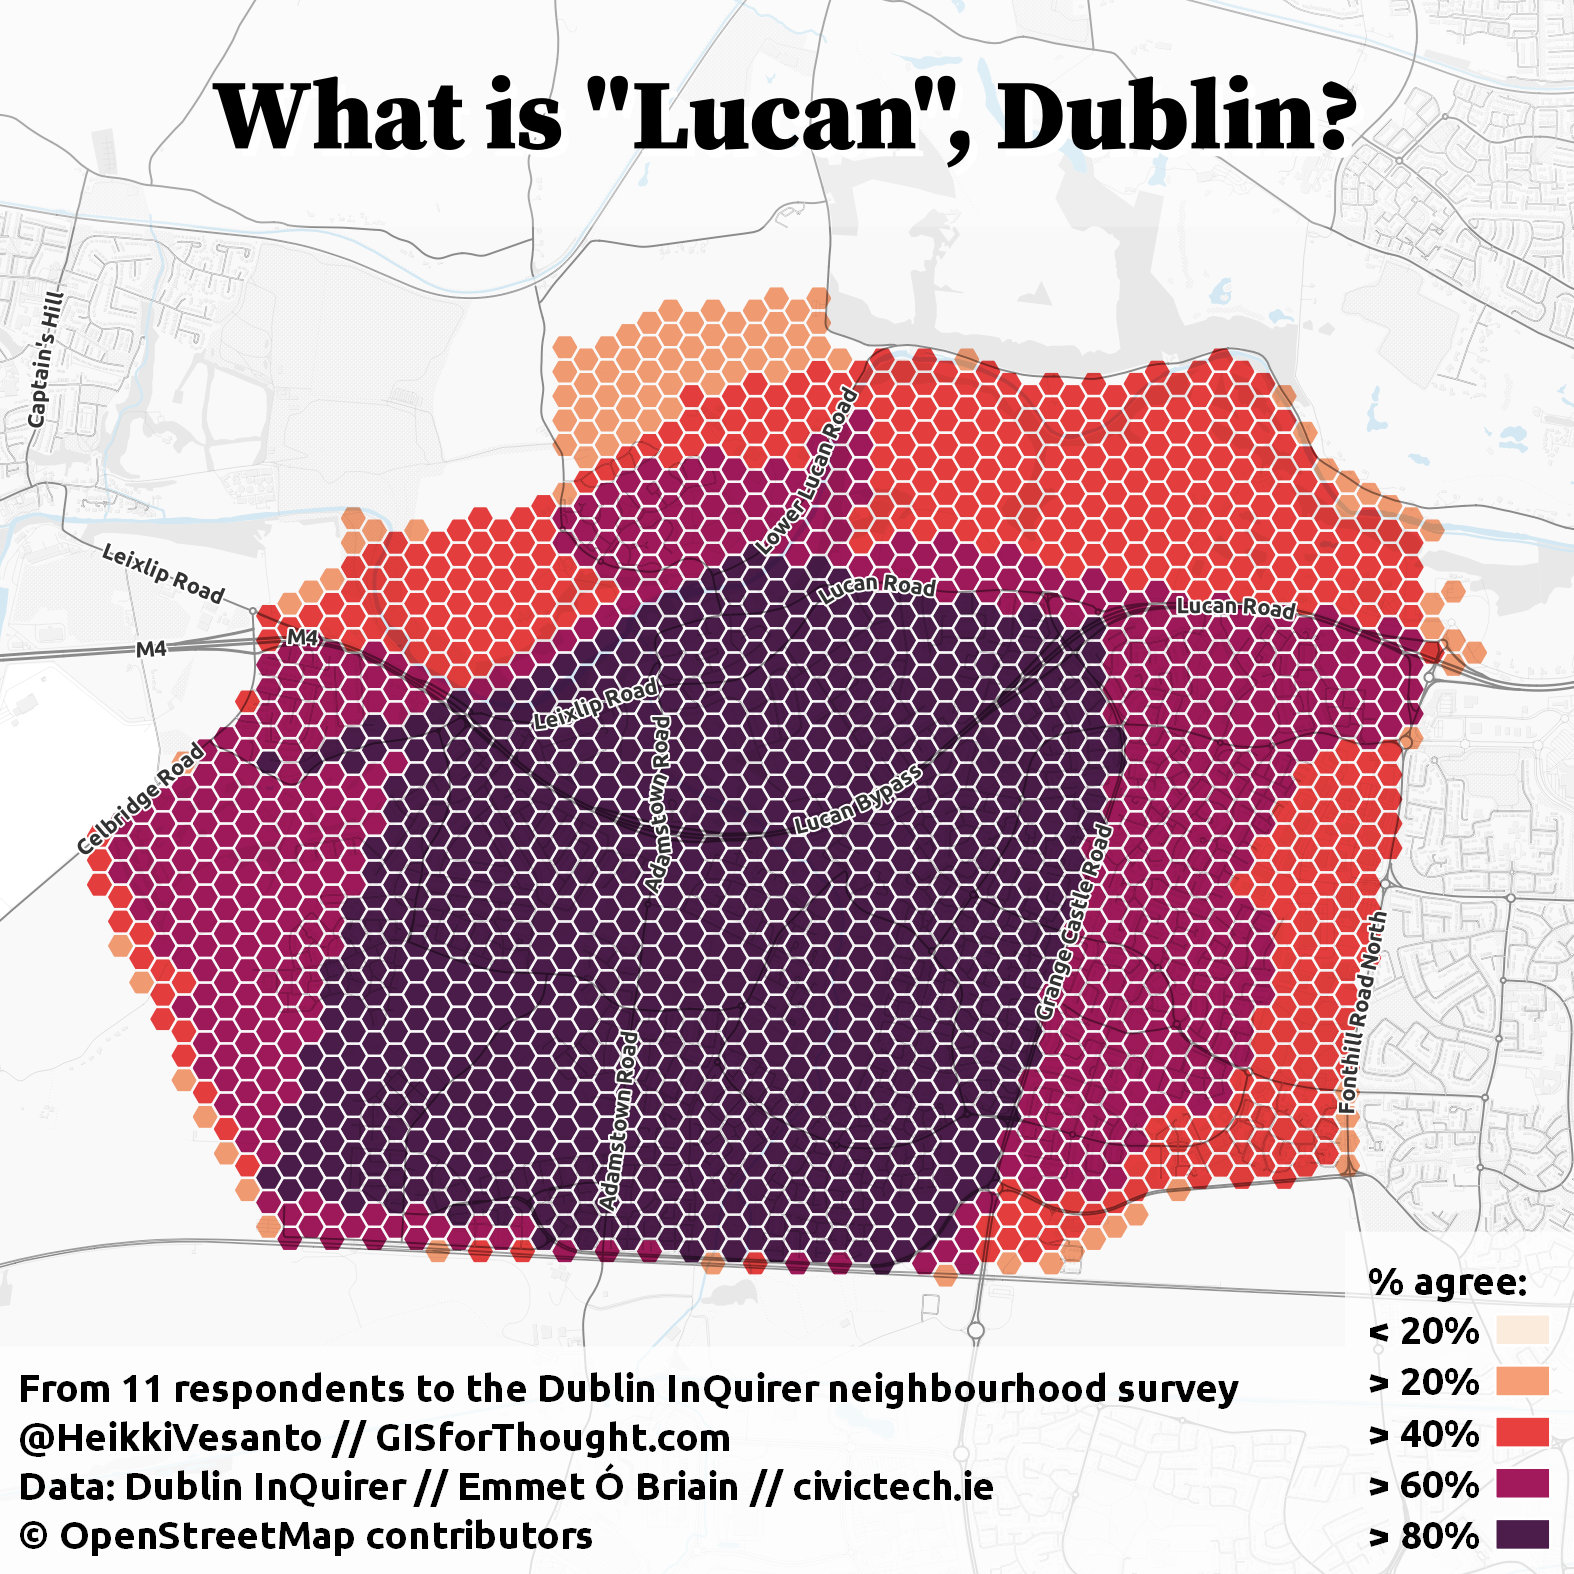
Lucan,
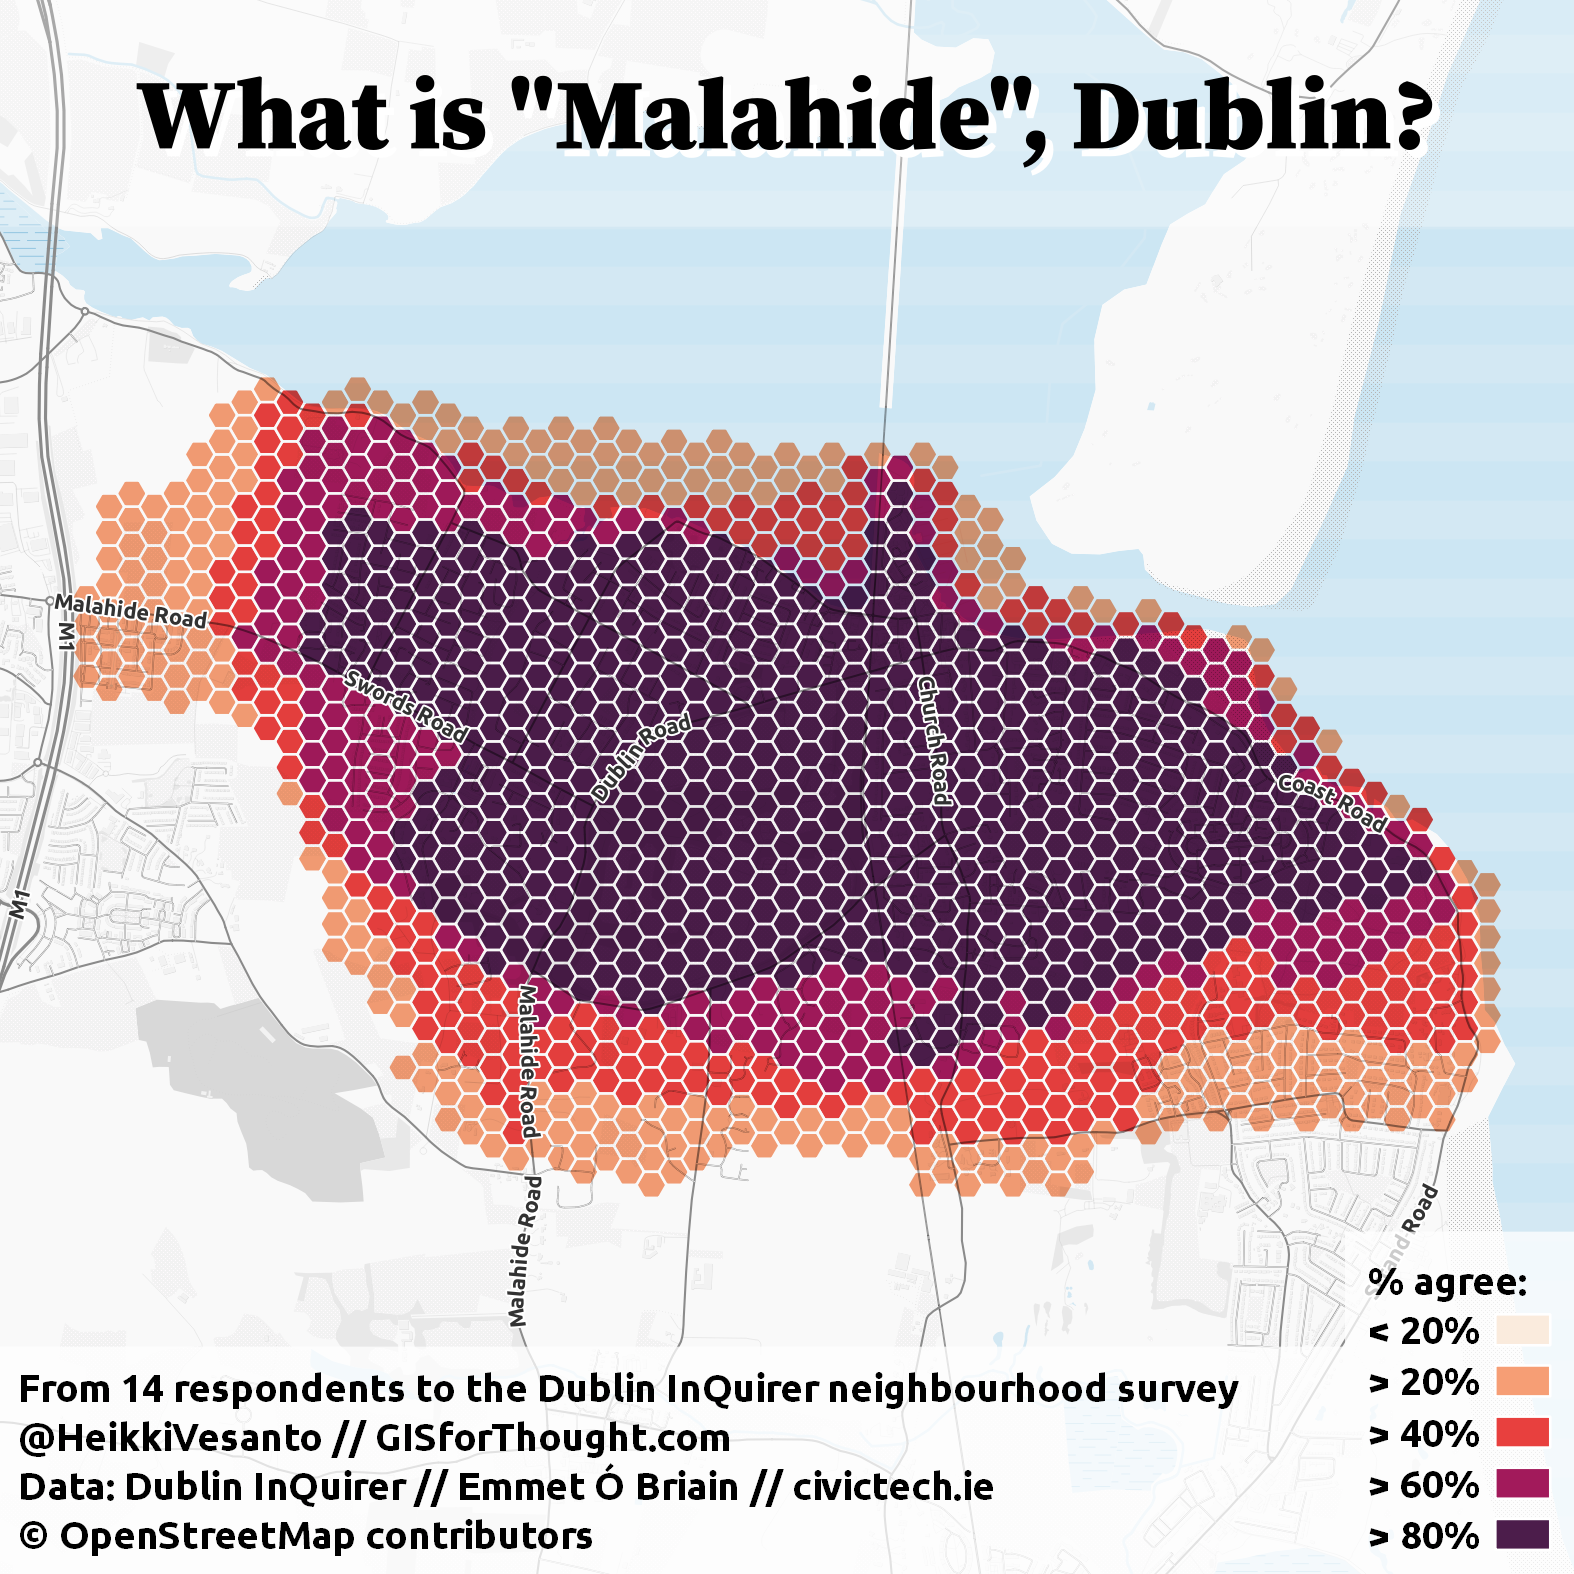
Malahide,
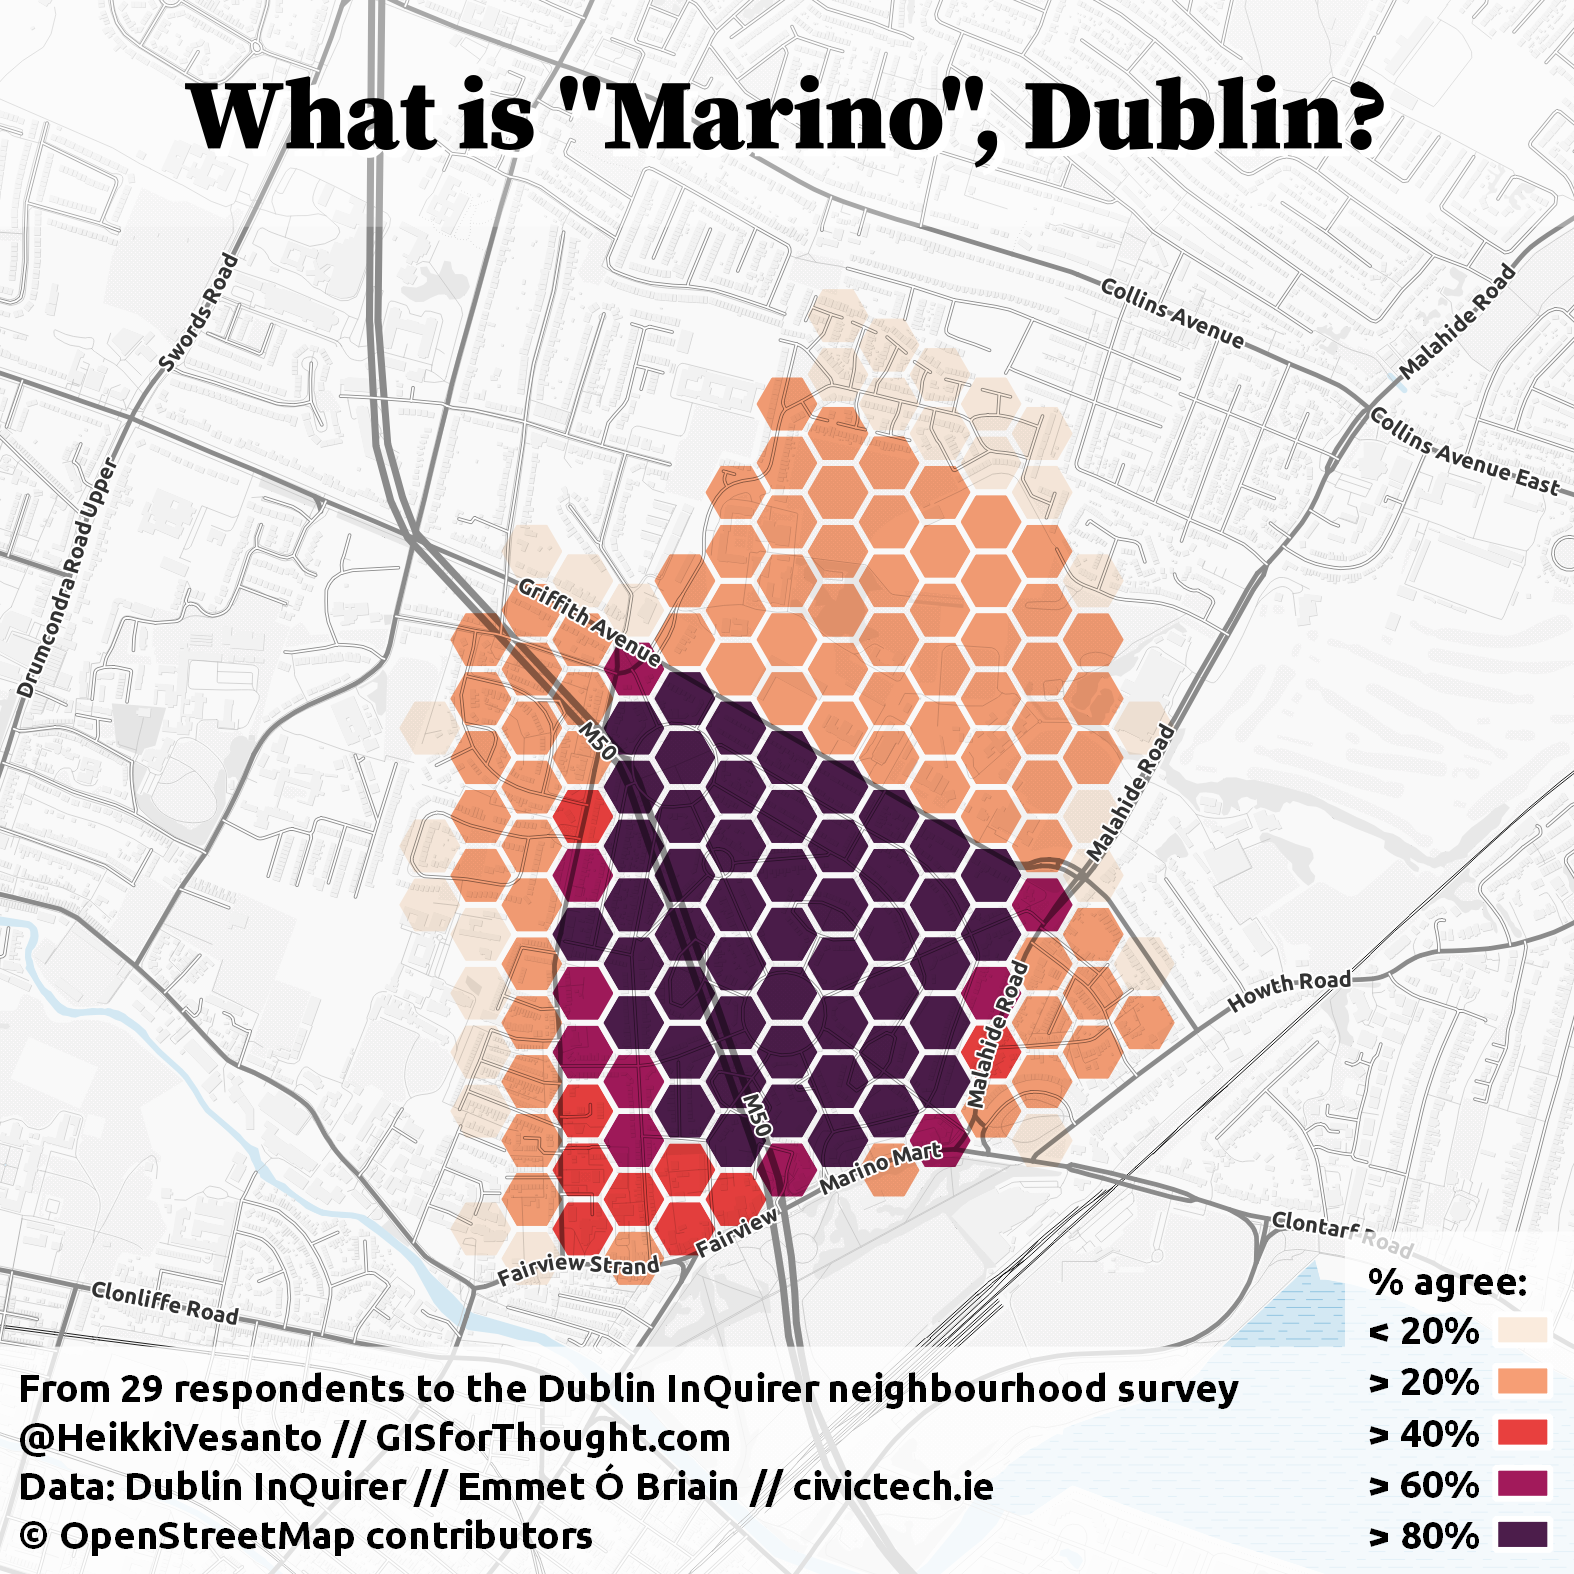
Marino,
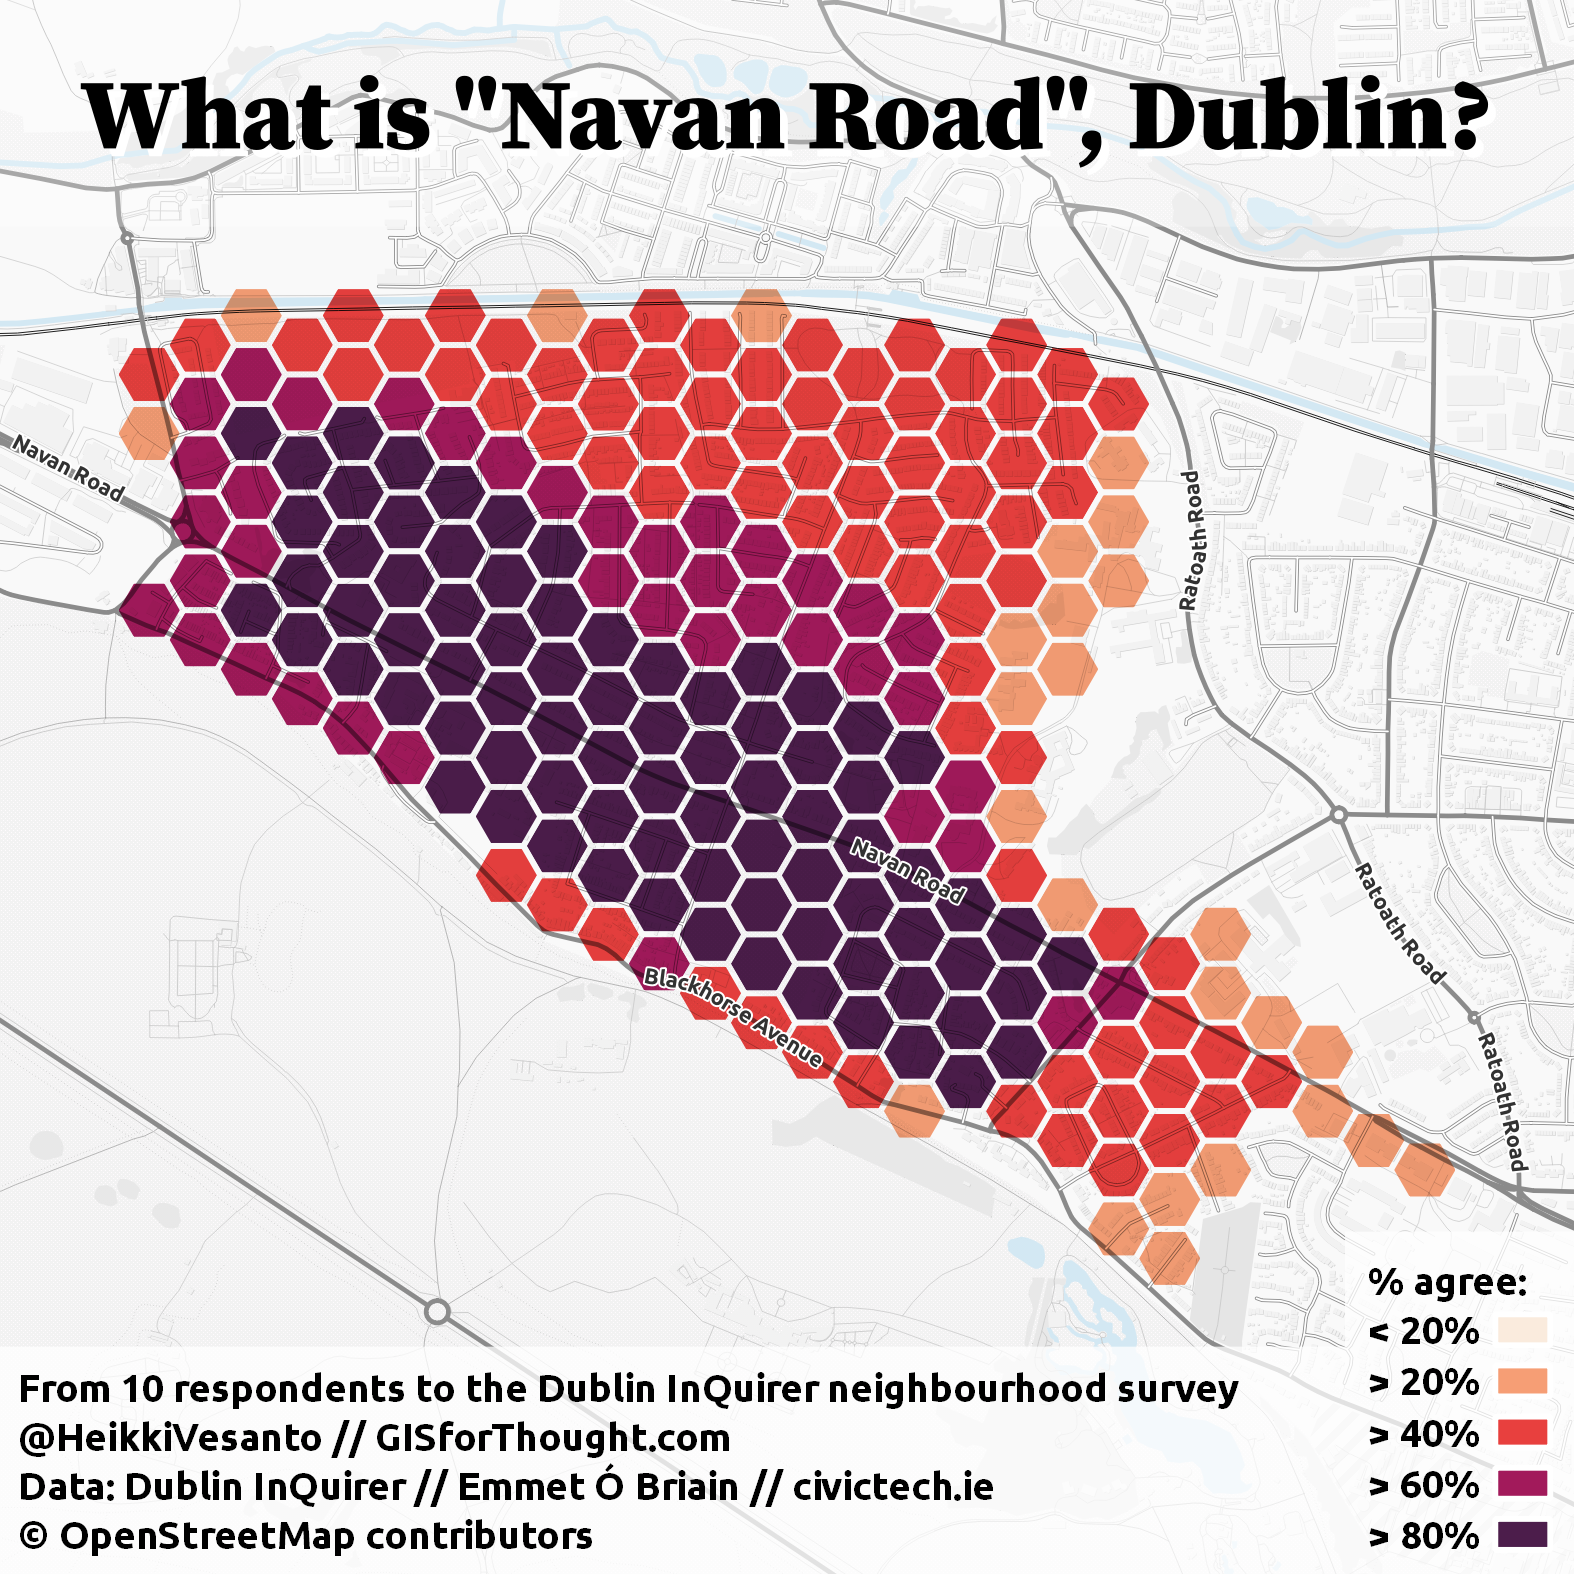
Navanroad,
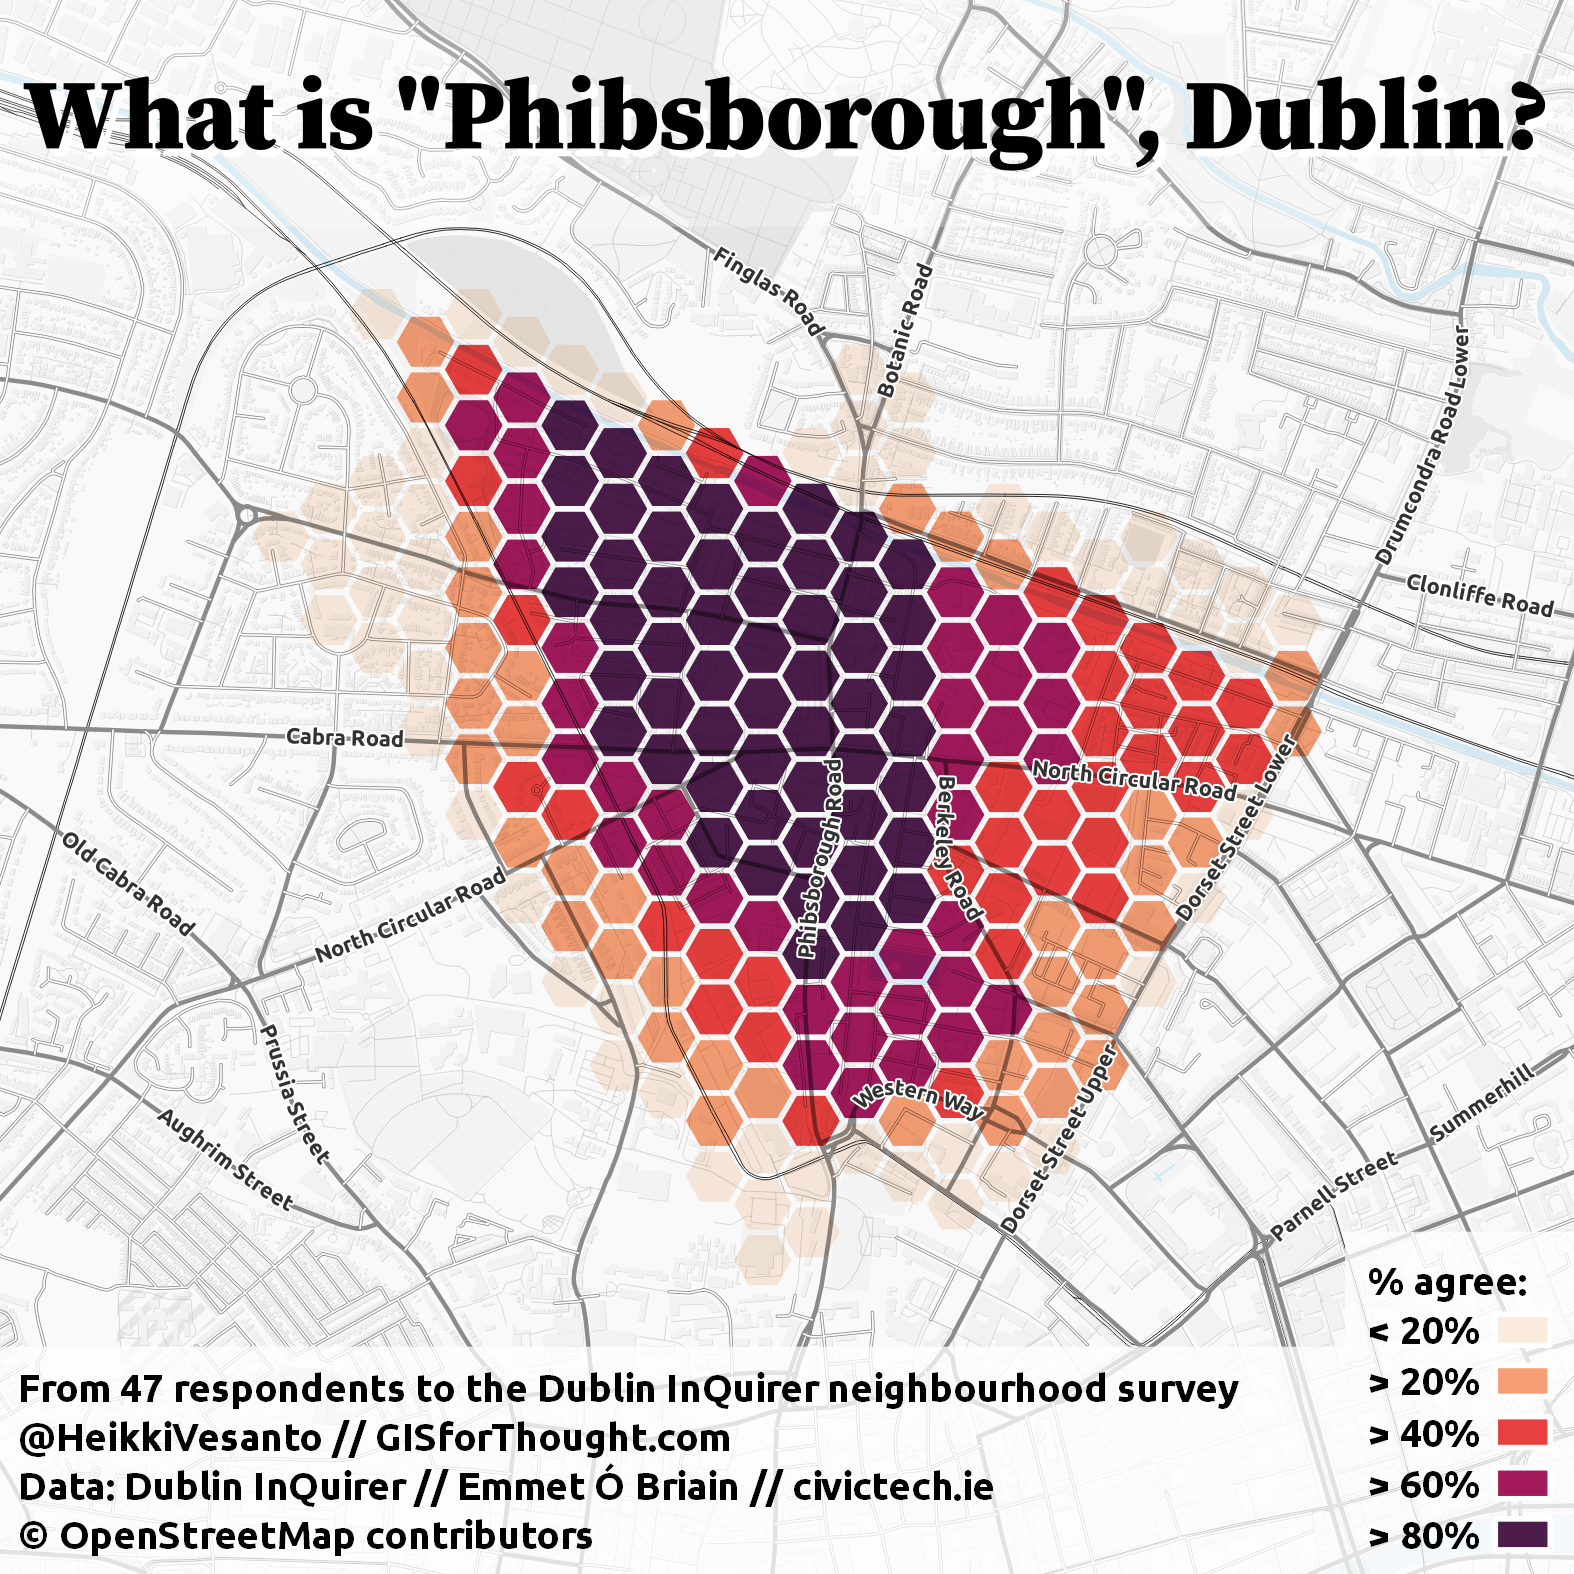
Phibsborough,
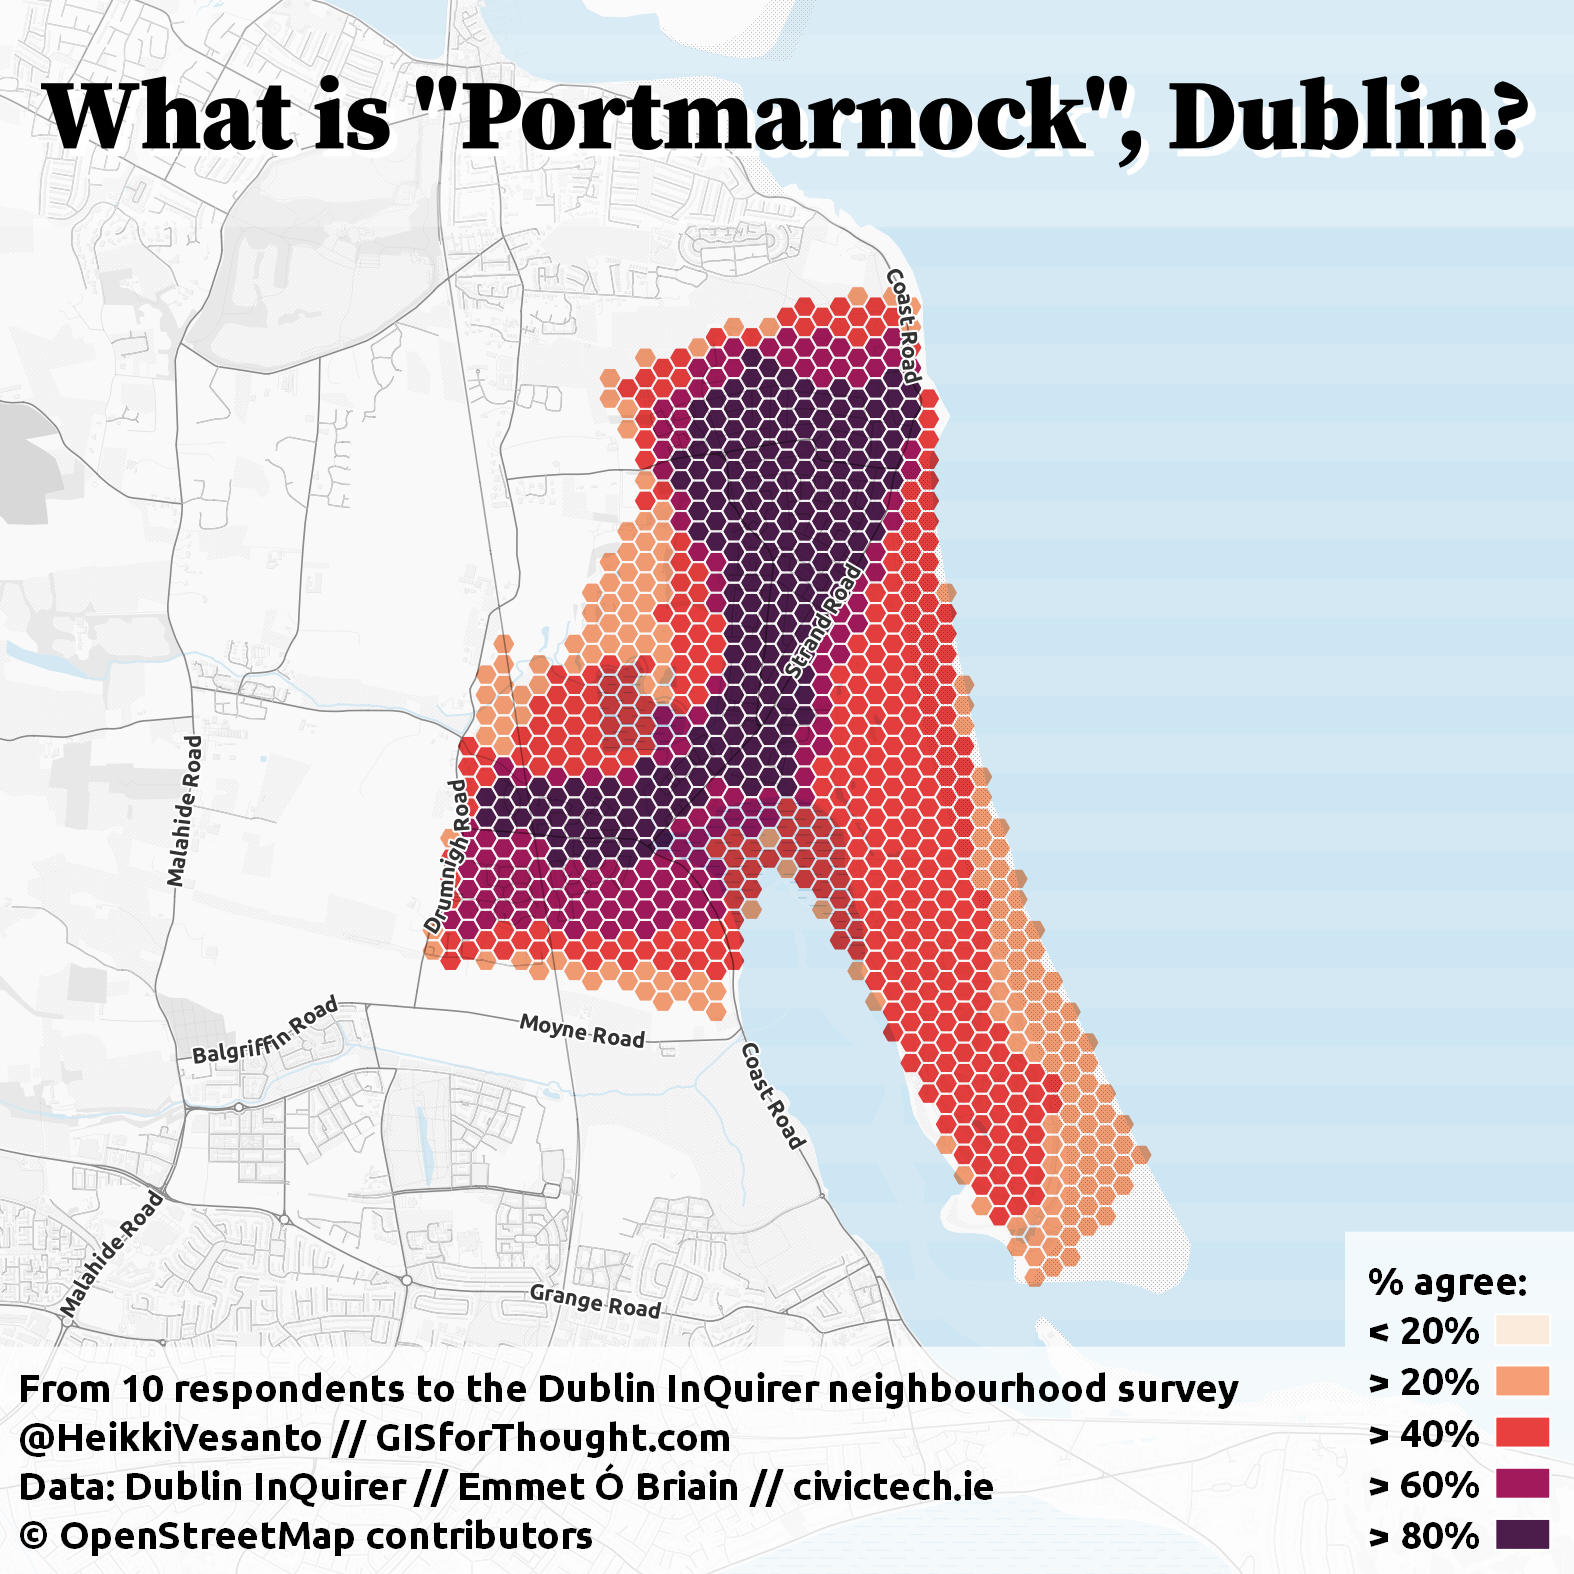
Portmarnock,
Portobello,
Raheny,
Ranelagh,
Rathfarnham,
Rathgar,
Rathmines,
Rialto,
Sandymount,
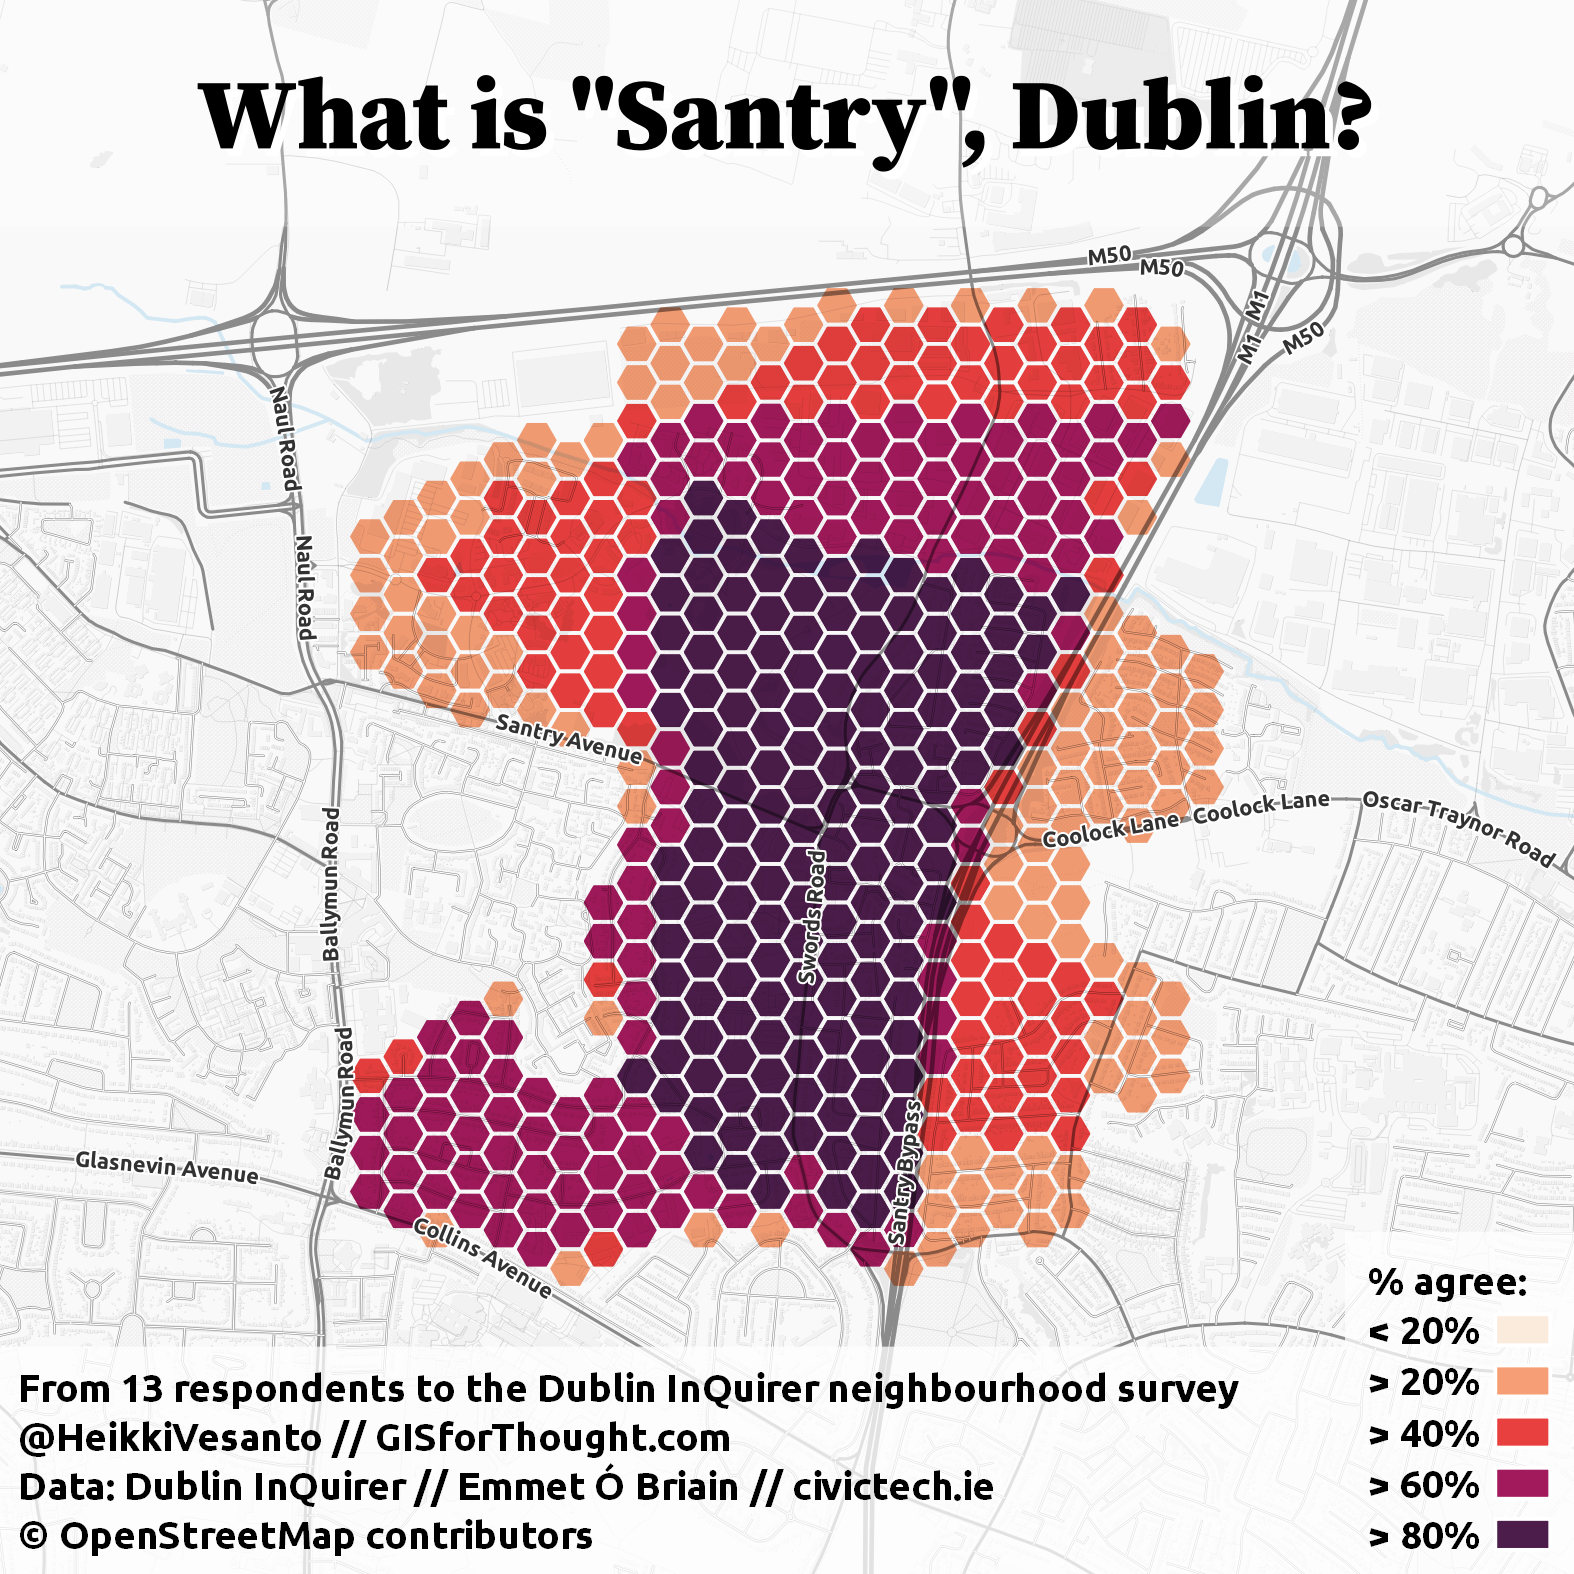
Santry,
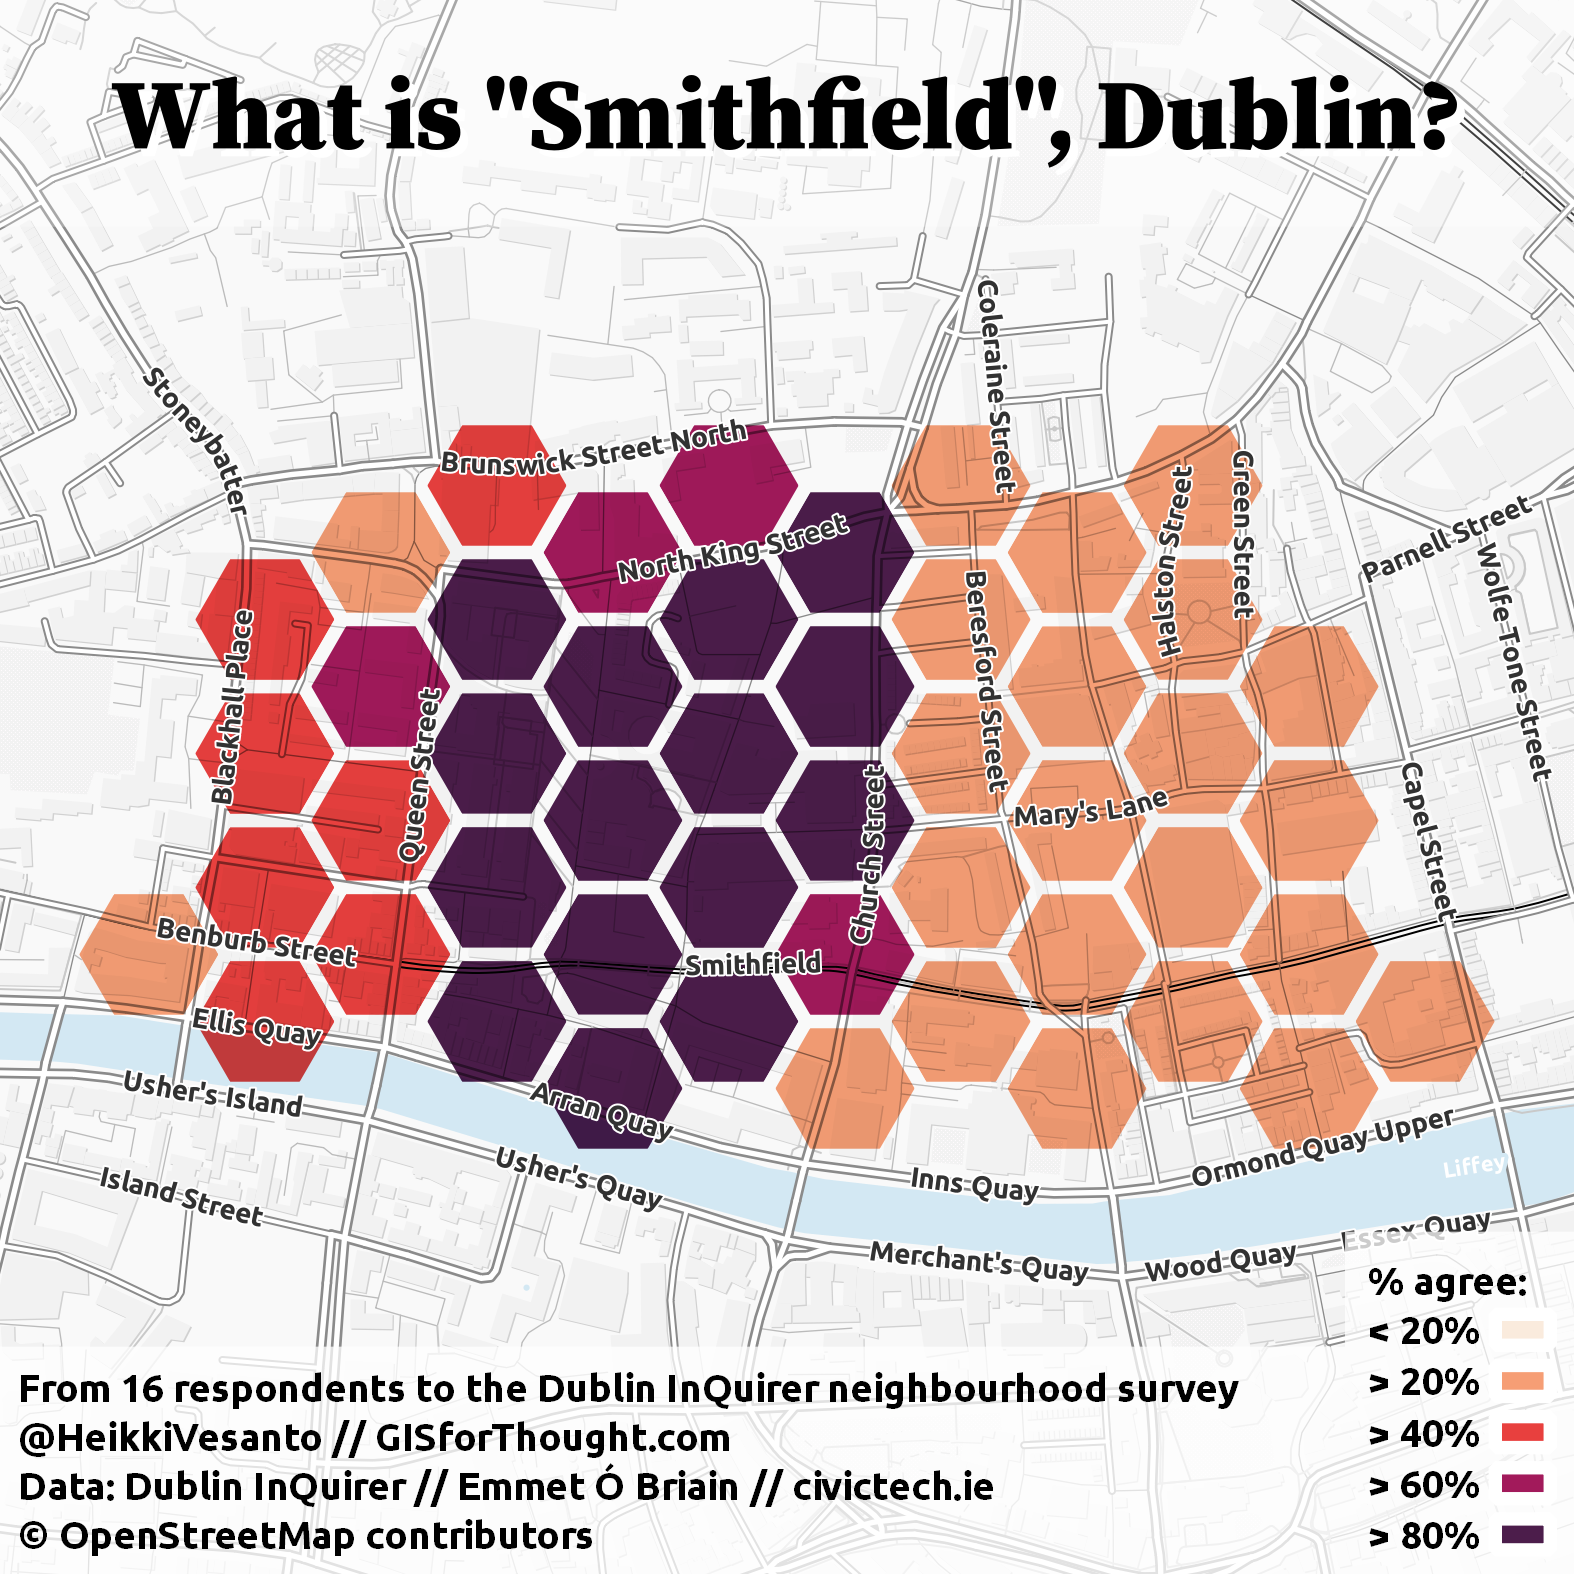
Smithfield,
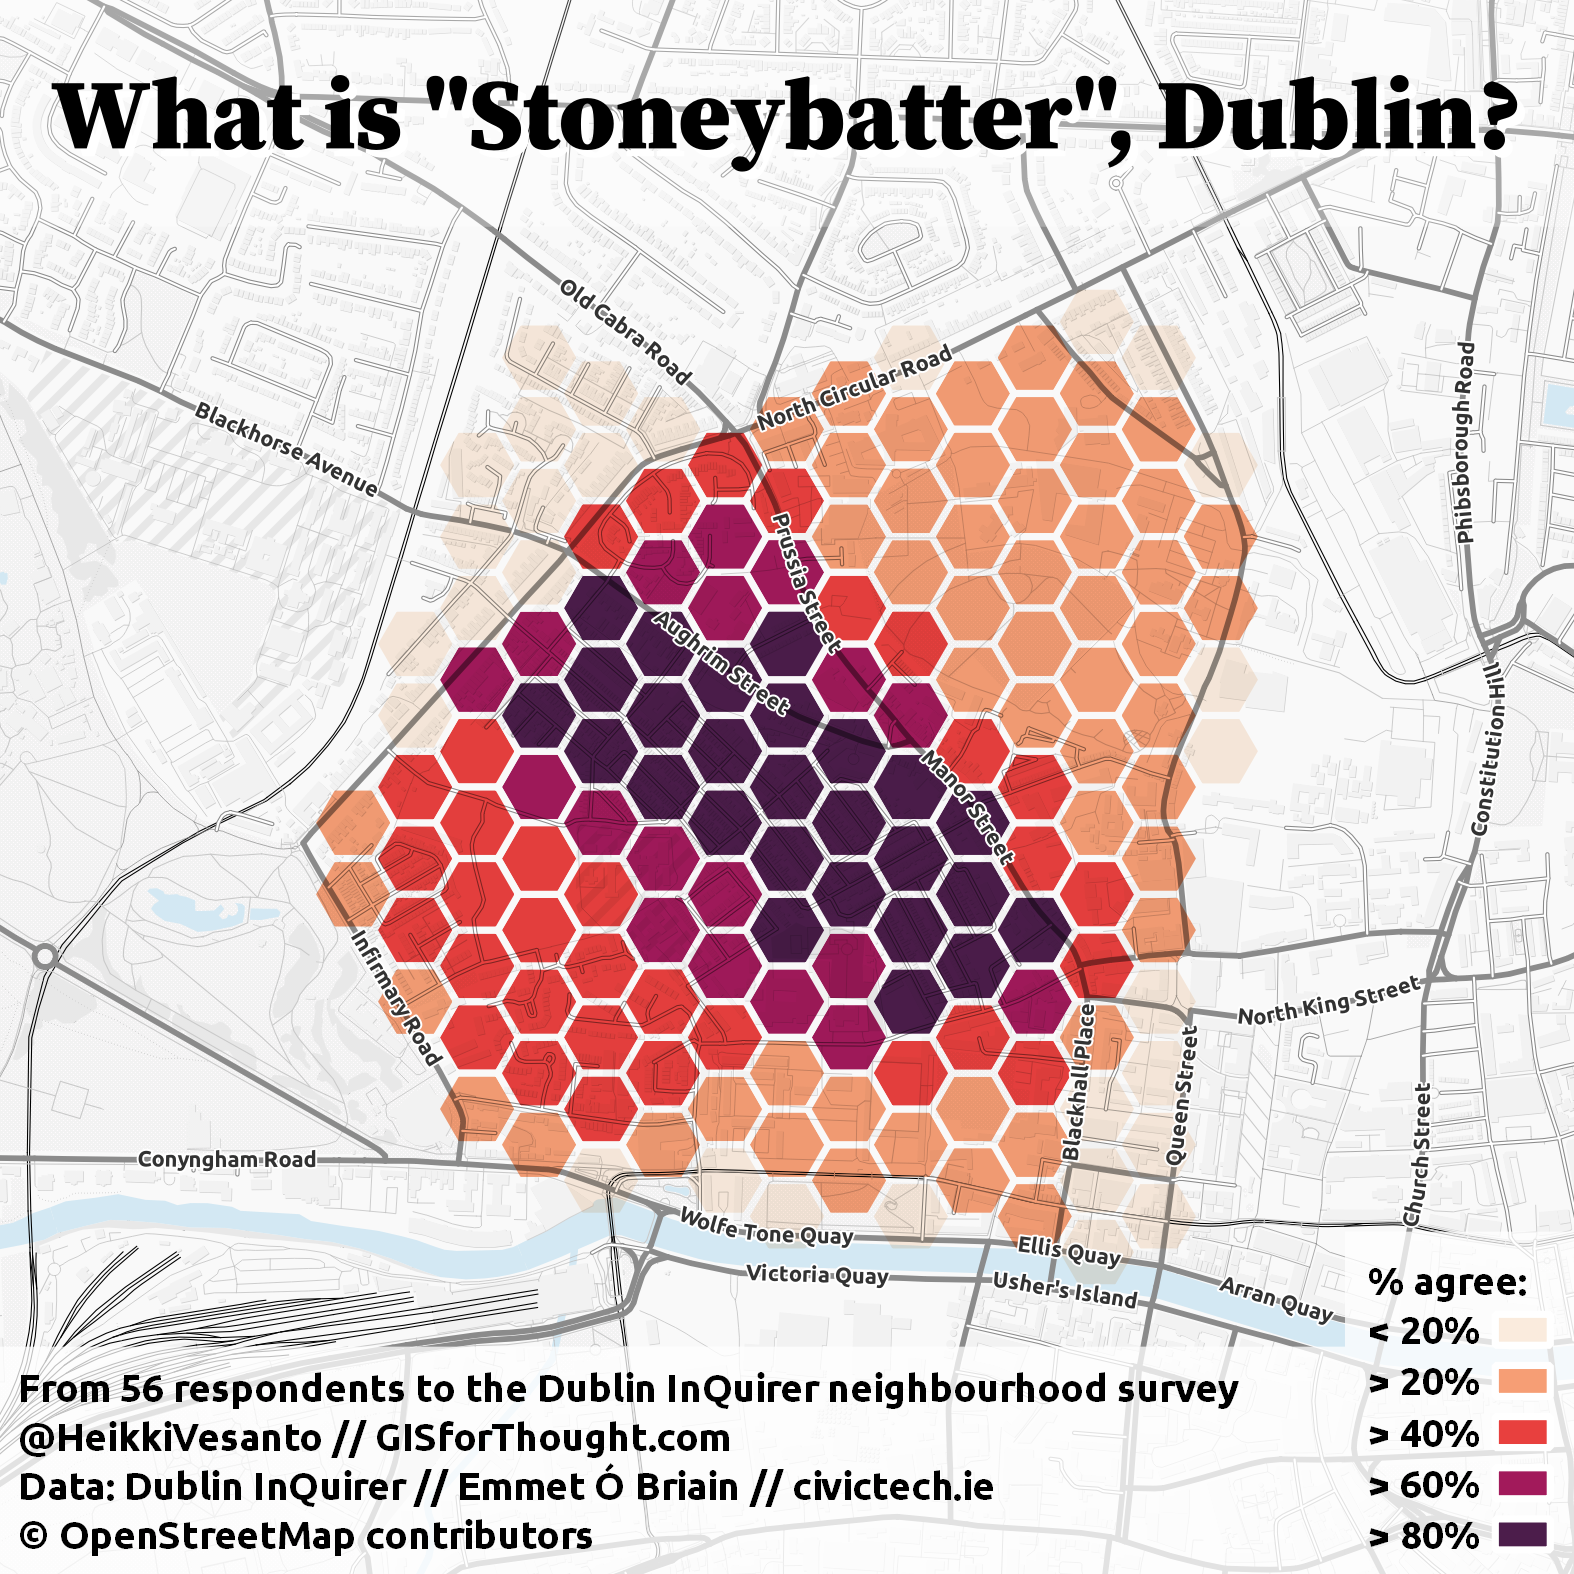
Stoneybatter,
Sutton,
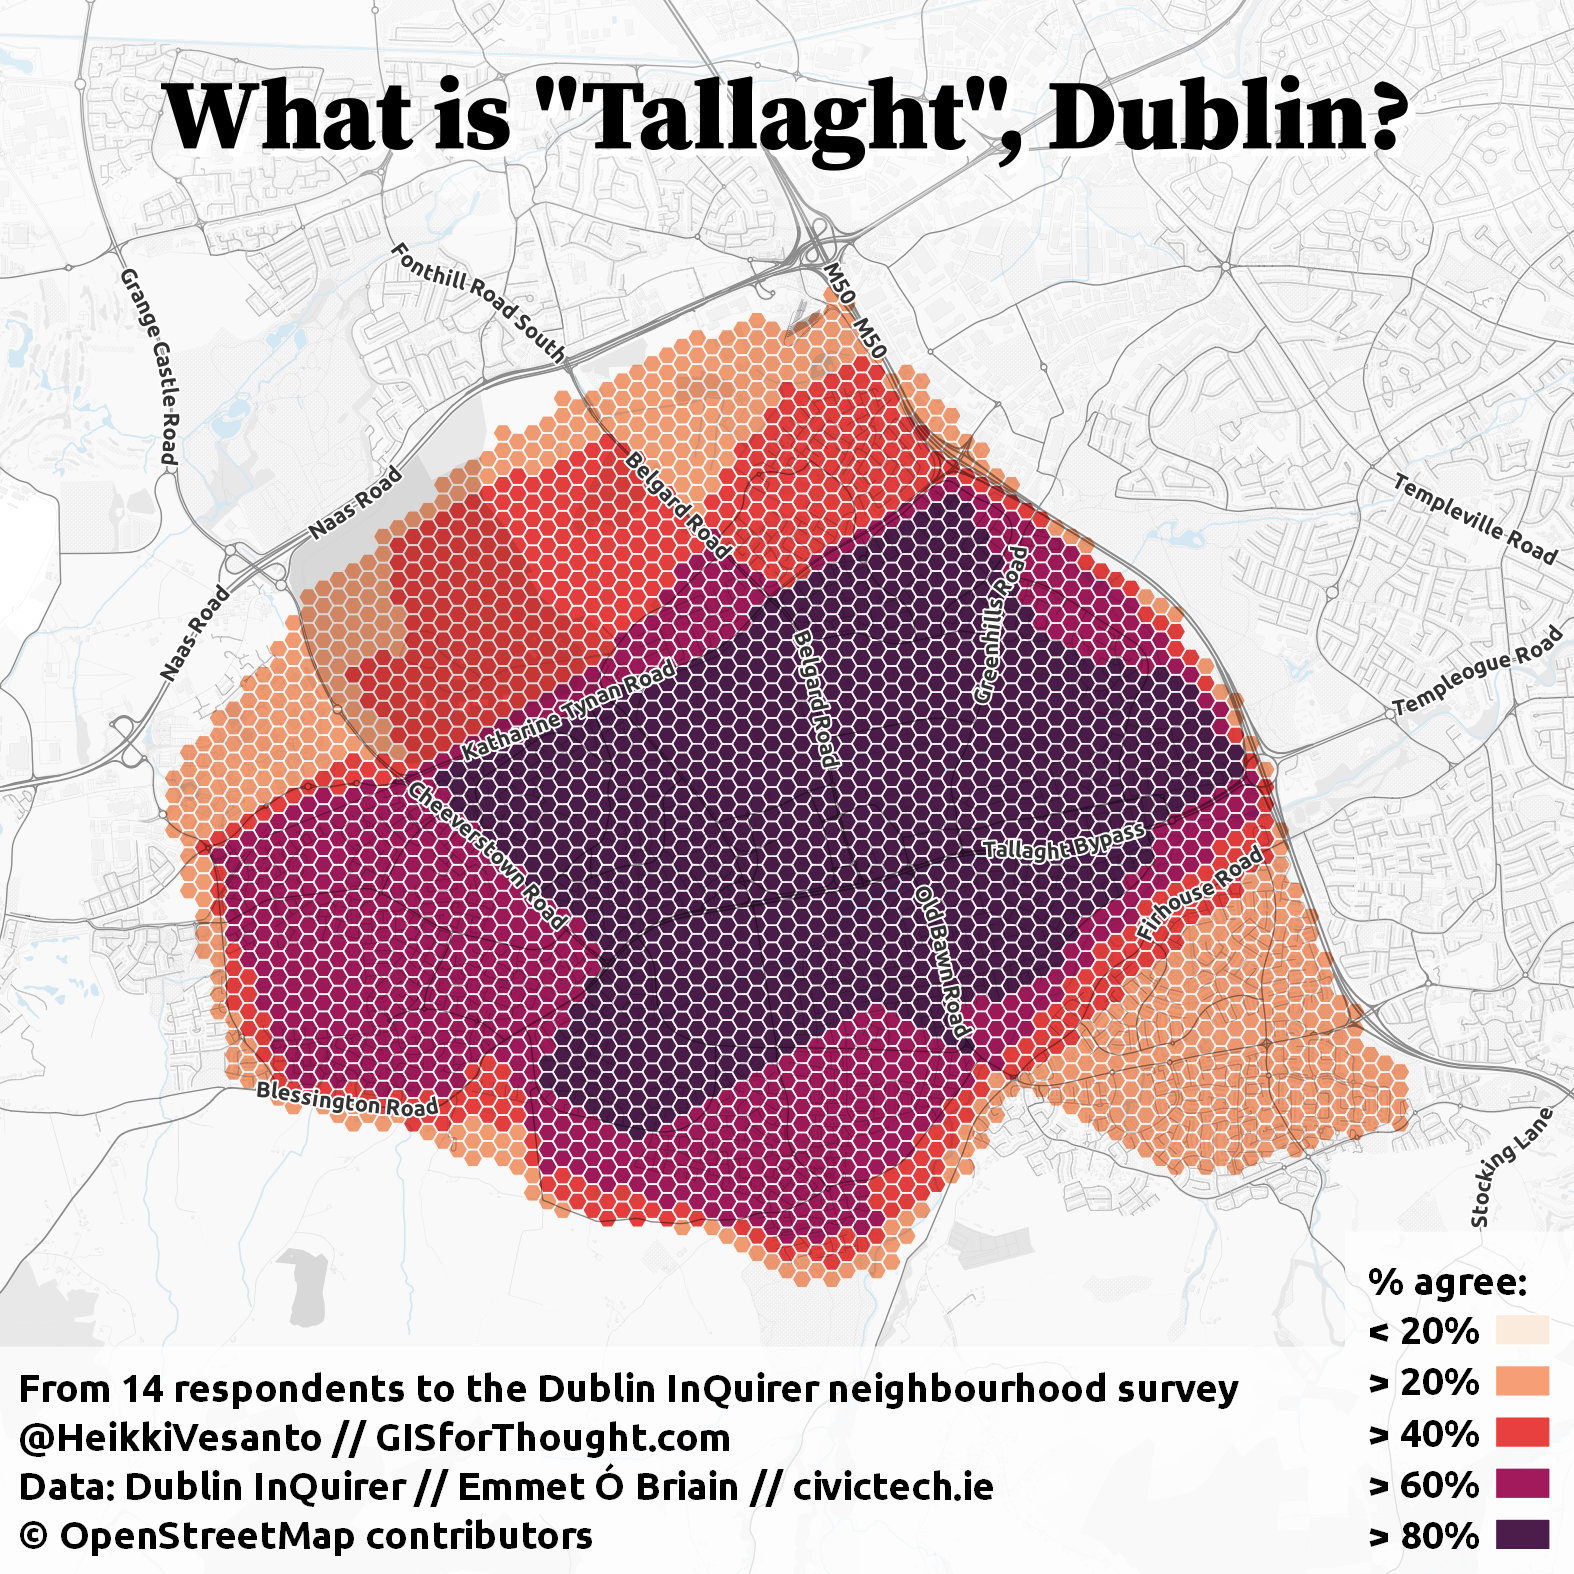
Tallaght,
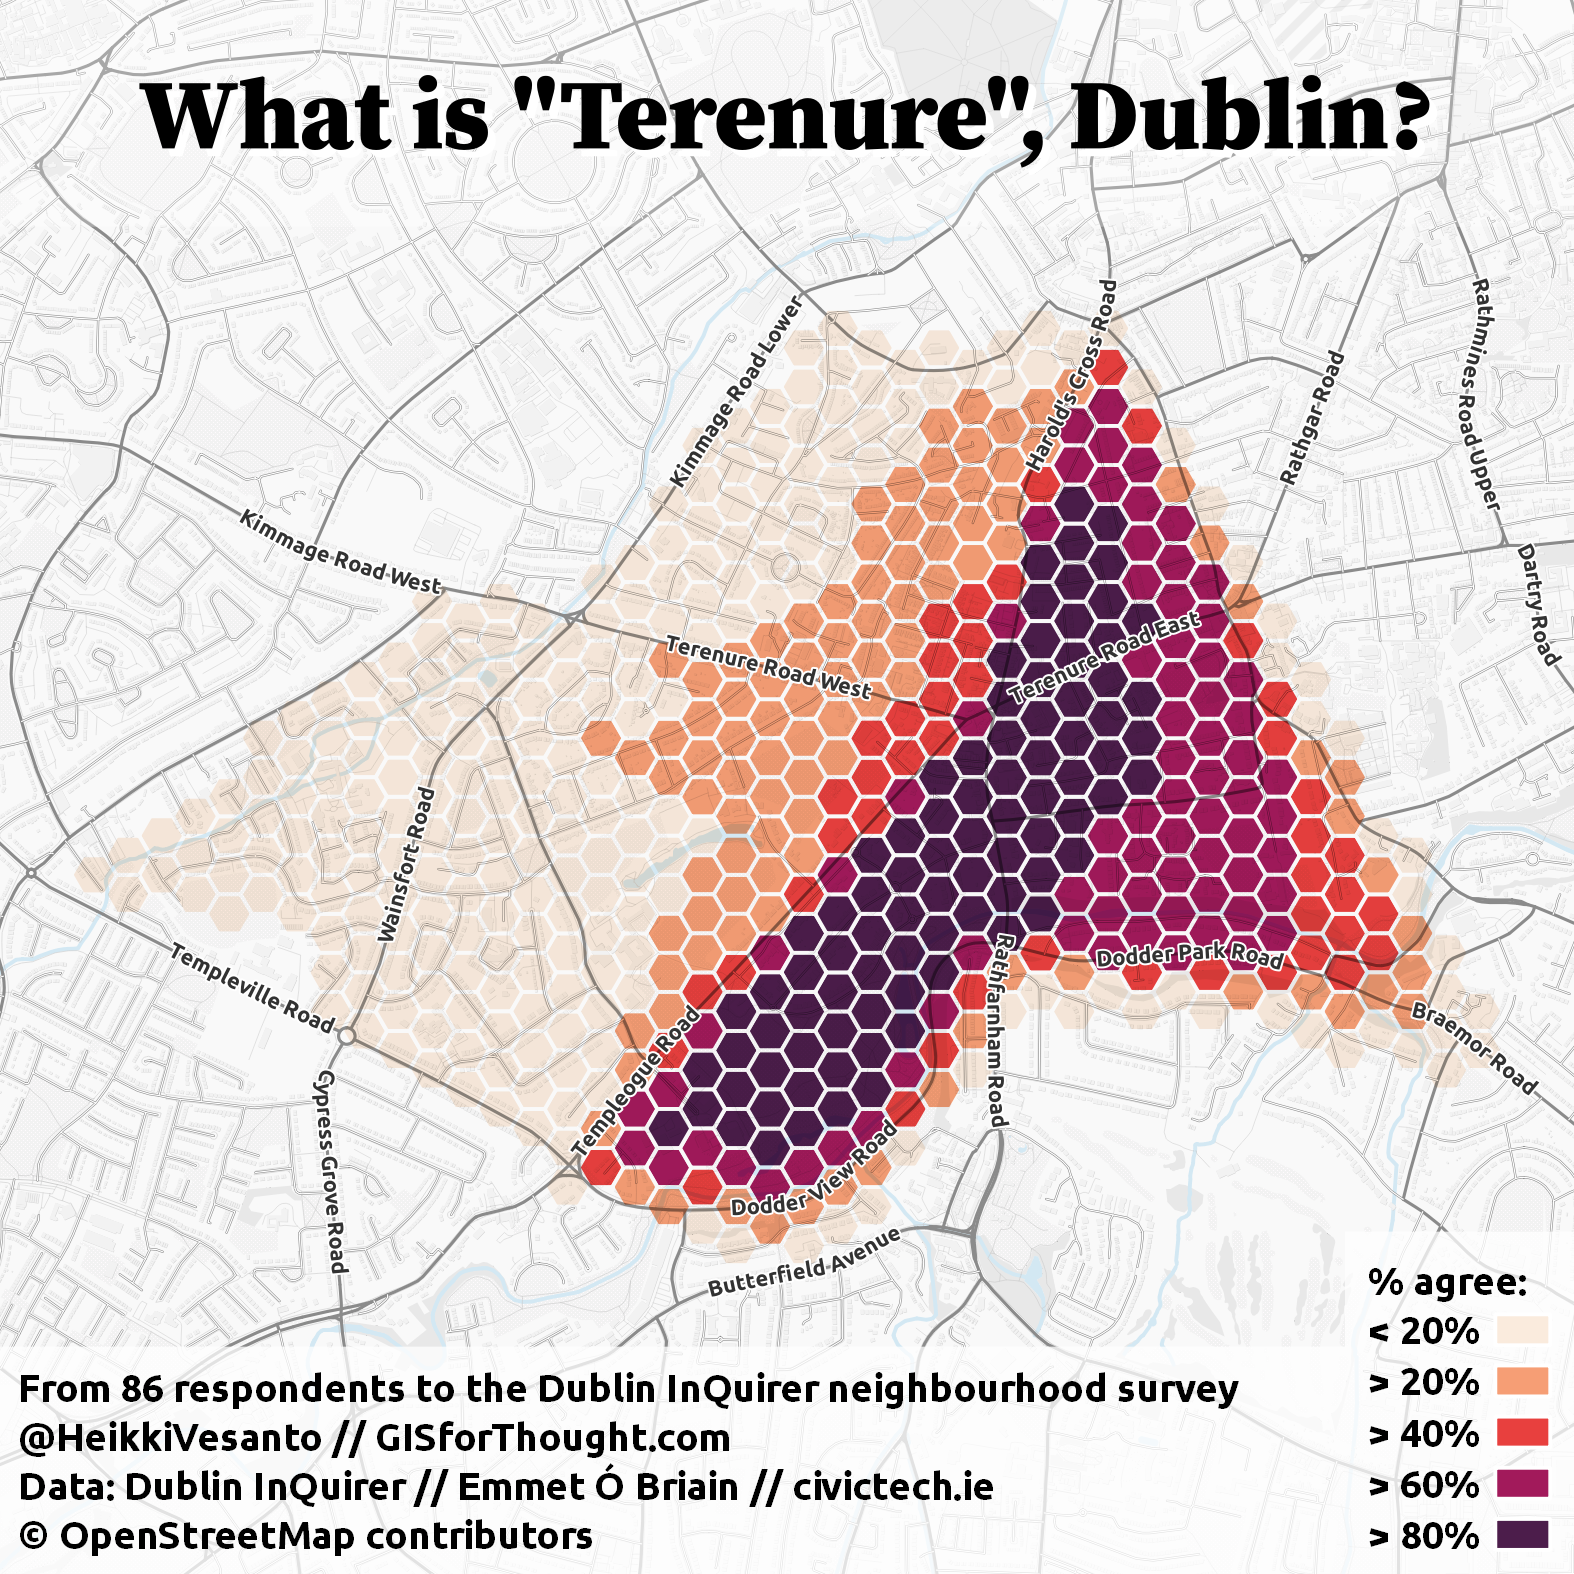
Terenure,
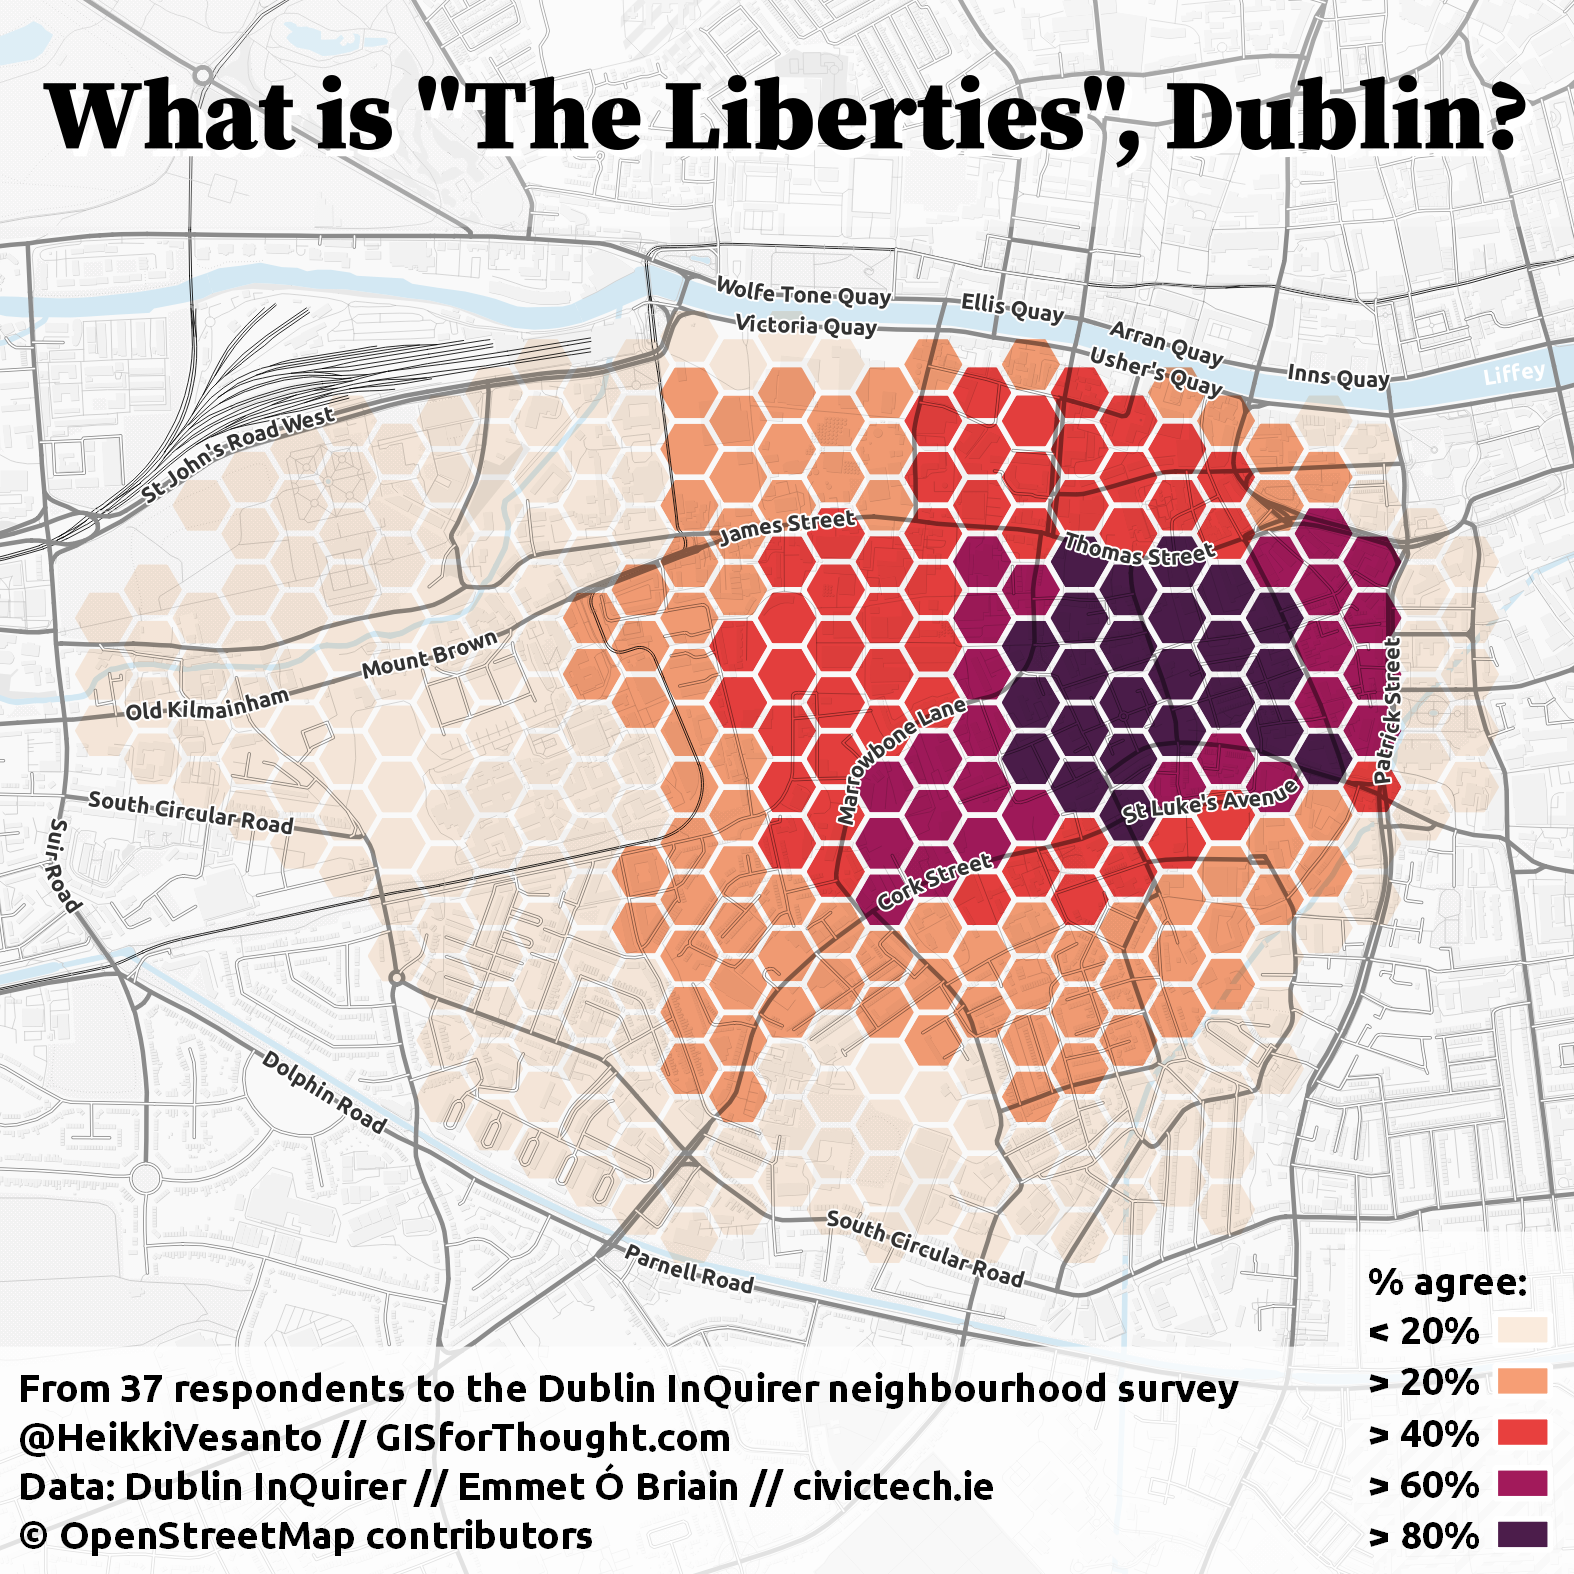
The Liberties,
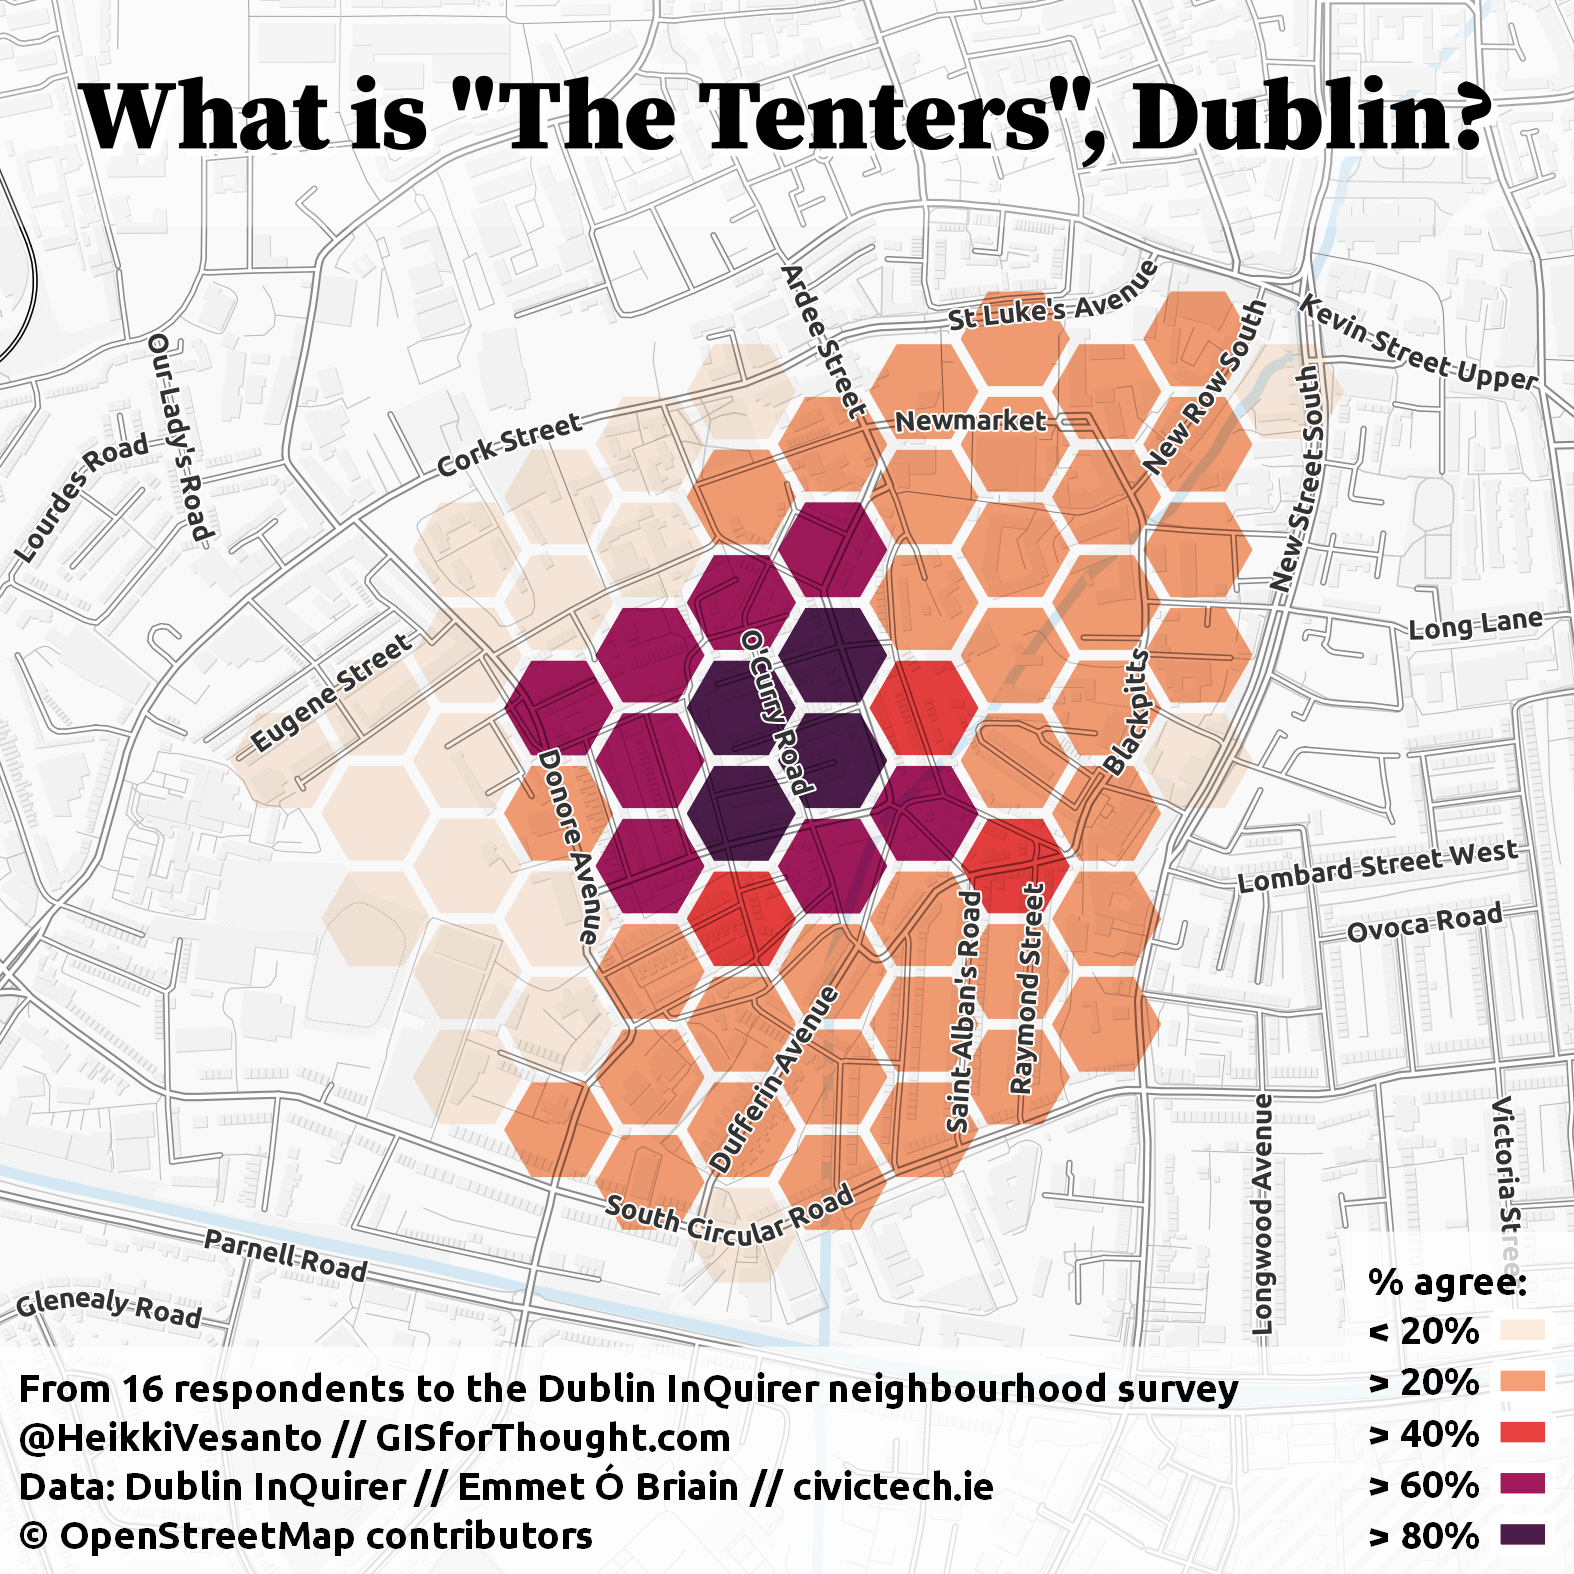
The Tenters,
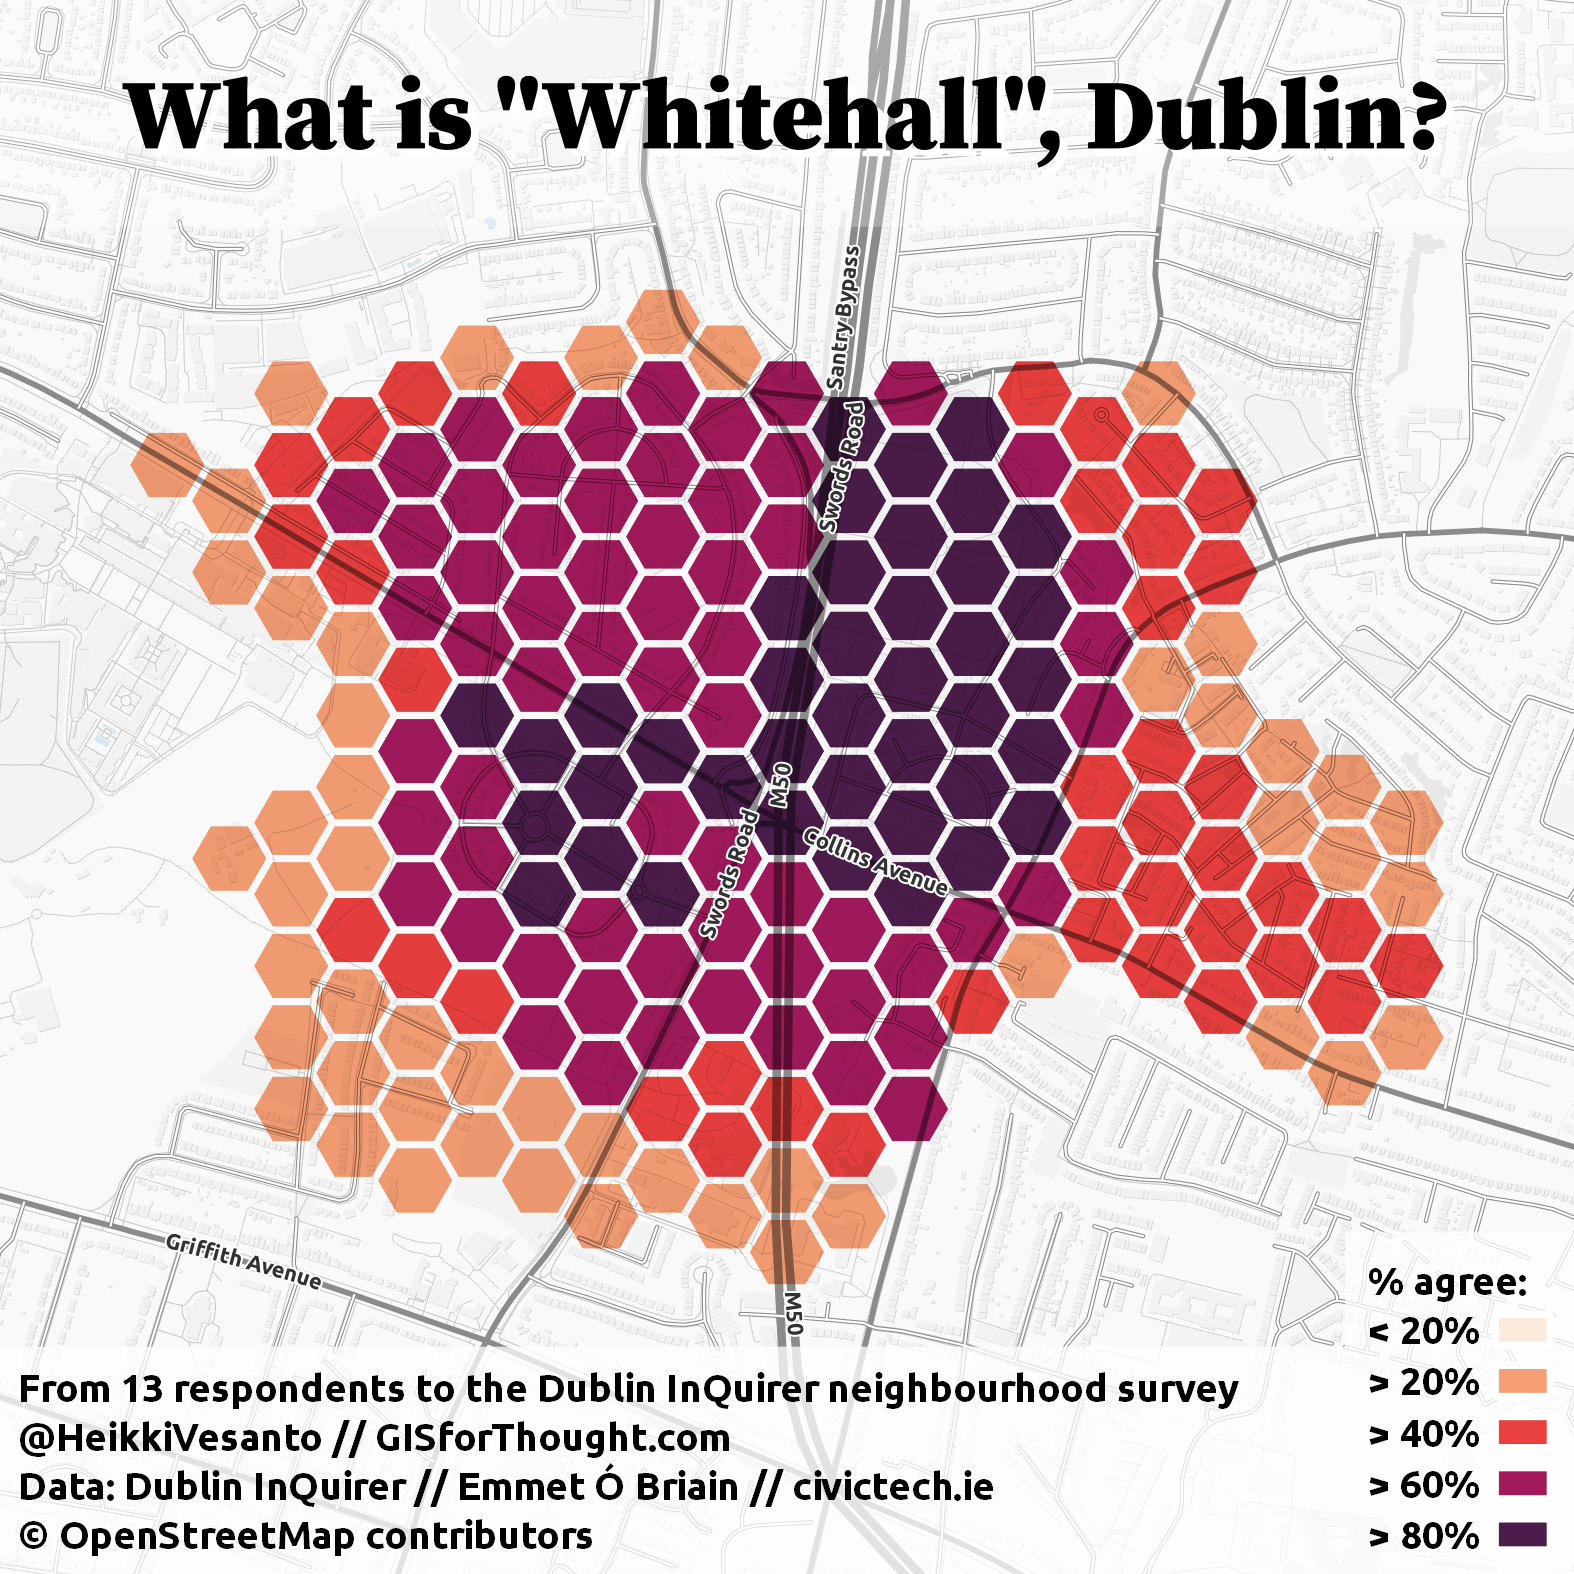
Whitehall


Creation:
These maps were created with Python for downloading the data, PostgreSQL/PostGIS for the data processing, and QGIS for the rendering.
There is not a full tutorial, but the processing code is available in here: