Every Person in Scotland on the Map

Winner of the 2016 OS OpenData Award for Excellence in the use of OpenData from the British Cartographic Society.

Full size.

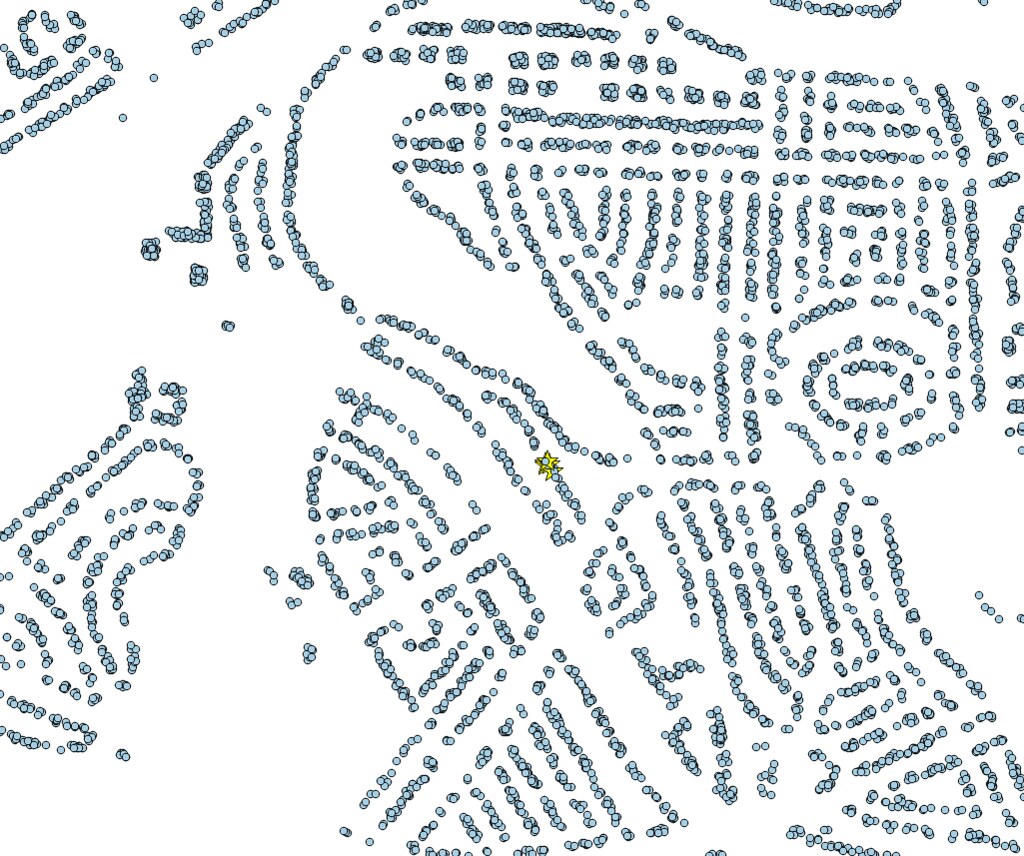
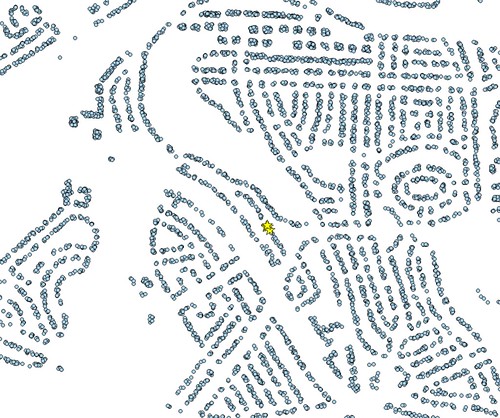
The mapping process creates a random point within a building shell inside of a postcode area, which is repeated for every person in a postcode. This is in contrast to a simpler process, which does not take into account buildings at all, working simply with postcode areas. This can be seen in my previous post: Population of Scotland Mapped

Inspired by:
The Guardian – Every person in England and Wales on a map by Chris Cross

Based on the 2011 Scottish Census population data.

Data from the National Records of Scotland.

Combined with the Ordnance Survey, Open Map product.

Rendered with: QGIS tile writer python script.

Highlighting Selections in QGIS

I have been working a lot with points recently, and one thing with the default selection highlighting in QGIS is that selections do not really stand out. This is especially true with point layers.

A bit of an extreme example, but there are 15 points selected in the middle of this image.

hard_to_see

However, we can remedy this with the Expression Plus plugin (by Nathan Woodrow) and a rule based symbology.

plugin

This plugin adds a great function: isselected()

With this we can easily create rule to symbolise features that are selected.

The rule for symbology is as follows:

QGIS 2.12+:

isselected( @layer_name )

QGIS 2.8:

isselected( 'ACTUAL_NAME_OF_LAYER' )

So we can see that 2.12 has added a slightly more dynamic way of applying the symbology.

symbology

We can now slightly more easily see our selection.

more_visible

But one final setting. With symbol levels we can really make the selections pop.

symbol_levels

Symbol levels can be set from the bottom right of the styles tab, through rendering order. We simply want out selection to have a higher number than the other symbologies. Thus being rendered in a later pass and appearing on top.

final_selection

Much better.