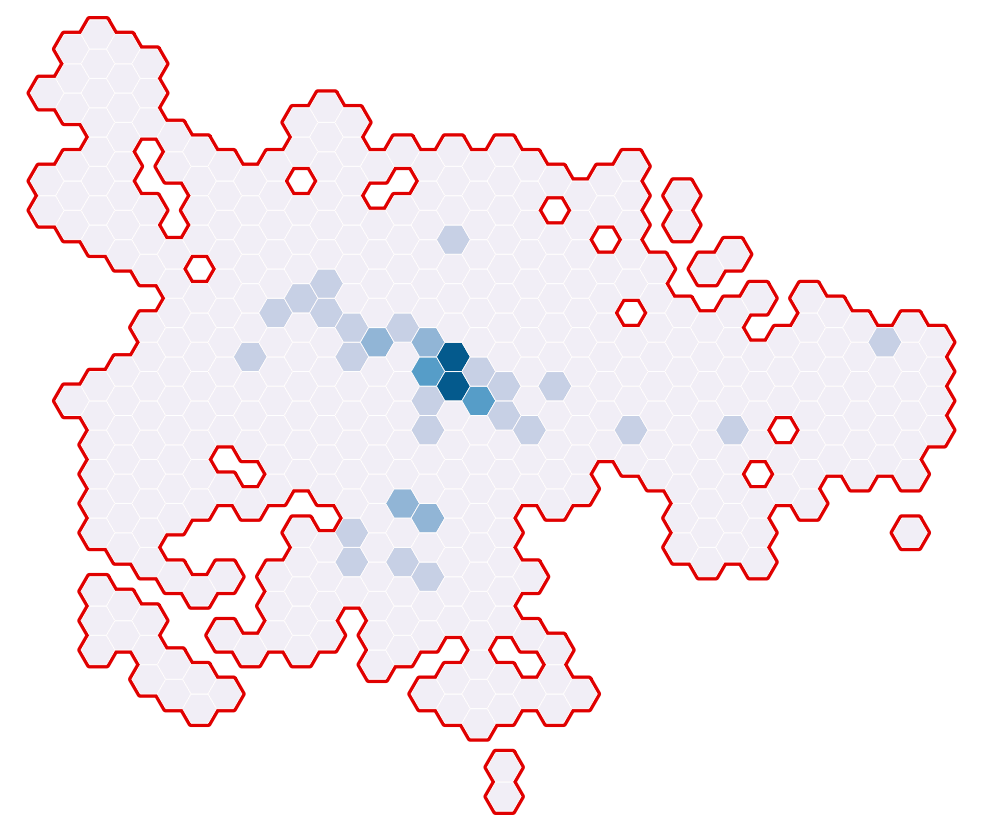
I had an effect of an outline around the grid in the Glasgow Commercial Property Density heatmap. I really like the effect, but to create it I had to save the grid itself as a new file, dissolve it and then symbolise it. There should be a way to do it simply through symbology. When working on some categorised symbology I though symbol levels would be the way to do it, and QGIS 2.6 actually made it possible.
I am not a huge fan of how QGIS deals with polygon boundaries, shared boundaries usually become thicker than non-shared boundaries. But we can still achieve some really good outputs.
We will start out with a simple categorised symbology.
I would like to remove the borders, but that results in very small gaps. We can tell by turning the project background black.
So I will set a narrow white border, which is very unintrusive.
Now for the QGIS 2.6 touch. We can now turn a graduated symbology into a rule based one, simply set up a graduated symbology and then select rule based and your rules will be automatically generated.
For the border we create a catch-all rule that has our desired border.
Resulting in.
But then setting up our symbol levels.
We get the desired result.
Final output.
Desired result with one dataset, excellent.

![Screenshot[23]](https://gisforthought.com/media/2014-11-14_15736358562_bbccdff080_o.png)
![Screenshot[24]](https://gisforthought.com/media/2014-11-14_15549621307_43123f5dd2_o.png)
![Screenshot[25]](https://gisforthought.com/media/2014-11-14_15549621197_fe1a65d6d2_o.png)
![Screenshot[26]](https://gisforthought.com/media/2014-11-14_15736358612_745c971e57_o.png)
![Screenshot[27]](https://gisforthought.com/media/2014-11-14_15711099536_77d32870c9_o.png)
![Screenshot[28]](https://gisforthought.com/media/2014-11-14_15549365678_3541456eaa_o.png)
![Screenshot[29]](https://gisforthought.com/media/2014-11-14_15549620987_c0614c4a8d_o.png)
![Screenshot[30]](https://gisforthought.com/media/2014-11-14_15734814425_9ca5a332d9_o.png)
![Screenshot[31]](https://gisforthought.com/media/2014-11-14_15114855834_9bf8c3f15b_o.png)

