Skip to content

GISforThought

GIS and Mapping Blog from Ireland

  • Home
  • About Me
  • Post Archive
  • Portfolio
GISforThought

London Bus Route Density

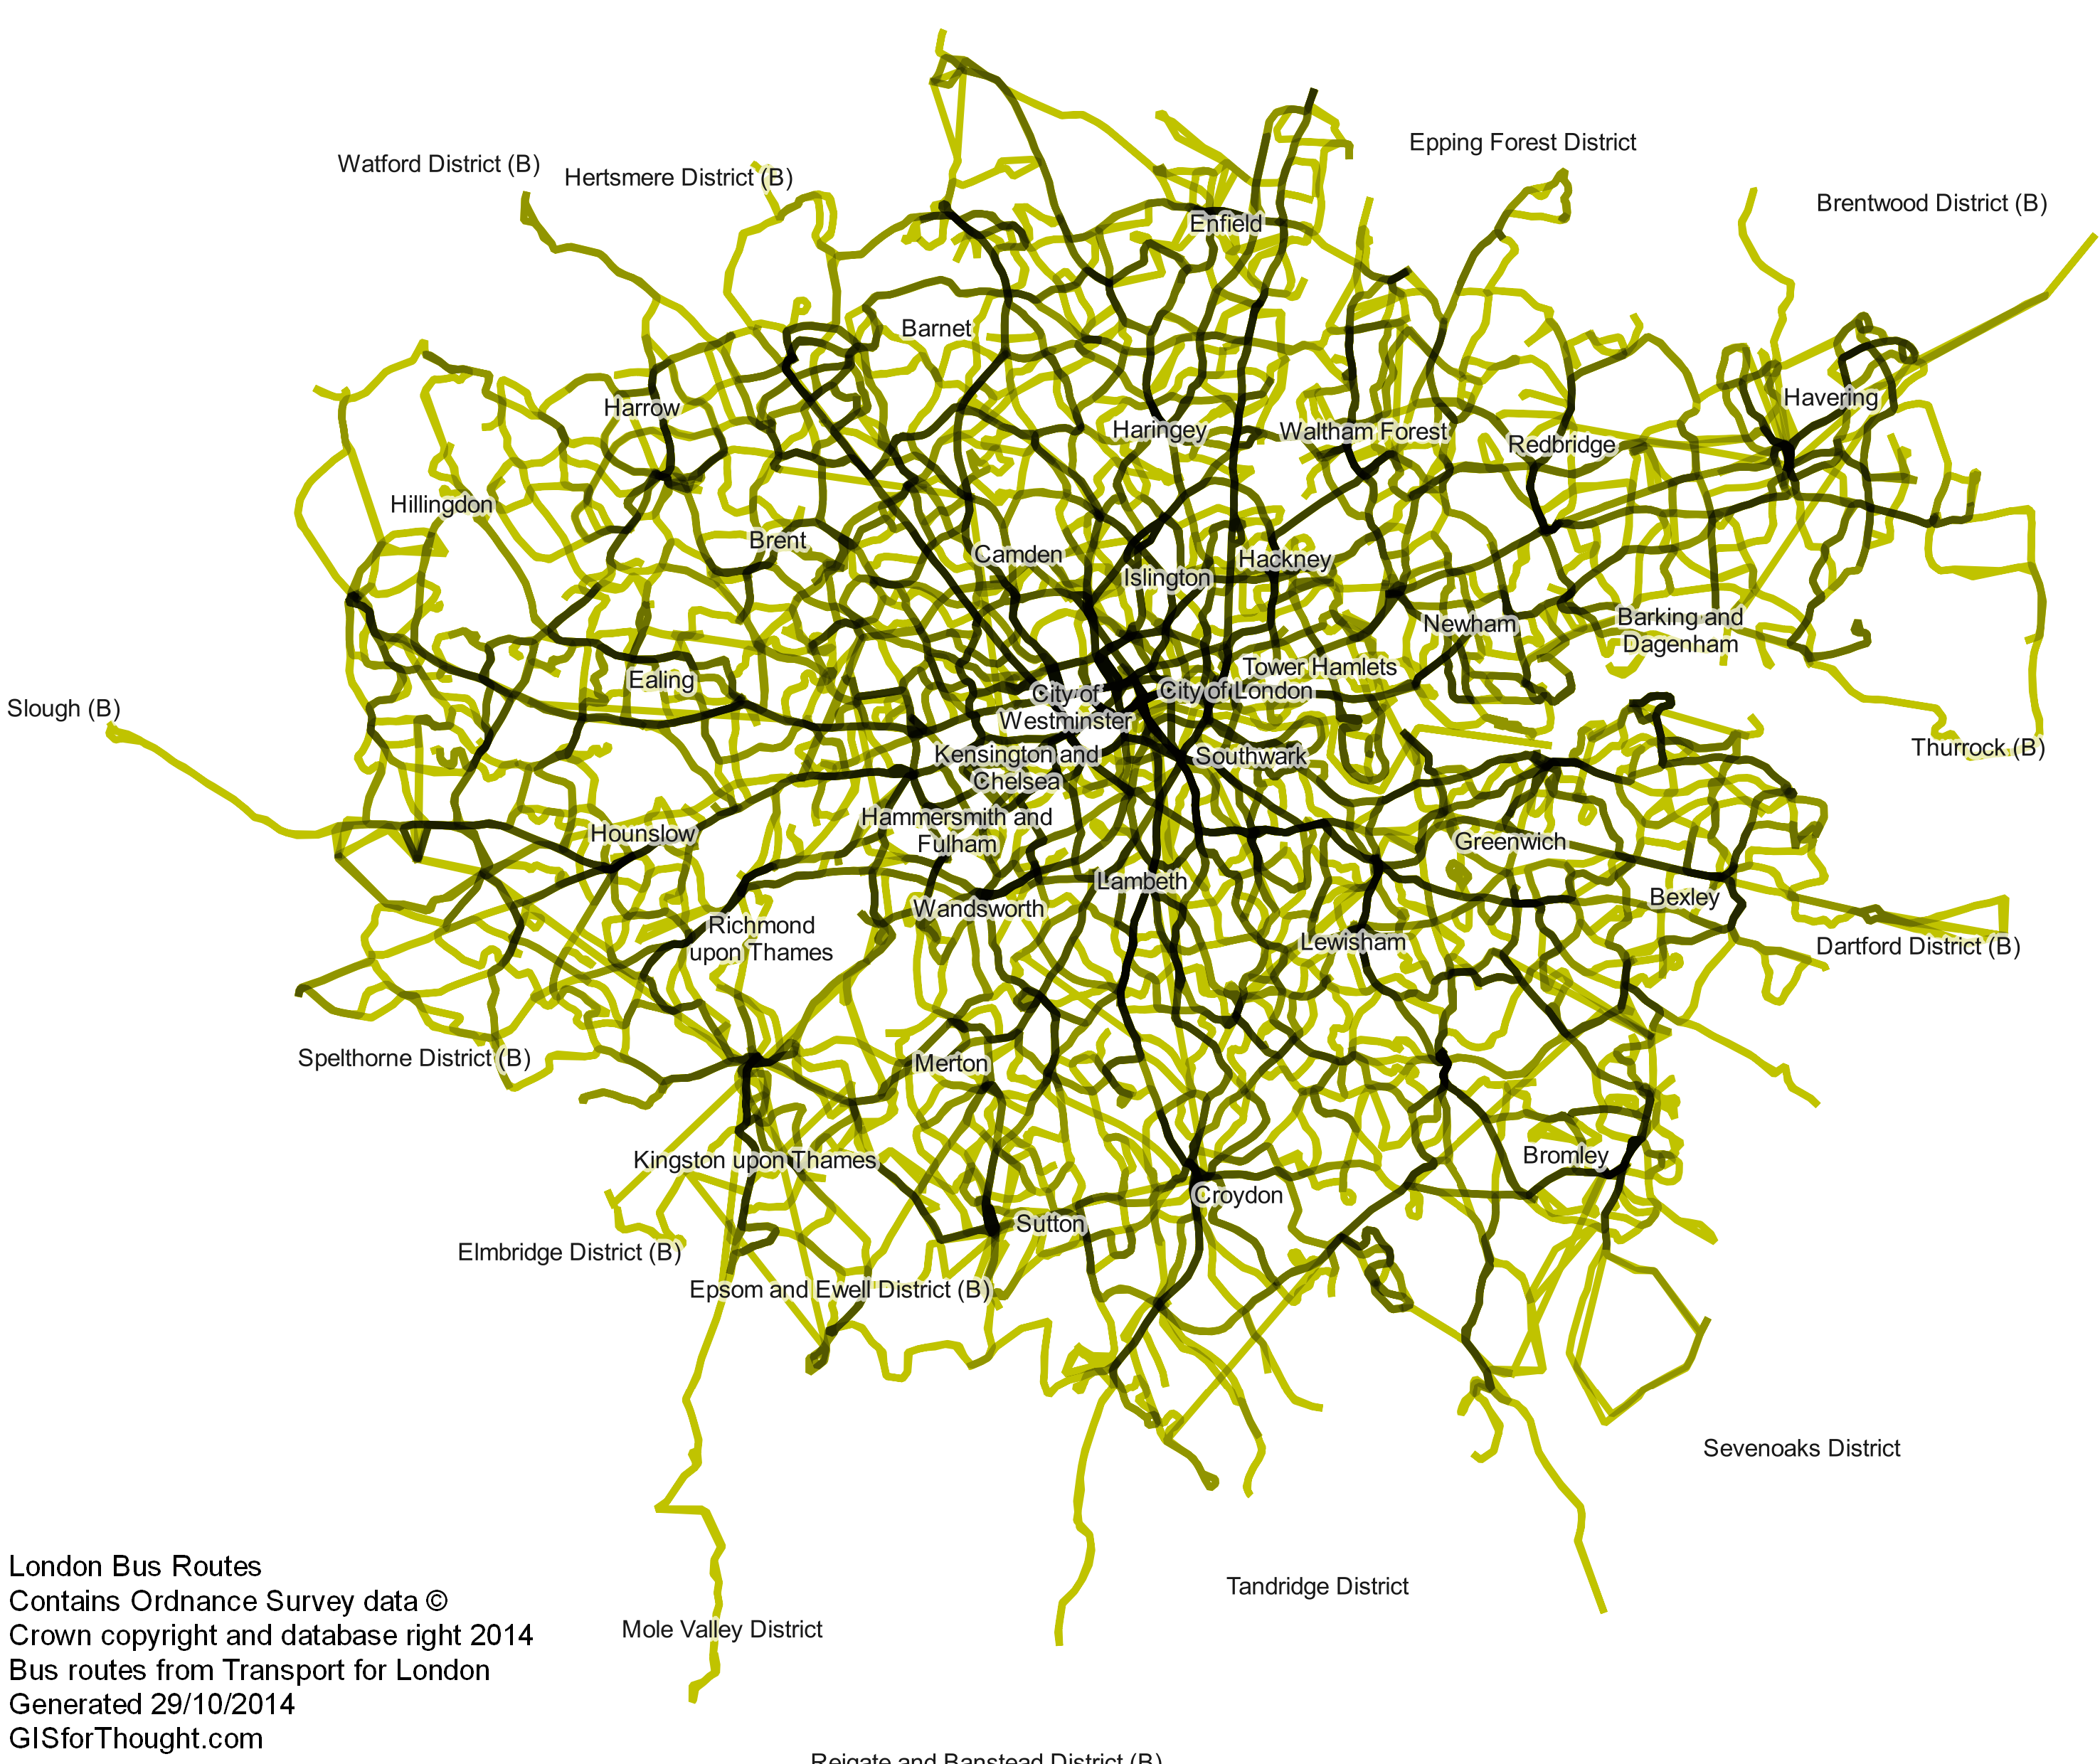
London bus routes overlaid. Simple heatmap generated with yellow lines and a multiply blending mode in QGIS.

London Bus Heatmap

Author Heikki VesantoPosted on November 13, 2014July 27, 2022Categories All, Mapvember, OSGEO, QGIS

Post navigation

Previous Previous post: Glasgow 3D Residential Property Density QGIS2threejs
Next Next post: Polygon Outlines in QGIS

Post Archive

Latest Posts

  • Storm Éowyn ImpactFebruary 7, 2025
  • My Strava Activities from the Same Place at the Same Time AnimatedSeptember 20, 2022
  • Luas Map Compared to Real GeographyAugust 22, 2022
  • Scotland’s Cartographic OutlineAugust 9, 2022
  • Made With OpenStreetMapAugust 8, 2022
  • Featured PostsJuly 21, 2022
  • Commuting in Ireland MappedJanuary 19, 2022
  • Dublin Neighborhoods MappedJanuary 15, 2022
  • 30 Day Map Challenge 2021November 30, 2021
  • 30 Day Map Challenge 2019February 24, 2020

Featured Posts

  • Storm Éowyn ImpactFebruary 7, 2025
  • Luas Map Compared to Real GeographyAugust 22, 2022
  • Dublin Neighborhoods MappedJanuary 15, 2022
  • 30 Day Map Challenge 2021November 30, 2021
  • 30 Day Map Challenge 2019February 24, 2020
  • Every Person in Great Britain MappedMarch 5, 2019
  • Storm Harvey QGIS Geometry GeneratorSeptember 6, 2017
  • Schiehallion – Contour lines and Maskelyne’s observatoryJune 2, 2015

Categories

  • 30 Day Map Challenge (2)
  • All (96)
  • Animations (12)
  • Featured (8)
  • Finland (3)
  • Ireland (14)
  • Maps (18)
  • Mapvember (30)
  • OpenStreetMap (6)
  • OSGEO (50)
    • Leaflet (4)
    • PostGIS (15)
    • QGIS (39)
  • Scotland (33)
  • Travel (6)
  • Tutorials (12)

Popular Posts

  • Home
  • About Me
  • Post Archive
  • Portfolio
GISforThought Proudly powered by WordPress