QGIS OpenStreetMap Scales

Save as a text file ending in .xml like qgis_scales.xml

These are the scales OpenStreetMap tiles are rendered in for 96 dpi, so the map will look sharp on most monitors. These are the scales for the zoom levels.

The xml file can then be loaded into the project from:

Project> Project Properties…> General> Project scales

<qgsScales version="1.0">
    <scale value="1:554678932"/>
    <scale value="1:277339466"/>
    <scale value="1:138669733"/>
    <scale value="1:69334866"/>
    <scale value="1:34667433"/>
    <scale value="1:17333716"/>
    <scale value="1:8666858"/>
    <scale value="1:4333429"/>
    <scale value="1:2166714"/>
    <scale value="1:1083357"/>
    <scale value="1:541678"/>
    <scale value="1:270839"/>
    <scale value="1:135419"/>
    <scale value="1:67709"/>
    <scale value="1:33854"/>
    <scale value="1:16927"/>
    <scale value="1:8463"/>
    <scale value="1:4231"/>
    <scale value="1:2115"/>
</qgsScales>

Example:

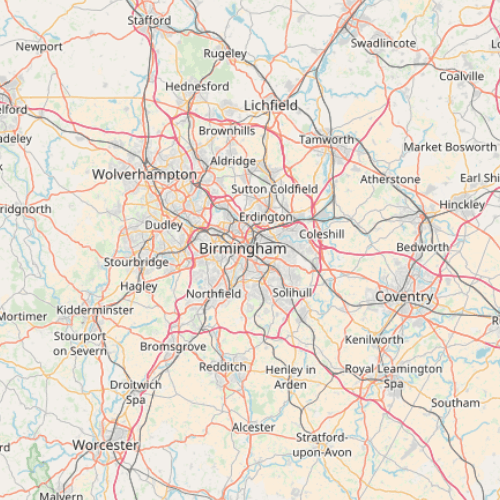
1,000,000 (QGIS default):

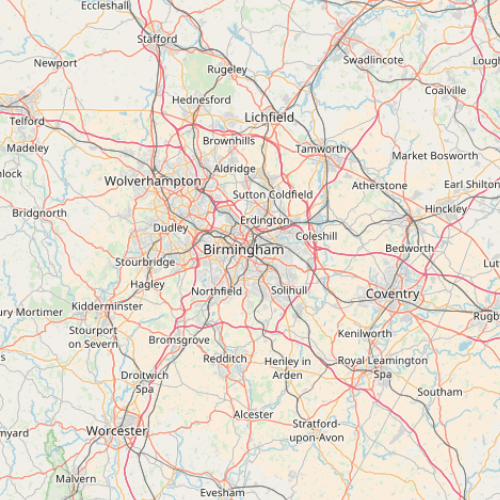
1,083,357 (OSM wiki):

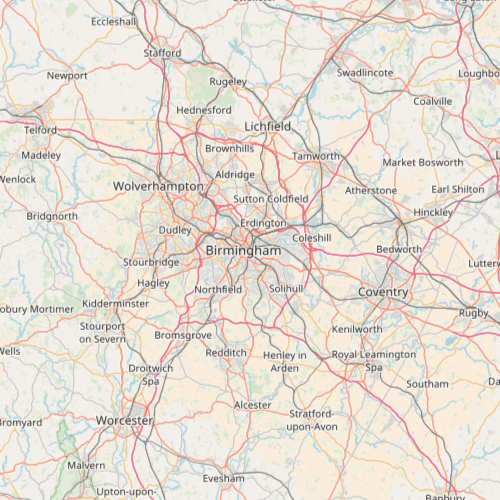
1,155,584 (From: 3liz):

Scales from:
OSM wiki

Zoom scales.

Creating OpenStreetMap History Visualisations

I created a couple of OSM visualisations for my talk at the OSGeo Ireland conference.

See: History of OpenStreetMap in Ireland

These are pretty easy to make, but take a fair bit of time. I did mine for Ireland, but should work with any part of the world.

Required software:

  • PostgreSQL with PostGIS
  • Python
  • QGIS
  • osmium-tools

This is the trickiest part, installing osmium-tools: here.

Data:

An OSM full history export. The best source for these is GEOFABRIK.

For Ireland:

http://download.geofabrik.de/europe/ireland-and-northern-ireland.html

Due to GDPR, you will have to log in with an OSM id to download the full history extracts. User ID’s are personal data.

Process:

The workflow is pretty simple. Osmium-tools provides pretty easy API access to the history files, where you can provide a data, and it will extract what OSM was like at that date. We simply need to loop through the desired dates we want to extract, and pipe the results into a workflow that loads the data into PostgreSQL. The final step is simply rendering in QGIS using the time manager plugin.

Python Script:

Github GIST:

https://gist.github.com/HeikkiVesanto/f01ea54cca499a6a144d18cf8909c940

The tables in the database will be:

  • lines
  • multilinestrings
  • multipolygons
  • other_relations
  • points

Each feature will be tagged with the date it is associated with.

Visualisation:

To visualise the data in QGIS we use simply use the excellent time manager plugin, filtering on the load_date field and with a monthly interval.

Result: