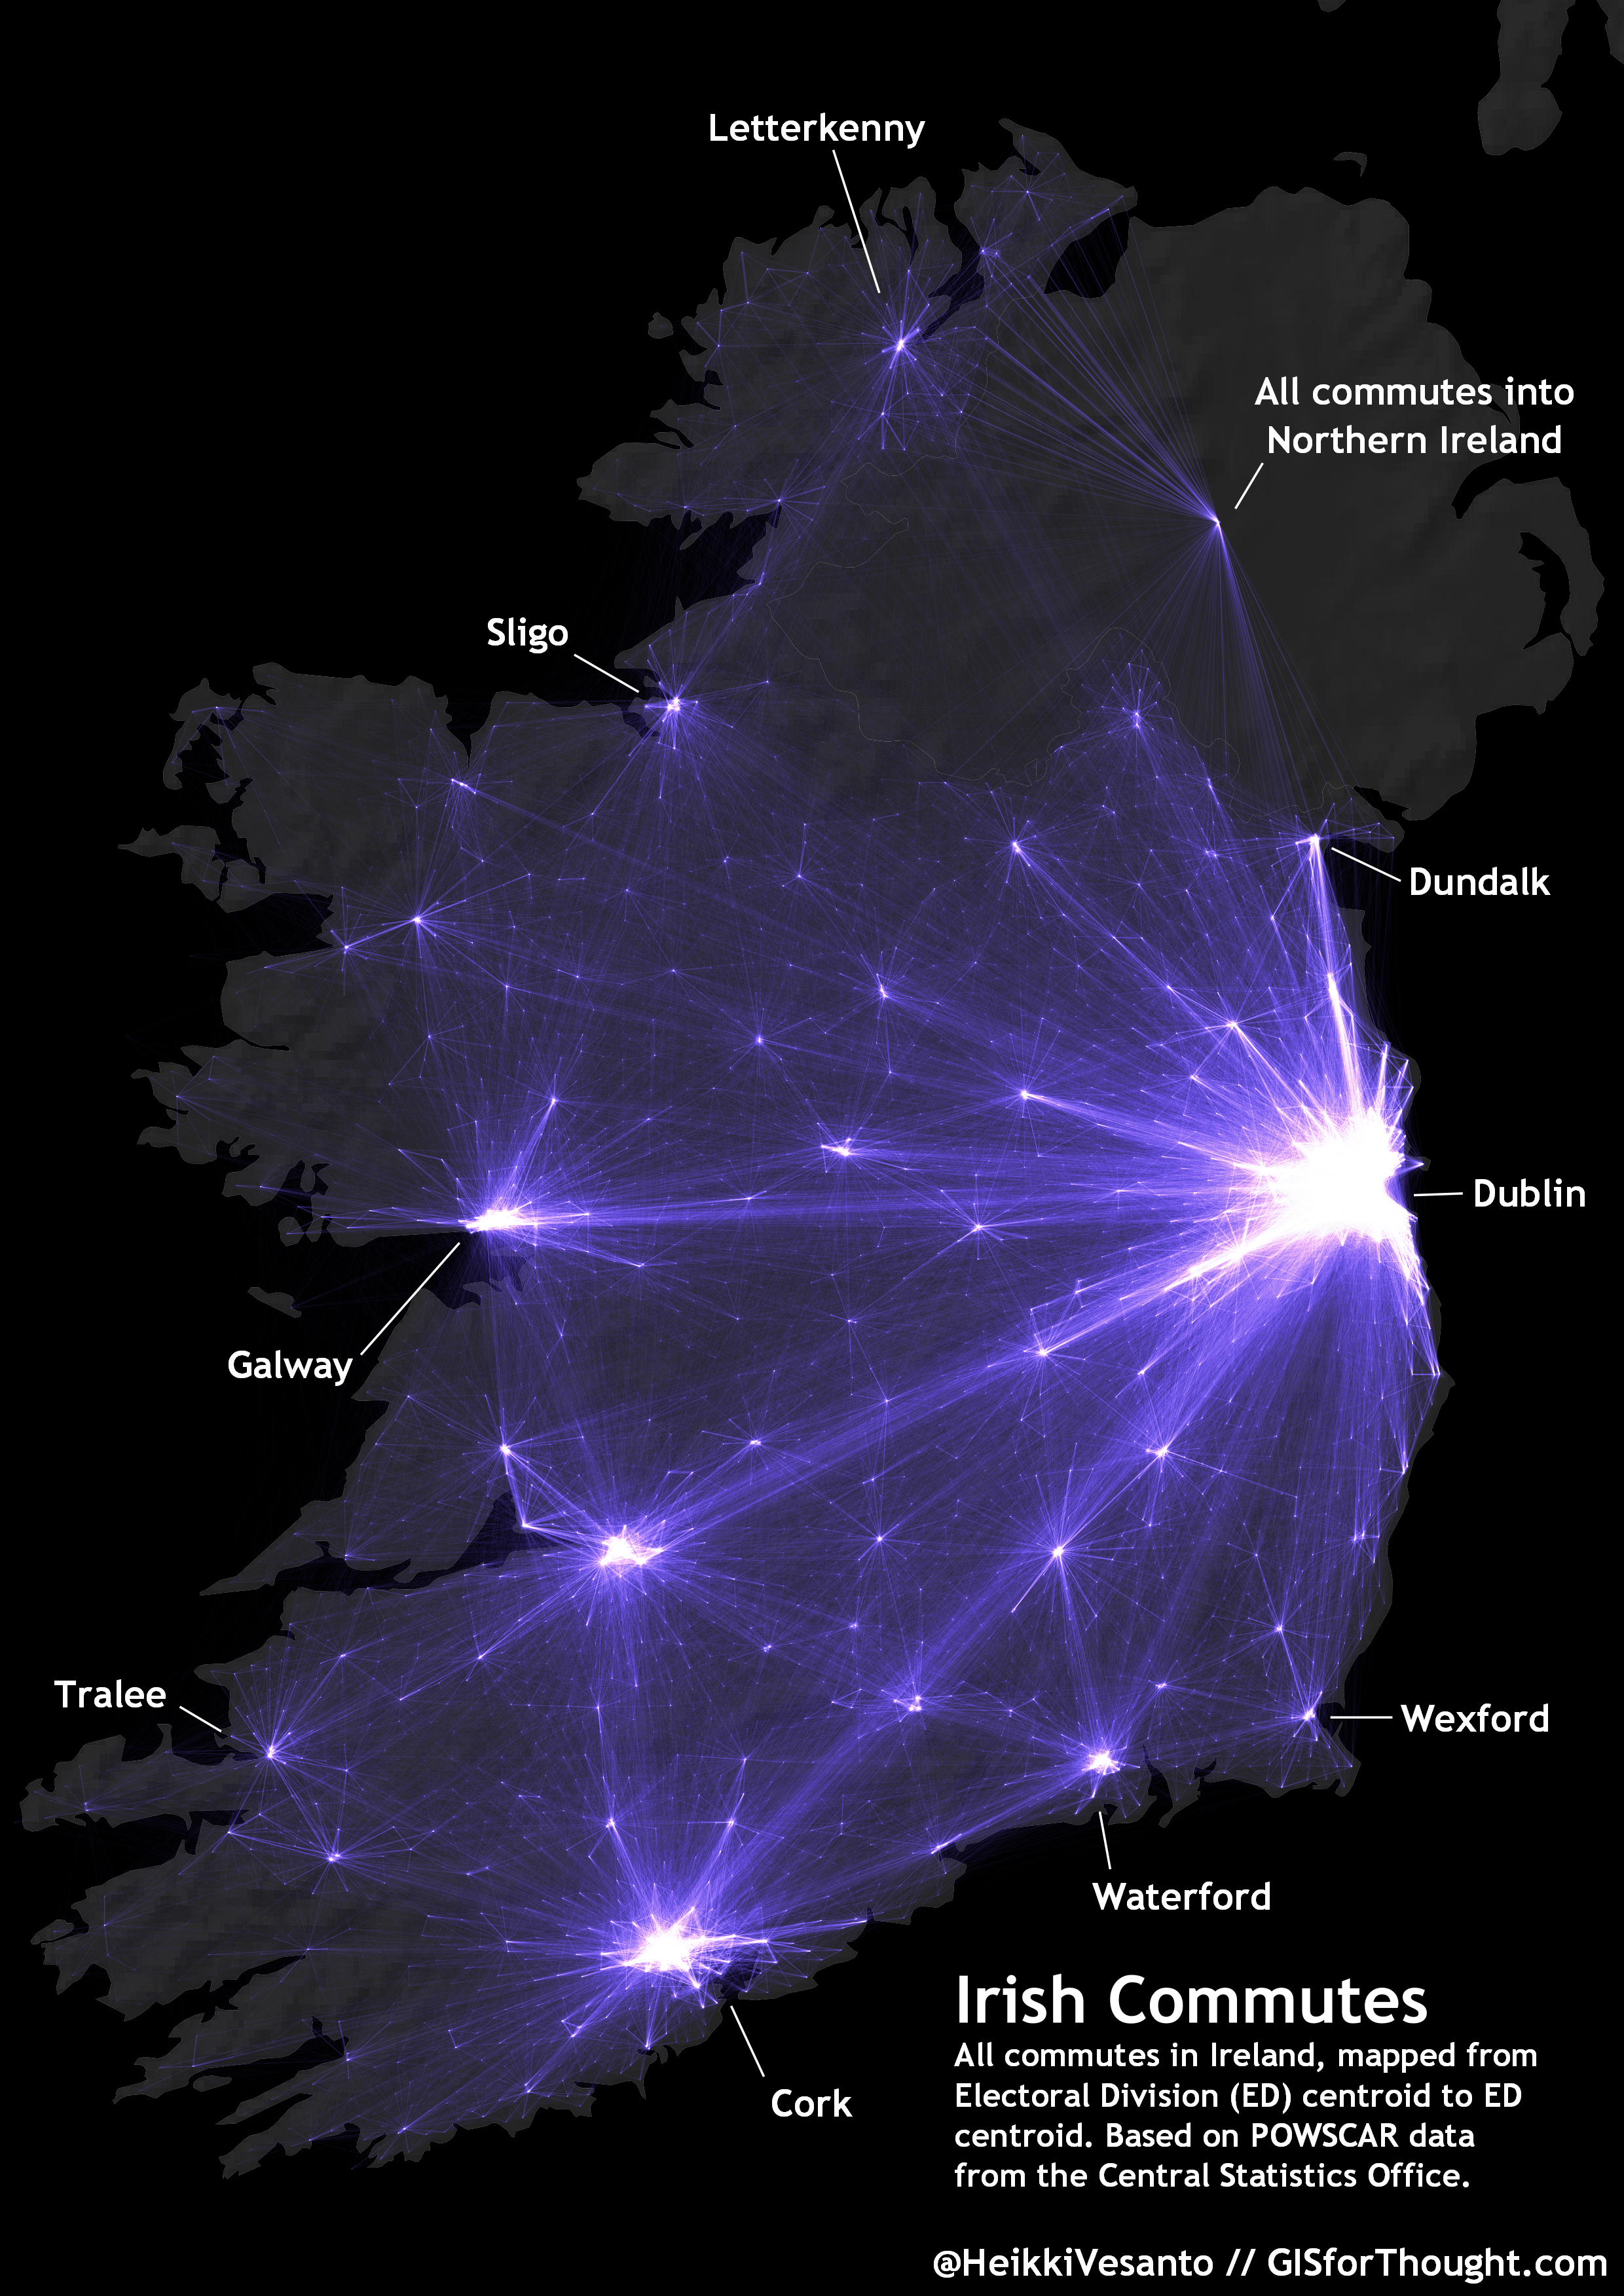
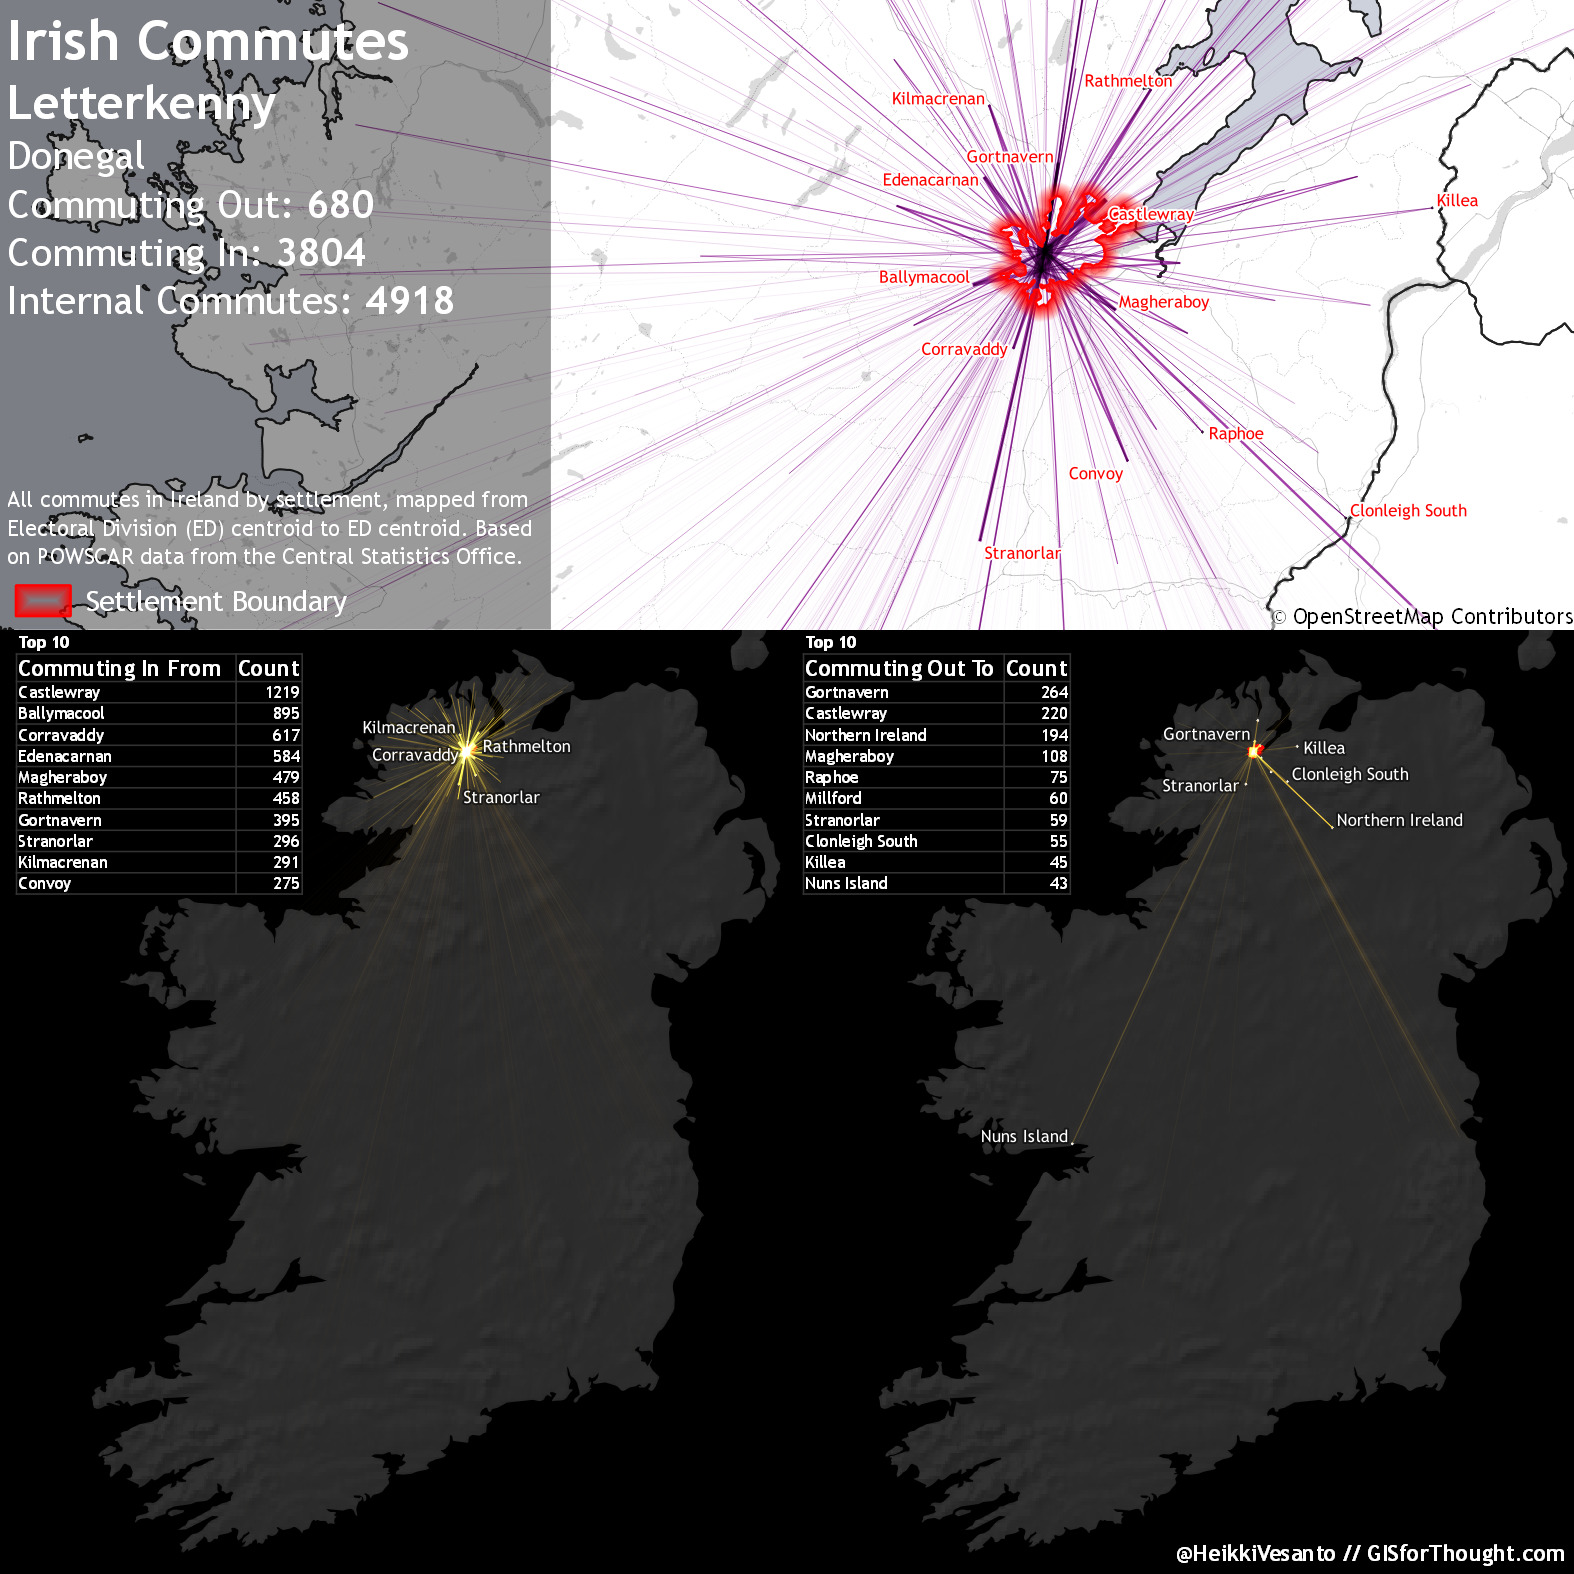
As part of the 2016 Irish Census the Central Statistics Office captured data on communing to work and school/college (POWSCAR). The raw data is available for research purposes, but the anonymised data is available to all. This data is aggregated to an Electoral Division (ED) level.
There are 3440 EDs in Ireland, 3409 after amalgamating low population ones. These are legally defined administrative areas. Commutes into Northern Ireland are also captured, but only as one destination (Northern Ireland).
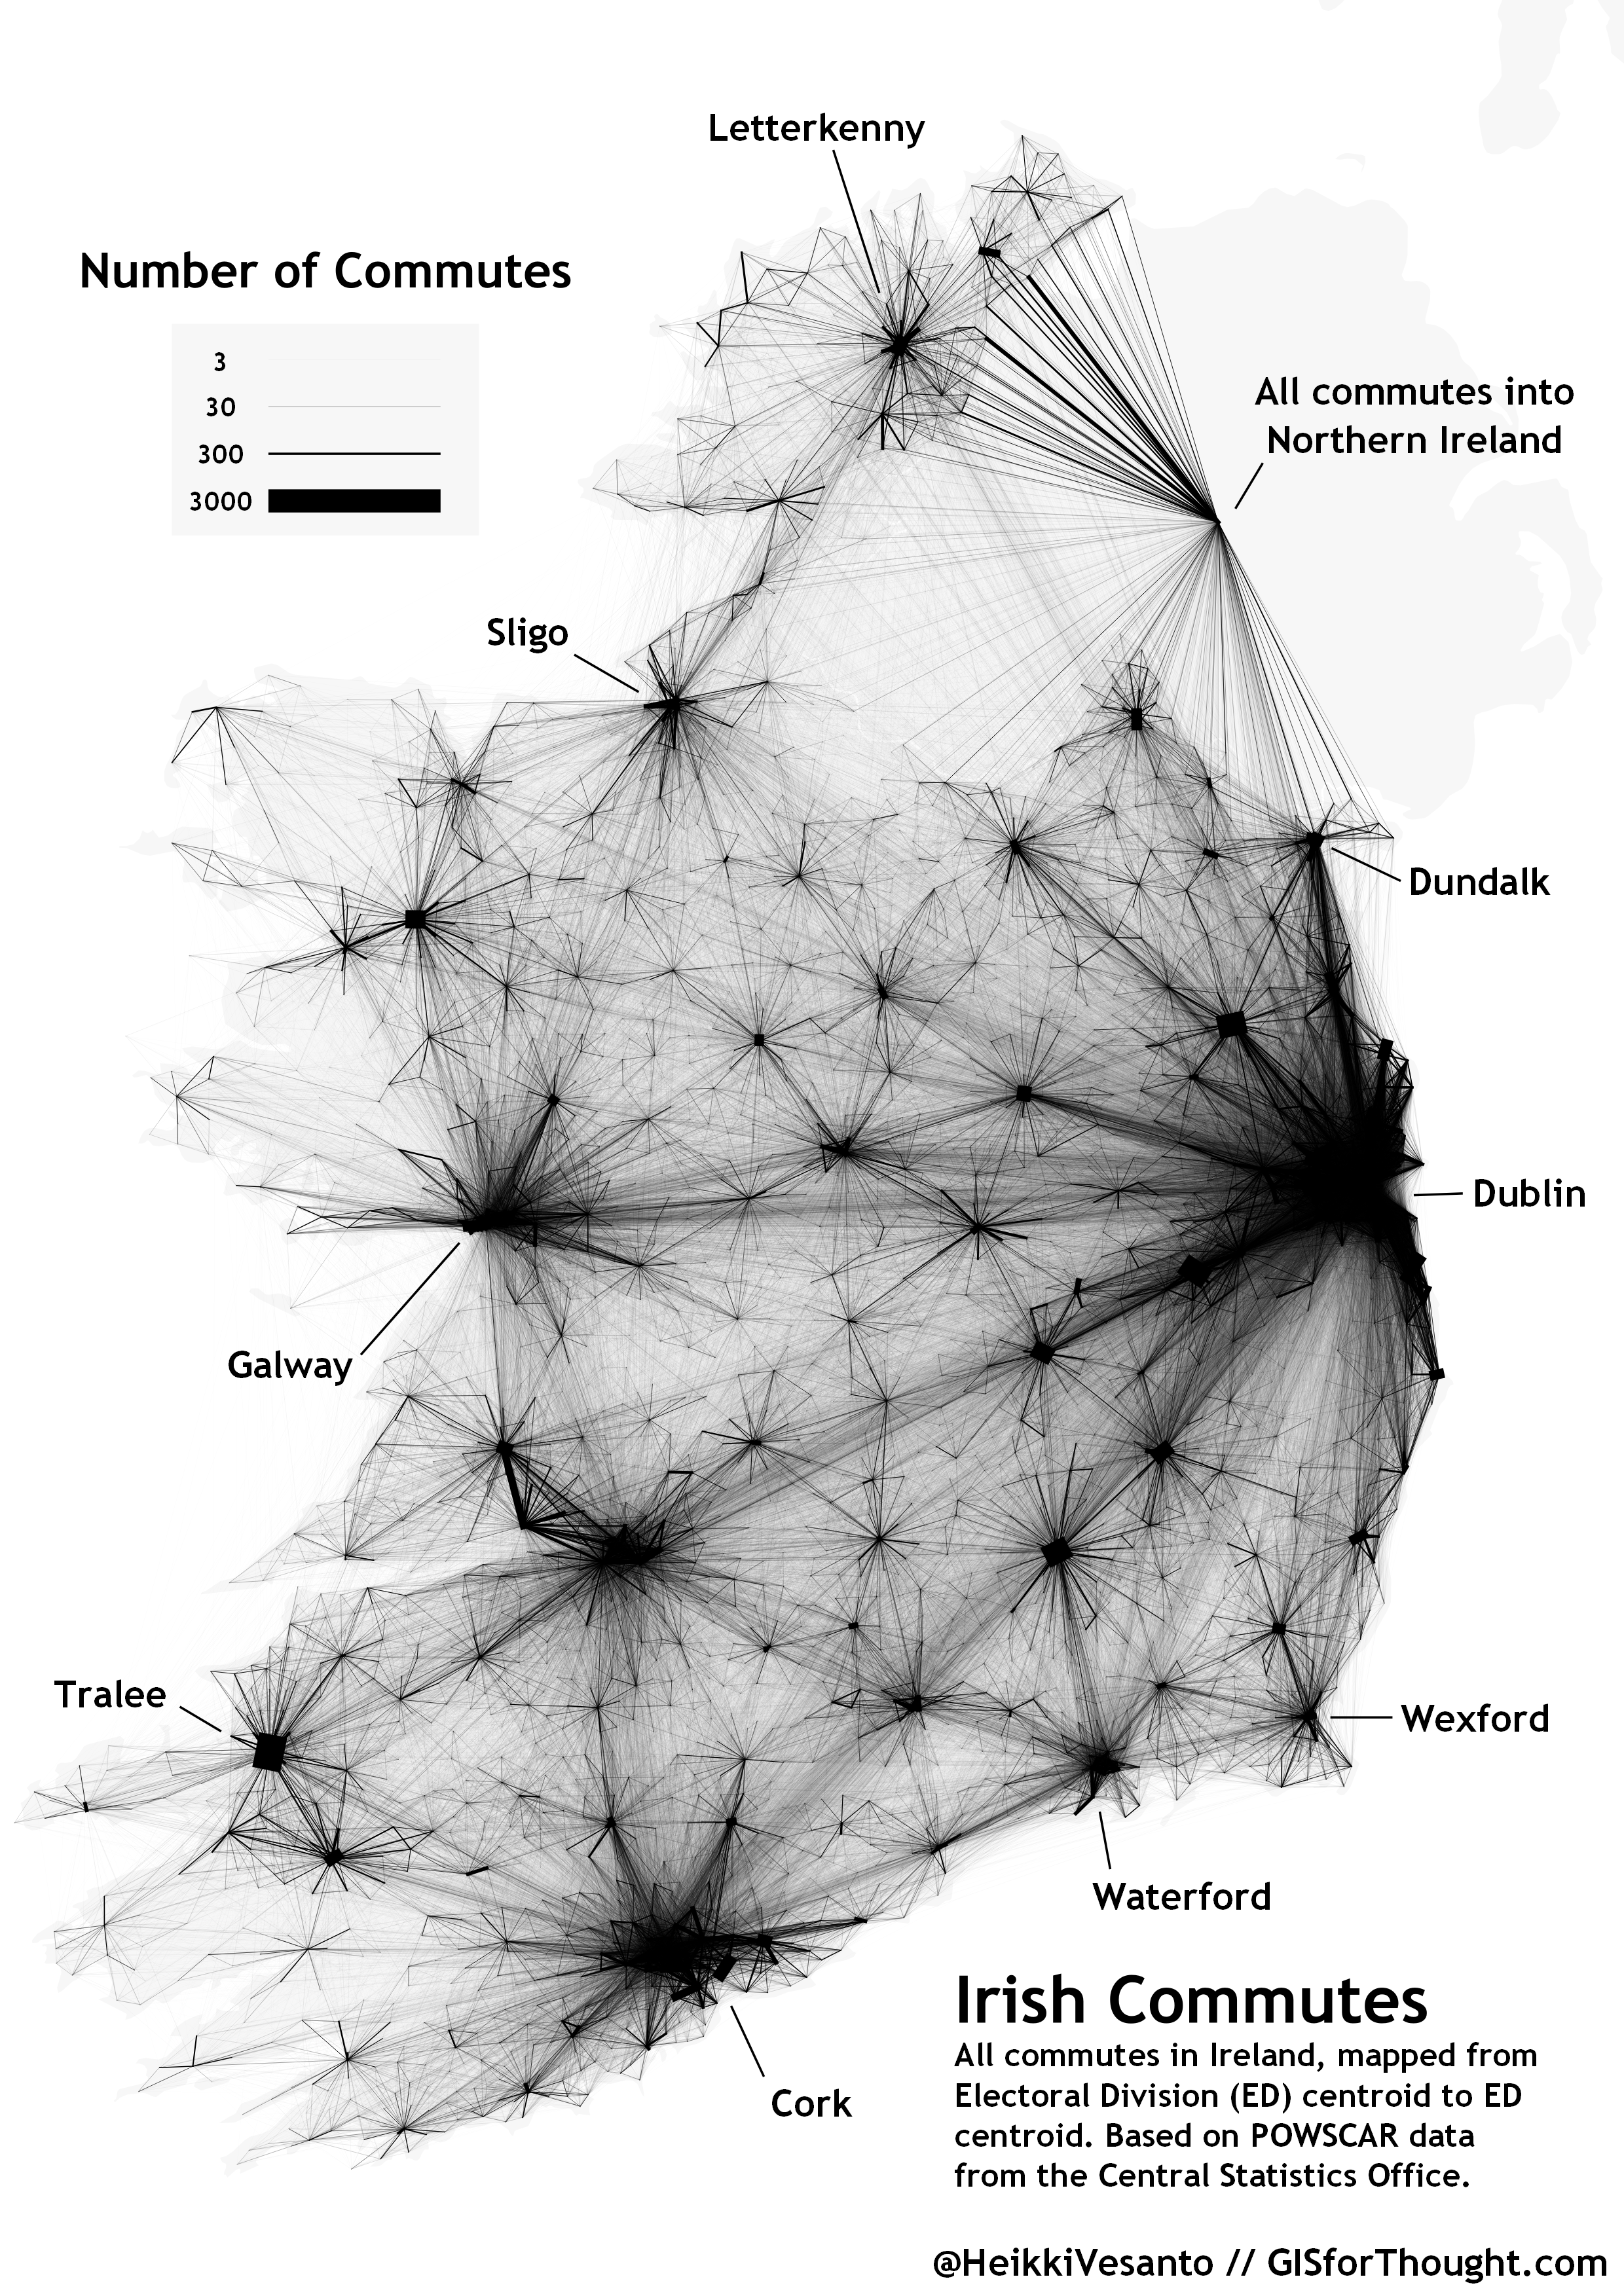
Overall the data consists of a CSV file with 291893 rows of commuting data.