No GIS in this post, so best to skip if you are not interested in UK election results.
The data has been released by the electoral commission, so I thought I would run a few queries in PostgreSQL to look at the numbers. These queries are based on the initial results, so may be subject to change.
The raw data can be found from: the Electoral Commission.
First lets have a look at the description on the ballot paper (The party name or description used by the candidate on the ballot paper.) and look at a count of each:
[table file=”https://raw.githubusercontent.com/HeikkiVesanto/UK_2015_GE_Results/master/Description_on_ballot.csv”][/table]
Some descripancies to note are extra spaces in the raw data. Overall a good correlation might be to look how many descriptions each party has and election outcome.
Next what I have found puzzling is some of the analysis based on raw voter numbers. One example by AVAAZ.org:
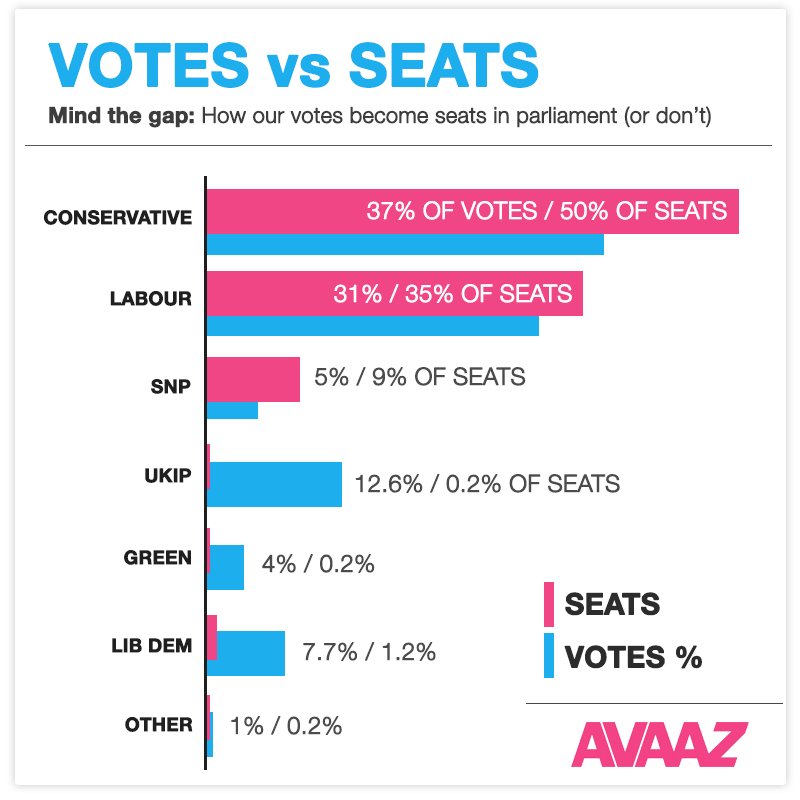
I find it misleading to say that the SNP only received 5% of the vote. They only revived 5% of the vote overall, but even had they received a 100% vote in Scotland, and voter turnout in Scotland had been 100% they would still only have received 4094784 votes. Had the SNP run in more than the 59 Scottish constituencies, then they would have revived more overall votes. It is useless looking at overall votes compared to seats, the percentage of possible votes provides a better comparison in my opinion with the current electoral format.
To do this the data needed to be slightly cleansed, with some descriptions combined, for example:
Lib Dems are made up of:
“liberaldemocratstrongereconomyfairersociety”, “liberaldemocratsstrongereconomyfairersociety”, “liberaldemocratsdemocratiaidrhyddfrydolcymru”, “liberaldemocrats”, “liberaldemocratfocusteam”, “liberaldemocrat/democratiaidrhyddfrydol”, “liberaldemocrat”
And conservatives:
“conservatives”, “conservativeparty/ymgeisyddplaidgeidwadolcymru”, “conservativeparty”, “conservativeandunionistparty”, “conservativeandunionist”
[table file=”https://raw.githubusercontent.com/HeikkiVesanto/UK_2015_GE_Results/master/Clean_Step_2.csv”][/table]