
As everyone will no doubt have heard, Scotland voted in a referendum on independence on the 18/09/2014. The vote was no, but it presents an excellent opportunity to visualise election results.
Addition From Black
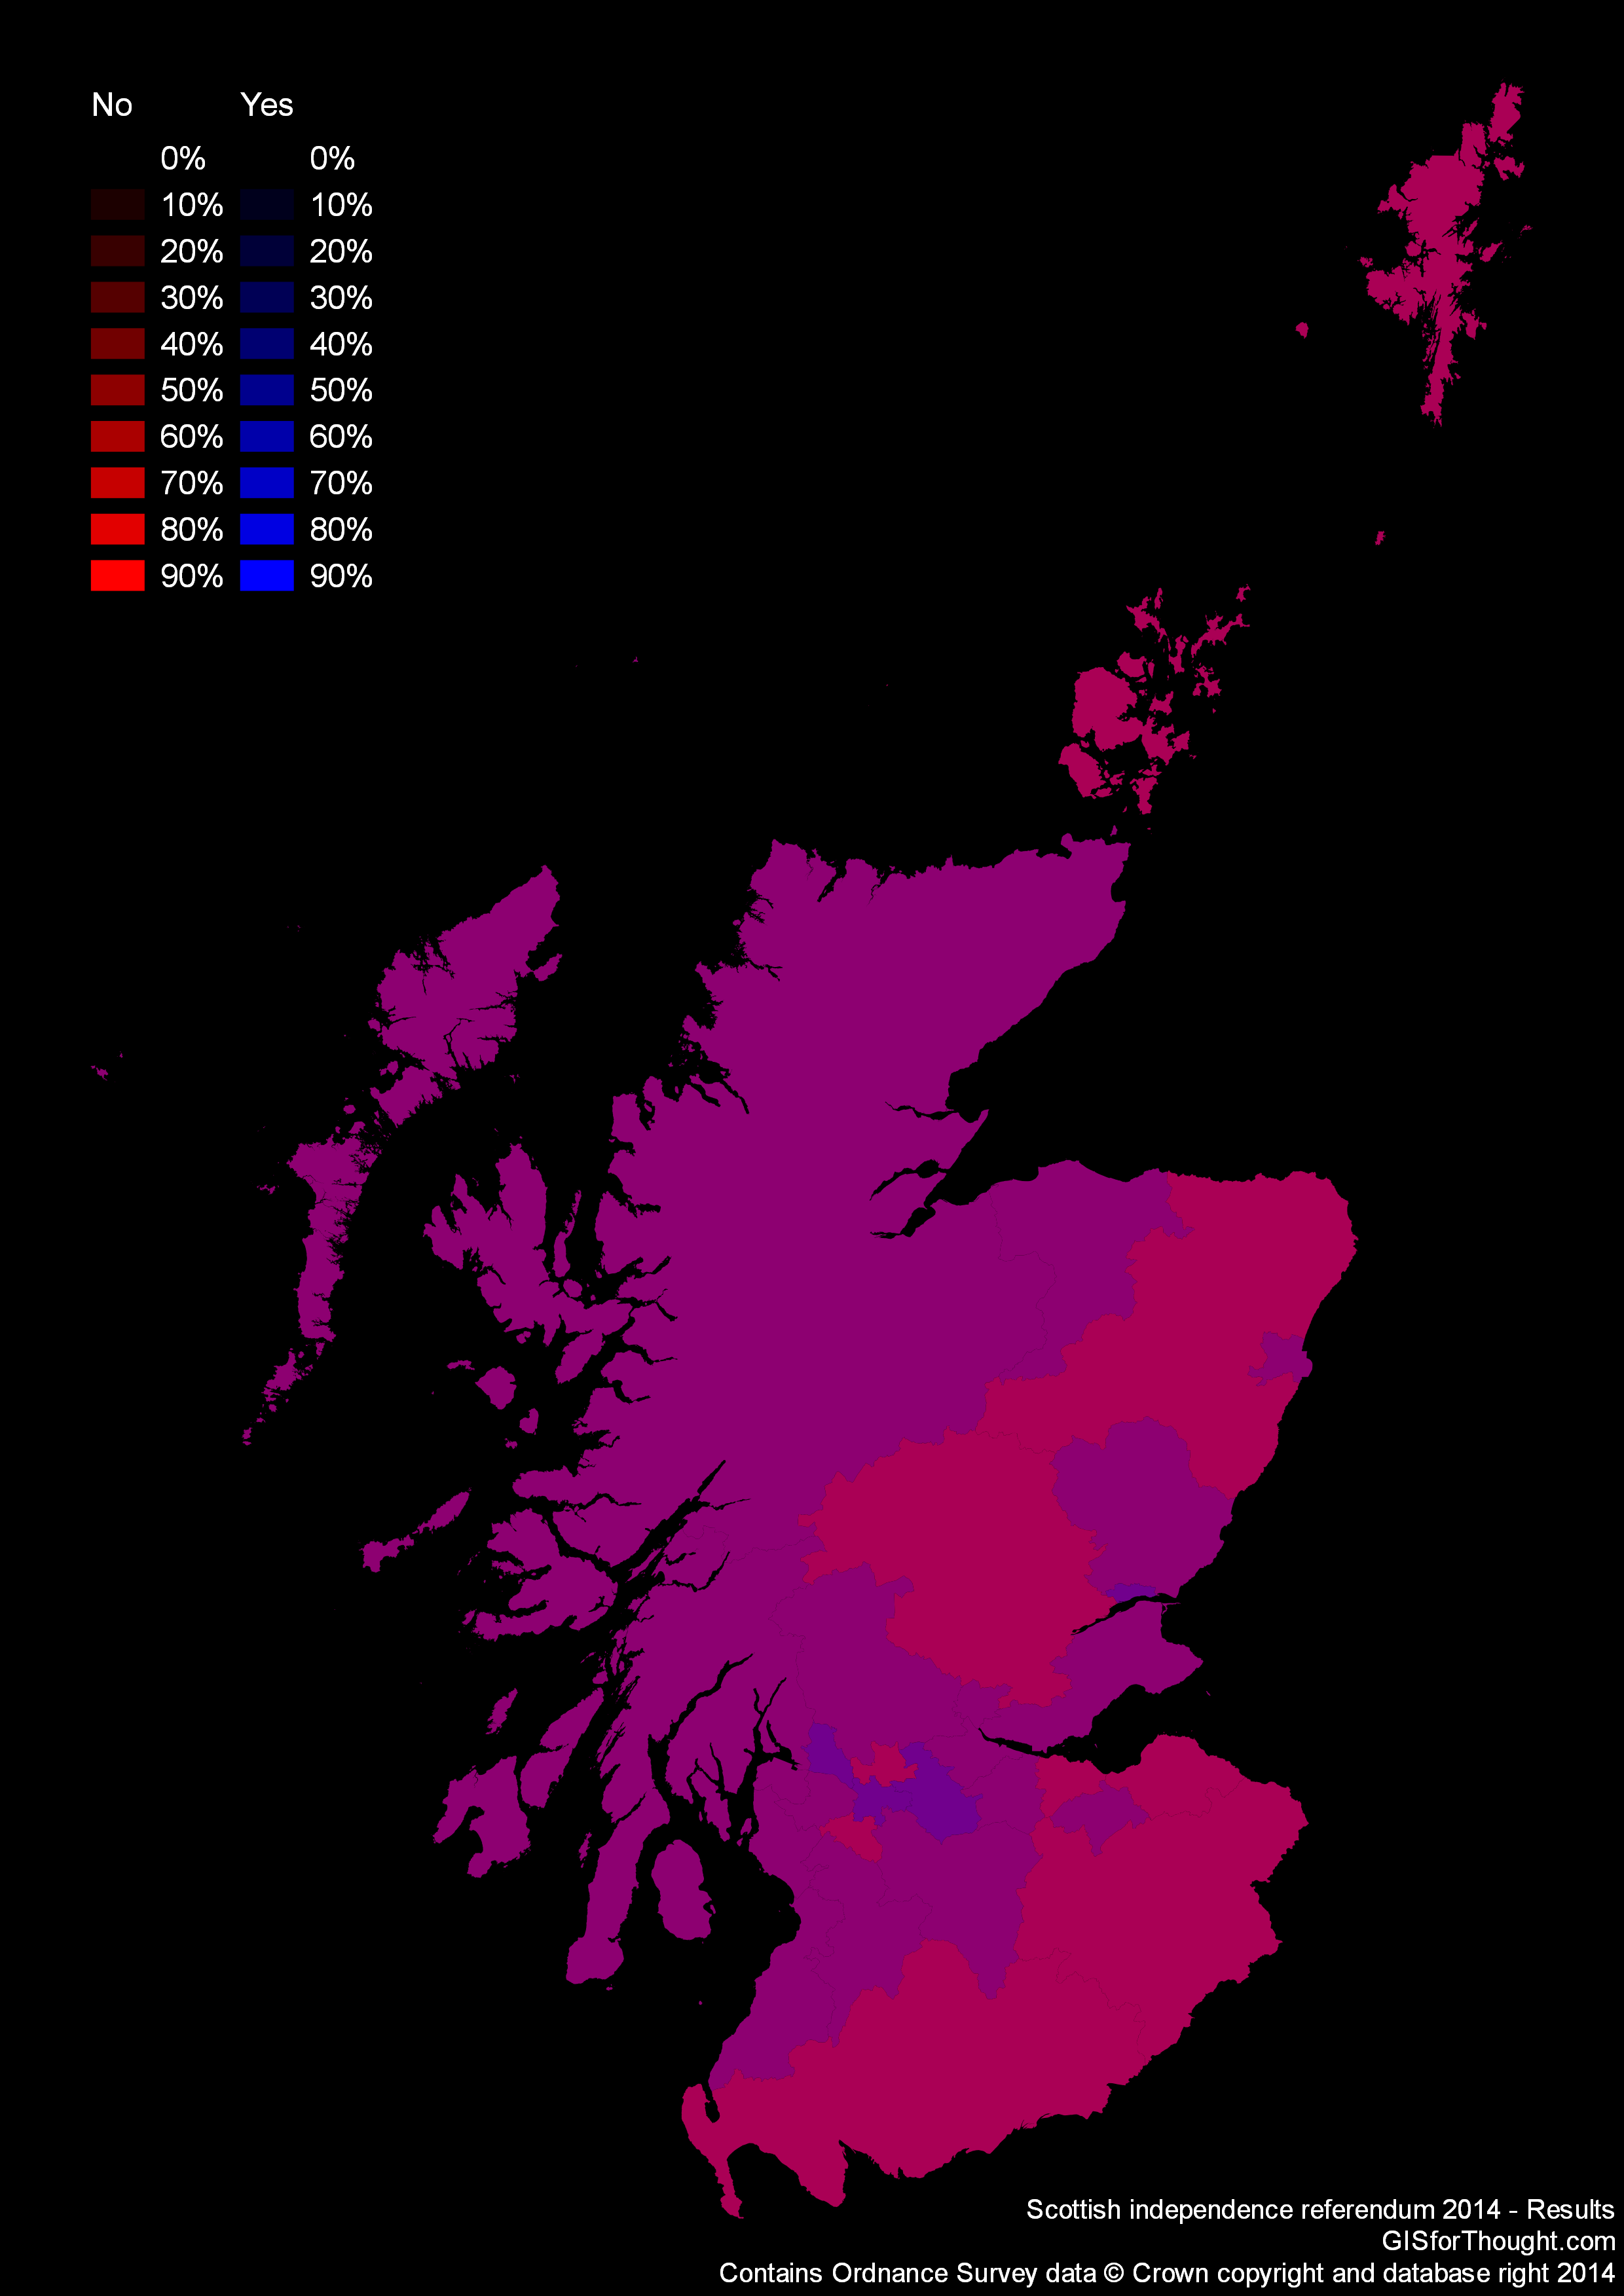
We start with a black background since in RGB 0,0,0 is pitch black. Then we have 2 datasets with graduated colour scheme from completely transparent to completely red/blue. We use the percentages per council area to show the split, but using absolute counts could also work. These layers have the blending mode of “Addition” so they stack creating a purple map, with the redder areas voting no and the bluer areas voting yes.
Bar Graph
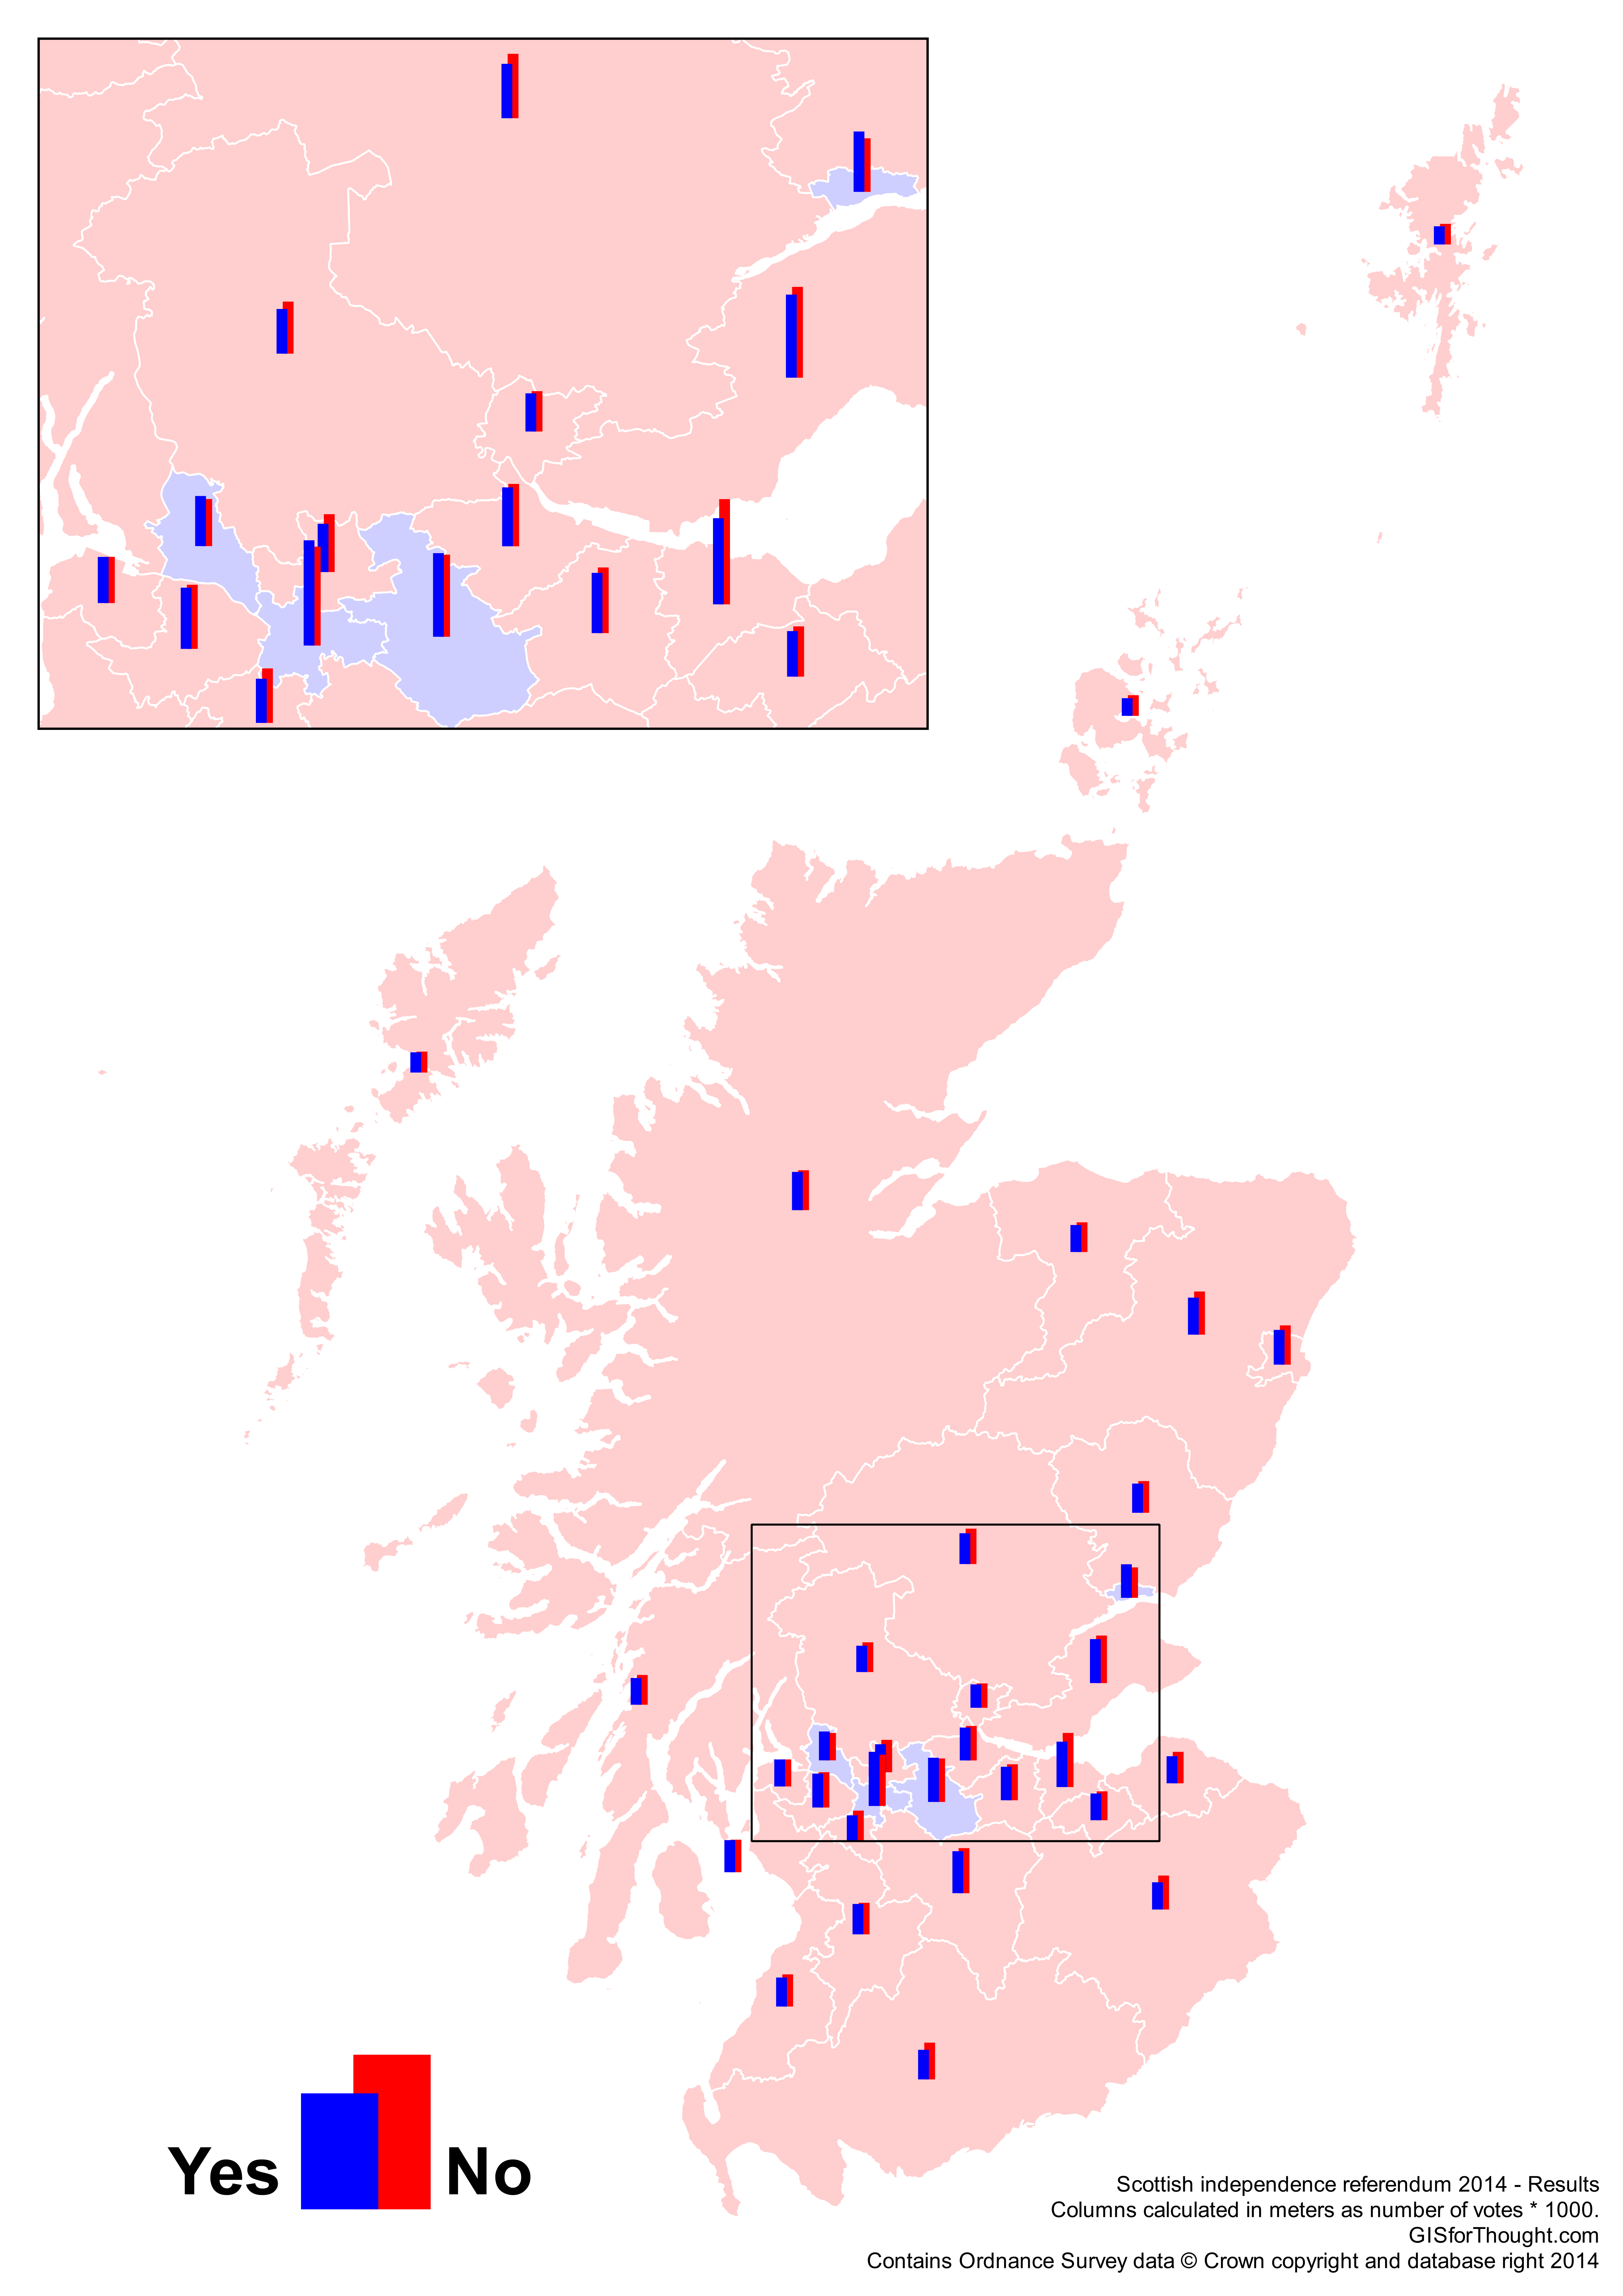
This is more of a proof of concept than a truly functional map. The bars are created from the polygon centroids as a line symbol. The length of each bar plotted in meters from a calculation of the number of votes * 1000. I found out that this could be more easily created using the diagrams feature, which would produce the same result without the need for creating centroids and allow for more placement options.
Data Driven Opacity and Hue
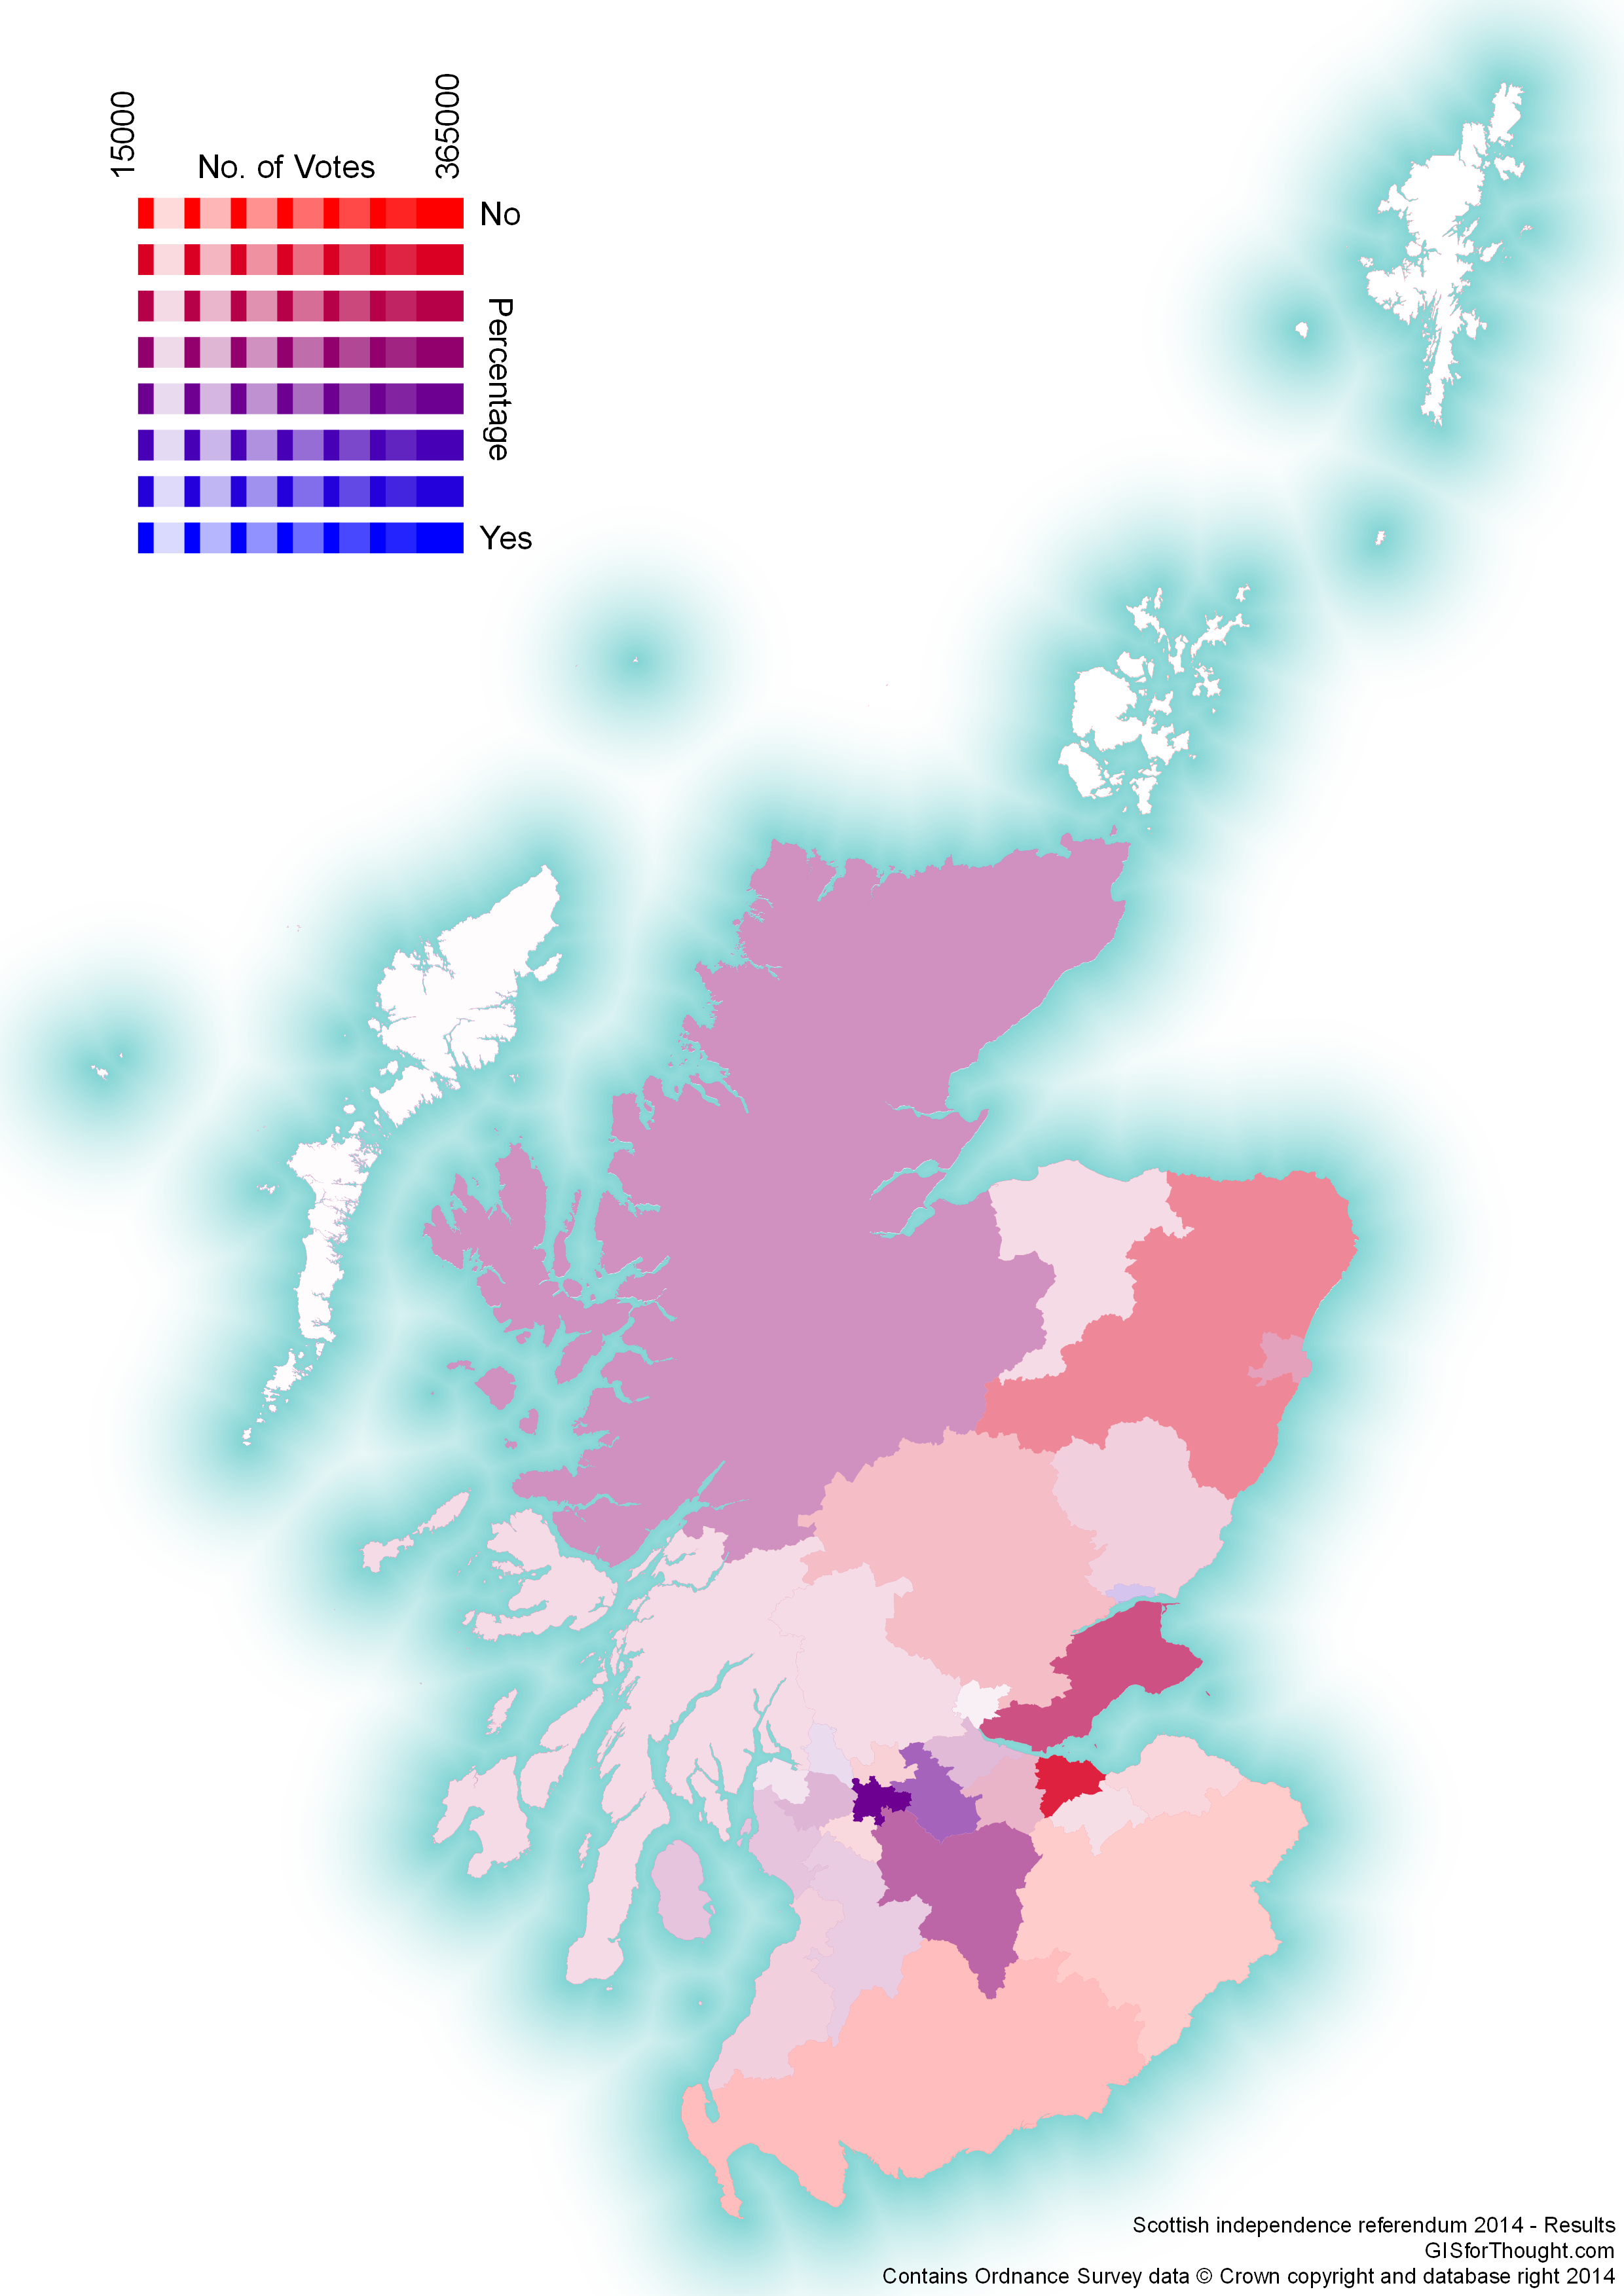
Simple Red to Blue gradient from the percentage of yes votes. So from 30% to 70%, providing a nice gradient of the vote outcome. Above this was place a completely white layer, which had its alpha channel driven by a normalized total voters field. So Glasgow has a white 100% transparent feature over it, while Orkney has a 0% transparent feature. This symbolises the impact of each councils vote and the result.